Research on vocabulary knowledge in second language (L2) learners has for the most part concentrated on developing measures to assess the proficiency or vocabulary size of individual learners. This study addresses a different but related question: how does an experimenter or researcher choose words that learners of an L2 are likely to know during acquisition? Experimenters may need to select words likely to be known by learners to test non-lexical aspects of L2 knowledge. Similarly, when constructing materials for students, instructors must in some cases choose materials so that learners are likely to already know the words in a lesson, so that other, non-lexical aspects of the lesson are conveyed effectively. For child language learners there are vocabulary tests such as the Peabody Vocabulary Test (Dunn and Dunn, Reference Dunn and Dunn1997) available with estimates regarding which words are known at a particular age. No such tests exist for second language learners. Conversely, researchers will sometimes require words that learners are unlikely to know, if a study is designed to examine how learners process or learn unfamiliar words. On what basis should these choices be made?
A straightforward answer seems to be that words should be selected on the basis of their lexical frequency. Word frequency is an important factor in second language acquisition (SLA), as learners tend to recall (Laufer, Elder, Hill and Congdon, Reference Laufer, Elder, Hill and Congdon2004) and recognize (Brown, Reference Brown1993) words that are more common in a given language better than less frequent words. Based on this relationship between lexical statistics and vocabulary knowledge, it is generally accepted that knowing less frequent words is indicative of having a larger vocabulary or, as Meara (Reference Meara2005, p. 32) puts it, “[the] use of frequency bands to characterize vocabulary is a fairly standard practice in L2 vocabulary studies”. However, the available word frequency data are based on samples from different sources such as newspapers, books and conversation, and this leads to the problem of whether estimates from all sources are equally appropriate for the population of second language learners. Samples of language use from which a set of words is selected may be biased in the sense that some of the properties of the sample words may not represent accurately the properties of the entire language from which it is sampled while other properties may in fact be represented accurately. In newspaper text, for example, words related to certain topics, such as politics, are typically overrepresented. When constructing materials for experiments or teaching purposes, the bias of the corpora should not enter as a bias in the materials.
More importantly, the language to which learners are exposed and therefore the vocabulary they acquire, is itself biased. Even an ideal sample that represents the entire language correctly would not necessarily yield a frequency estimate that optimally predicts the vocabulary of learners. Most clearly this is the case for classroom learning where the frequency of words that learners encounter does not reflect the entire language, but rather the teaching materials. It is known that words that are more commonly encountered in school are more likely to be known on vocabulary tests. This has been demonstrated in experimental studies of vocabulary acquisition in reading (Pitts, White and Krashen, Reference Pitts, White and Krashen1989; Day, Omura and Hiramatsu, Reference Day, Omura and Hiramatsu1991; Dupuy and Krashen, Reference Dupuy and Krashen1993; Hulstijn, Hollander and Greidanus, Reference Hulstijn, Hollander and Greidanus1996; Rott, Reference Rott1999), as well as through an empirical demonstration that the frequency of words presented in classroom materials predicts the likelihood of a correct answer on tests of vocabulary (Vermeer, Reference Vermeer2001), and demonstrations that textbook appearance can be used as a predictor for word recognition ability (Van Gelderen et al., Reference Van Gelderen, Schoonen, De, Hulstijn, Simis, Snellings and Stevenson2004; Fukkink, Hulstijn and Simis, Reference Fukkink, Hulstijn and Simis2005).
The problem of the classroom bias suggests the possibility that the occurrence of words in teaching materials such as textbooks may in fact be more informative with respect to early vocabulary than corpus frequencies, at least for classroom learners. Biases of the language that untutored learners are exposed to are obviously much more variable depending on the context of language input. Assuming, however, that textbook authors have a good intuition about the kind of vocabulary all language learners, irrespective of their learning circumstances, need, it is possible that textbook occurrence may be a good predictor for the early vocabulary of untutored early learners as well.
The goal of the present paper is to assess whether multiple data sources may be more effective than single data sources to predict the words that language learners are likely to know. We will first address the question of how word frequencies estimated from corpora are related to textbook vocabulary. Do frequency estimates from text corpora predict textbook occurrence with equal effectiveness as those from spoken corpora? In a second step, we will describe an estimation procedure using several data sources at once. We will assess which combination of word frequency data from speech and text corpora and occurrence in learner textbooks best predicts the occurrence of nouns in a corpus of untutored L2 learners' speech. The goal is to find nouns that learners are likely to know across a broad range of settings both inside and outside the classroom.
Method
In the analyses reported below, we investigate the relationship between three types of information: (1) Estimates of noun form frequency taken from spoken and written corpora representing a wide variety of word usage, (2) vocabulary lists taken from adult foreign language learning textbooks, and (3) estimates of word usage taken from a small sample of untutored language learner speech based on a film description task. The goal for the analysis is to characterize the relationship between different corpus frequencies and to evaluate how well different corpus frequencies, learner textbook occurrence, and different combinations of these data sources predict actual learner production. Based on the best-predicting combination, the analysis should provide a list of words that second language learners are likely to know and use.
Word frequency lists typically contain a list of word forms paired with the number of instances of the word form in a corpus sample. Word frequency distributions are heavily skewed with the majority of word types having very low frequencies. This skew is a problem for researchers who wish to select common words because the numerical value of any frequency estimate will depend heavily on the size of the sample of speech or text. This makes it difficult to choose a fixed frequency count as a threshold for common words. In the example lists described below, we selected from word form frequency lists words with frequencies above the log average frequency based on words with frequencies > 1 in order to reduce the influence of very low frequency words. Rank information could be used in place of frequency counts, but frequencies potentially contain information that is lost in ranks. There may be a large difference between two rank-adjacent words in frequency, yet another pair of rank-adjacent words may have a small difference in frequency.
Two corpora were used for this study, the CGN (Corpus Gesproken Nederlands or the Spoken Dutch Corpus) and CELEX. The CGN word frequencies (Oostdijk, Reference Oostdijk, Gravilidou, Carayannis, Markantonatou, Piperidis and Stainhaouer2000; based on version 1.0 of the Spoken Dutch Corpus) were based on nouns taken from the CGN Lexicon portion of the corpus (Dutch and Flemish, comprising 181,579 word forms). Frequencies were scaled to frequencies per million. Only the single word-form frequencies were included in the analysis presented (the corpus includes information for multiple-word forms (phrases) in a separate lexicon). The corpus consists of samples of conversational and non-conversational speech including telephone conversations, debates, broadcast news reports and commentary, speeches, and lectures (a detailed description of the components is available in the documentation of the distributed corpus).
The CELEX word frequencies (Baayen, Piepenbrock and Gulikers, Reference Baayen, Piepenbrock and Gulikers1995) were based on the word form and word lemma frequencies included in the CELEX database. CELEX frequencies for Dutch are based on a sample of fiction (30%) and non-fiction (70%) books published between 1970 and 1988. The word frequency estimates do not include material from newspapers, magazines, children's books, or textbooks.
The words from the textbooks were taken from three modern introductory language textbooks for Dutch (selected because they were conveniently available): Taal vitaal: Nederlands voor beginners (Schneider-Broekmans, Reference Schneider-Broekmans2000), Dutch for self-study (van Kampen and Stumpel, 2002), and Colloquial Dutch: The complete course for beginners (Donaldson, Reference Donaldson1996). All three textbooks are aimed at beginning learners of Dutch and include word lists. For the word form-based analyses described below we expanded the set of words from the textbook word lists (which only provide citation forms) by adding to it all noun forms of the lemma. If the word kat “cat” appeared in the textbook list, for example, then katten “cats” and katje “cat, diminutive”, and katjes “cats, diminutive” were added to the expanded textbook list.
Textbook wordlists, including the textbooks chosen in the present study, are likely to be selected based on word frequency (Bossers, Reference Bossers, Hulstijn, Stumpel, Bossers and Van Veen1996). Beginner textbooks concerning Dutch commonly use a wordlist compiled in De Kleijn and Nieuwborg (1983), based on frequency estimates produced in Uit den Bogaart (Reference Uitden Bogaart1975). While it would therefore be expected that word frequency would predict whether a word will be found on a textbook wordlist, earlier word frequency estimates have largely been based on text, and not speech, as large speech corpora have only become available recently. It is therefore not clear whether both types of frequency estimates would contribute to the prediction. In the present paper, the relative predictive power of text versus speech word frequency estimates is compared.
The learner production data consisted of words taken from a film-re-telling task collected as part of the European Science Foundation (ESF) Second Language Learner corpus (see Perdue, Reference Perdue1984; Reference Perdue1993 for details). The film re-tellings covered restricted portions of Chaplin's film “Modern Times”. The corpus consisted of the film descriptions of four Moroccan and four Turkish immigrant learners of Dutch on two measurement occasions (two re-tellings of the same film) within the first year of learning Dutch. As such, the film re-tellings represent a sample of L2 production in which the same participants produced descriptions of a singe film, in many ways like an experimental setup in which different participants produce sentences to an experimental stimulus set. The learners in this sample were untutored, that is, learners without exposure to classroom teaching and textbook materials.
For the nouns that were found in the Dutch learner textbooks, we estimated how well the spoken and written Dutch corpora (CGN and CELEX) frequencies predicted the status of a word as a textbook vocabulary entry (yes or no) using logistic regression. We use logistic regression to determine how strongly spoken and textual frequencies are related to the propensity to be found in an introductory Dutch textbook wordlist. For the analyses presented below, we compared model fits using deviance (p-values are reported for 1-df Chi-square comparisons), as well as the Akaike Information Criterion (AIC; Akaike, Reference Akaike1974) using stepwise comparison (both forward and backward) of model terms. AIC is a criterion for selecting between different statistical models (such as regression models), and is used widely in regression analysis. It is defined as –2L –2m, where L is the log likelihood of the model under consideration, and m is the number of parameters in that model. The general benefit of applying AIC is that it takes into account both the goodness of fit (the likelihood of the model) as well as the number of parameters in the fitted model (the model complexity); smaller AIC values indicate a better-fitting model. Normalized differences in AIC values between competing fits can be interpreted as proportional likelihoods. To ensure that the results of our analyses did not depend on assumptions about the exact nature of the entries in the learners' mental lexicon (e.g. whether or not unanalyzed inflected forms are listed), we estimated the fit based on word forms as well as on lemmas (summed frequencies of all forms of a word).
Results
Corpus predictions of textbook vocabulary status
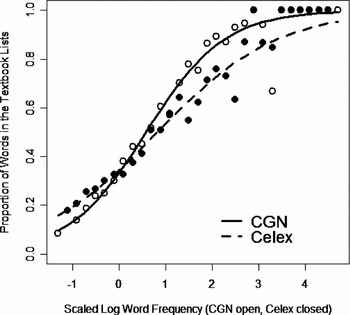
Figure 1 shows the empirical proportion of word forms present in the textbooks and the predicted proportions for the models including CGN or CELEX for the range of scaled log CGN and CELEX form frequencies. This plot shows how the more common words in either of the corpora are more likely to be found in the textbooks, especially for the range of standardized frequency from 1.0 to 3.0. A model that included a positive term for CGN log frequency was the best-fit model (AIC = 4541), compared to CELEX alone (AIC = 5039). The model that included both CELEX and CGN (AIC = 4540) did not significantly improve the fit over the CGN-alone model (p = 0.1). The parameters for the best-fitting model were Proportion_Textbook = –0.7039 + 1.1959 * Frequency_CGN.
Status as a textbook vocabulary item (0 = no, 1 = yes) based on form frequency. Solid line is the predicted proportion based on the fitted model with CGN as a predictor, dashed line with CELEX; open circles are the empirical proportions for CGN calculated at histogram intervals of the centered and scaled frequency distribution, filled circles are the CELEX proportions.

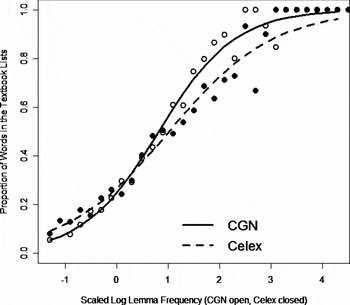
An additional analysis was conducted by using CELEX and CGN lemma frequencies rather than form frequencies. Figure 2 shows the empirical proportions of lemmas present in the textbooks and the predicted proportions based on the models including CGN or CELEX for the range of scaled log CGN and CELEX lemma frequencies. Note that given that there are more low frequency than high frequency words, the parameters of the best fitting models will be such that the predictions for the low frequency ranges are better. It then appears that predictions based on CELEX underestimate textbook appearance for higher frequency items. Results of this analysis were similar to the previous analysis. The best fitting model included only CGN log lemma frequency (AIC = 3057), compared to CELEX alone (AIC = 3390; p < 0.001), and the conjunction of CGN and CELEX frequencies (AIC = 3062) did not improve the fit (p = 0.48) over CGN alone. The parameters for the best-fitting model were Proportion_Textbook = −1.1071 + 1.3528 * Frequency_CGN.
Status as a textbook vocabulary item (0 = no, 1 = yes) based on lemma frequency. Solid line is the predicted proportion based on the fitted model with CGN as a predictor, dashed line with CELEX; open circles are the empirical proportions for CGN calculated at histogram intervals of the centered and scaled frequency distribution, filled circles are the CELEX proportions.

Appendix A contains a list of the 200 noun lemmas with the highest predicted probability of being found in a textbook based on this equation. For example, for the lemma tijd “time”, the predicted proportion of 0.9833 is obtained by log transforming the CGN frequency (i.e., LOG(1 + 903)) = 6.806829), scaling this value according to the mean (2.224635) and standard deviation (1.195641) of the log CGN frequencies (i.e., (6.806829 – 2.224635)/1.195641 = 3.832417), multiplying this value by the model coefficients (i.e., −1.1071 + 1.3528 * 3.832417 = 4.0774) and substituting this value into the equation for the logistic (i.e., 1/(1 + EXP(−4.0774)) = 0.9833).
In sum, spoken word form frequencies predicted the occurrence of words in learner textbooks better than written word form frequencies, and taking written word form frequencies into account did not improve the prediction based on spoken word forms alone. One interpretation of the results is that while both CELEX and CGN are correlated (r = 0.765 for log word form frequencies), there is a difference in variability of the frequency estimates. Apparently, some of the variability of the spoken word form frequencies predicts textbook status, but is not related to the variability in frequency that is shared with the written word form frequencies.
A possible explanation for the better fit of the model that is based on CGN frequency is that the vocabulary lists from the textbooks may include items that are common in colloquial speech, which may not be common in written text for stylistic reasons. Written text is often edited, for example. This could be due to characteristic terms used in speech and not in books, or vice versa. However, not all differences are entirely straightforward or predictable from genre differences: e.g. as seen in Appendix A, the lemma frequency for soort “sort”, is 1050 in CGN but only 75 in CELEX. Conversely, for hand “hand”, the frequency is 1028 in CELEX and 342 in CGN. This difference in frequencies would not be expected based on genre alone. This illustrates that different data sources may capture aspects of frequency estimates that are not otherwise easily modeled.
Corpus and textbook predictions of learner usage status
The previous analysis showed that the CGN corpus frequency better predicted whether or not a word appeared in textbook vocabulary lists than CELEX corpus frequency. It can, therefore, be assumed that spoken frequency predicts classroom vocabulary acquisition better than written frequency, given that the appearance of words in teaching materials predicts their likeliness of being learned in tutored SLA. We will now examine to what degree spoken or written corpus frequencies, as well as status as a textbook vocabulary item, predict whether a word is in the active vocabulary of early untutored learners of Dutch.
It can be expected that for a given sample of words that learners use, a large-corpus frequency estimate would predict whether or not a word appears in the sample because the more likely a word is in a language, the more likely it will be observed, by definition. What is important in the present case is whether or not one frequency estimate is better than another, or whether an ensemble of frequency estimates is better than any single estimate.
In contrast to the situation in classroom learning, which is highly structured according to a syllabus or a textbook, untutored language usage by learners is opportunistic, and structured according to the communicative needs of the learner. It is therefore possible that textbook status will not predict learners' usage, along with, or in addition to, corpus frequency estimates. To investigate this question, we matched the nouns from the textbook list and corpora samples against the nouns appearing in a sample of spoken usage words from the film re-telling task of the Dutch portion of the ESF Second Language Learner corpus (Perdue, Reference Perdue1984, Reference Perdue1993).
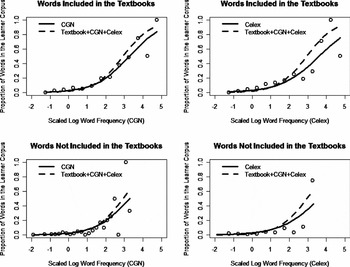
Figure 3 shows the fit of the best-fitting model against the empirical proportions of words found in the film re-telling task as a function of form frequency for words found and not found in the textbooks. The best-fitting model included positive terms for both CGN and CELEX word frequency as well as textbook status (AIC =1298); Proportion_Learner_Usage = −3.9373 + 0.6620 * Textbook + 0.6793 * CGN_Freq + 0.3550 * CELEX_Freq. It should be emphasized that all three data sources were predictive of learner usage. However, in addition, the parameters of this model indicate that the change in proportion of learner usage related to Textbook status and CGN frequency was almost twice as large as the proportional increase related to CELEX frequency. The model with all three data sources was significantly better than models including textbook alone (AIC = 1503; p < 0.001), or textbook with CELEX alone (AIC = 1330; p < 0.001), or textbook with CGN alone (AIC = 1310; p < 0.001). Appendix B contains the forms ranked by the predicted proportion of the best-fitting model.
Word usage in the ESF film-retelling task (0 = no, 1 = yes) as function of word frequency and textbook status. Circles are the empirical proportions as calculated at histogram intervals of the centered and scaled frequency distribution.

For a comparison to the previous analysis of frequency as a predictor for textbook status, we also fit models with CGN and CELEX without textbook status as a predictor for learner usage. The model parameters for the single term models (either CGN or CELEX) were of similar sign and magnitude as in the previous analysis. A model that included positive terms for CGN as well as CELEX log frequency was the best fit model (Proportion_Learner_Usage = −3.6489 + 0.8125 * CGN_Freq + 0.3506 * CELEX_Freq; AIC = 1308), com-pared to CELEX alone (AIC = 1363; p < 0.001), or CGN alone (AIC = 1320; p < 0.001). Although there is a difference in the fitted model parameters, it should be emphasized that CELEX frequencies did not greatly improve the model fit in the present analysis, as the difference in AIC between the full model and CGN-alone model is not large (1308 versus 1320).
This analysis revealed that for learner usage during a relatively early period of adult language learning, a combination of predictors is a more effective model of usage than any single predictor. In addition, the CGN word frequency and textbook status were stronger predictors than CELEX word frequencies. Without textbook status in the model, both CGN and CELEX were positive predictors, although again the relationship with CELEX was proportionately smaller.
Discussion
The analyses presented here revealed that both spoken (CGN) and written (CELEX) corpus frequency estimates predicted whether a word would be used as a vocabulary item in textbooks. However, spoken word frequencies predict best what learners are most likely to read in the classroom and including written frequency estimates did not result in a better prediction than spoken frequencies alone.
By contrast, in the analysis of actual (untutored) learner usage the model that predicted best whether speakers used a word in a film re-telling task included both spoken and written corpora and, surprisingly, even the textbook status of words. Given that our first analysis showed that all three sources are highly correlated, this result suggests that what makes combined estimates helpful is the variability in estimated frequency which is not shared among the sources. As a practical consequence, this result shows that no single word frequency count may be best for predicting learner usage or – assuming that usage and comprehension are highly correlated (Laufer et al., Reference Laufer, Elder, Hill and Congdon2004) – learner vocabulary knowledge. Instead, a broad sample of many different language use domains should be used, if it is available. In cases where fewer sources are available, the use of textbook status and written frequency estimates alone appear problematic, but their combination was almost as good as spoken frequency estimates. An interesting extension of the present analysis would be to use frequency of occurrence in a textbook as a predictor variable, if this information could be obtained in a convenient form.
Although the models were fitted to predict occurrence in learner speech about just one specific film topic, it is important to note that they also predict the use of words in other contexts. The words tijd “time”, uur “hour, o'clock”, geval “case”, leven “life”, aantal “number”, jaren “years”, wereld “world”, manier “manner”, vraag “question”, for example, are highly predicted although they are not used in the film re-tellings. This is not a flaw of the model. Simply speaking, the models find properties of words (e.g. to have a certain CGN frequency, to occur in textbooks) that make them likely to be used more often during the film re-tellings. Other words that have not been used during the film re-tellings may nonetheless have similar properties, so in a sense they are predicted to be used when talking about an appropriate topic. Of course, even in L2 learners the choice of words used is more strongly determined by what they are talking about than how well they know certain words. It is for the same reason that a broad sample of many different language use domains predicts learner usage best. A broad sample reflects better than any single source what people talk about in different contexts and therefore what is common in a language.
It is quite possible that the first language of an L2 learner could influence the likelihood that low-frequency L2 words are produced. If the L1 and L2 of a learner share cognates which happen to be low frequency, for example, then these words would be produced more often by that learner because of they would be already known (as cognates). A learner of the same L2 but with a different L1 that does not share the cognates would be less likely to produce these words.
Why are words that are more common in a language learned earlier than less common words? Perhaps the simplest explanation might be that commonly encountered words are simply needed more, other factors being equal, in order for effective communication to occur. Experimental research on memory has demonstrated that the so-called need probability of memory items (Anderson and Schooler, Reference Anderson and Schooler1991) can be used to account for a variety of effects in research on memory including the shape of practice and forgetting functions, also including those of L2 lexical acquisition (Pavlik and Anderson, Reference Pavlik and Anderson2005). The need probability of an item is simply the probability that some item of information to be learned will be required again in the future. Lexical frequency can be seen as an estimate of the probability that a word will be required again sometime in the future. A productive line of research may be to relate how different aspects of lexical frequency, recency of encounter, and prior exposure over a learner's lifespan may predict learner's acquisition and retention of L2 words.
Several caveats to the approach we have taken are in order. In the present study, we considered whether two relatively large corpora would be useful in predicting learner usage. This might suggest that using even a larger number of data sources would improve predictions even more. However, the cost of obtaining each source has to be weighed against the potential decreasing utility of extending the number of data sources. It is sometimes time-consuming and expensive to obtain additional corpus data (especially with regard to speech data), and if there are already several data sources available, new sources may not add much more predictive ability. Second, if the data that are used are unrepresentative of the target language, it may not help with prediction. With these caveats in mind, although it is unlikely that word frequency alone can serve as a completely adequate predictor, the results presented here suggest that the probability that a word will be encountered in a learner's environment can be most effectively modeled using multiple data sources.
Appendix A. 200 Dutch lemmas with highest prediction of textbook appearance

Appendix B. 200 Dutch word forms with highest prediction of appearance in learner production