
I. INTRODUCTION
Zinc oxide (ZnO) is a material characterized by a wide direct band gap (3.37 eV), a large exciton binding energy (60 meV), a large piezoelectric response, high thermal and mechanical stability, radiation hardness, and biocompatibility. Reference Radzimska and Jesionowski1–Reference Robertson, Falabretti and Ginley3 ZnO can be synthesized in the form of thin films or nanostructures Reference Mende and Driscoll4,Reference Wang5 and its constituent elements are abundant, nontoxic, and inexpensive. Reference Liu, Avrutin, Izyumskaya, Ozgur and Morkoc6,Reference Minami7 ZnO thin films have been extensively investigated for use in optoelectronic applications, such as light-emitting devices, Reference Zeng, Duan, Li, Yang, Xu and Cai8 photovoltaics, Reference Chen, Tang, Liu, Leung, Yuan, Chen, Wang, Bello, Zapien, Zhang, Lee and Lee9 and photocatalysis. Reference Mclaren, Valdes-Solis, Li and Tsang10
Nominally undoped ZnO thin films are n-type semiconductors with a background charge carrier concentration of the order of 1016 cm−3. Reference Robertson, Falabretti and Ginley3 Their electrical conduction characteristics are primarily determined by the electrons generated by intrinsic native defects, namely zinc interstitials due to excess zinc, oxygen vacancies, or hydrogen impurities. Reference Pearton, Norton, Ip, Heo and Steiner2,Reference Klingshirn11–Reference Fang, Li and Yao13 These deviations from stoichiometry generate a shallow donor level immediately below the conduction band Reference Nunes, Fortunato and Martins14 and provide the free charge carriers. However, the provision of charge carriers by defects compromises the crystalline and stoichiometric quality of ZnO thin films. Moreover, these defects cannot be controlled, making the electrical properties of undoped ZnO thin films unstable because of the chemisorption of oxygen at the top surface of the films and at grain boundaries. Reference Klingshirn, Meyer, Waag, Hoffmann and Geurts15 Thus, impurity doping is essential to overcome these drawbacks. In particular, doping with the trivalent elements of aluminum and gallium has been successfully implemented to synthesize highly conductive and stable ZnO thin films. Reference Kohiki, Nishitani and Wada16 This behavior stems from two factors. First, the electronegativity difference between zinc (1.65) and aluminum (1.61) or gallium (1.81) is small. Reference Haynes17 Second, the ionic radii of aluminum (53 pm) and gallium (62 pm) are smaller than that of zinc (74 pm). Reference Haynes17
Iron is a magnetic transition metal that has several oxidation states, an electronegativity of 1.83 and ionic radii that range from 61 to 78 pm (depending on the magnetic and oxidation states). Reference Chen, Tang, Liu, Leung, Yuan, Chen, Wang, Bello, Zapien, Zhang, Lee and Lee9 Because the properties of iron are similar to those of aluminum or gallium, it is considered a potentially attractive alternative for the doping of ZnO thin films. However, the performance of iron as a dopant is complicated by the existence of 3d electrons in its electronic configuration. Currently, most studies on Fe-doped ZnO thin films focus on their application as diluted magnetic semiconductors. Reference Jin, Fukumura, Kawasaki, Ando, Saito, Sekiguchi, Yoo, Murakami, Matsumoto, Hasegawa and Koinuma18 Fewer reports have investigated Fe-doped ZnO thin films as transparent conducting oxides. Reference Shinagawa, Izaki, Inui, Murase and Awakura19–Reference Chikoidze, Boshta, Sayed and Dumont21 Due to the complex electronic structure of iron, it has been difficult to control the resistivity of these films, which has been reported to range from 10−2 Ω cm (Refs. Reference Wang, Liao, Peng and Lai22 and Reference Kumar, Singh, Thakur, Chae, Choi, Angadi, Kaushik and Patnaik23) to 108 Ω cm. Reference Shinagawa, Izaki, Inui, Murase and Awakura19
Iron-doped ZnO thin films have been synthesized by several techniques, including spray pyrolysis, Reference Chikoidze, Boshta, Sayed and Dumont21,Reference Prajapati, Kushwaha and Sahay24–Reference Soumahoro, Moubah, Schmerber, Colis, Ait Aouaj, Abd-lefdil, Hassanain, Berrada and Dinia26 ion implantation, Reference Kumar, Singh, Thakur, Chae, Choi, Angadi, Kaushik and Patnaik23,Reference Xue, Zhang, Zhang, Shen, Zhu, Zhang, Wang and Liu27 spin coating, Reference Rambu, Nica and Dobromir28 electrodeposition, Reference Shinagawa, Izaki, Inui, Murase and Awakura19,Reference Shinagawa, Izaki, Murase, Uruga, Nakamura, Matsumura and Awakura20 and the sol–gel method. Reference Zhang, Wu, Li, Xu, Han, Wang, Tuo and Xie29–Reference Santosh, Babu and Deepa32 Sputtering is the most widely used technique for the preparation of Fe-doped ZnO thin films Reference Wang, Liao, Peng and Lai22,Reference Zhang, Cao, Xu, Bando and Wang33–Reference Hassan, Khan, Naqvi, Mishra and Islam51 because it provides the ability to control the properties of the films through several deposition parameters, such as the sputtering mode, power, sputtering and reactive gas pressures, substrate temperature, and target composition. Three sputtering techniques have been used to synthesize Fe-doped ZnO thin films: (i) simultaneous co-sputtering from two targets (ZnO and Fe) Reference Wang, Liao, Peng and Lai22,Reference Zhao, Hou, Wei, Zhou, Pan, Zhen and Tang42,Reference Wang, Mi and Kuang43 ; (ii) direct-current (DC) sputtering using an Fe-doped Zn target Reference Hong, Wen, Liu, Chen and Liao47 or a Zn target with Fe pieces attached to it, Reference Wang, Song, Li, Geng, Zeng and Pan35,Reference Wei, Song, Geng, Zeng, He and Pan37,Reference Luo, Yang, Zhu, Chen, Zeng and Pan46 and (iii) radio-frequency (RF) magnetron sputtering. In particular, previous studies have reported the RF sputtering of a Zn target with Fe foils, Reference Zhang, Ma, Li, Yang, Liu and Zhao50 a ZnO target with Fe pieces attached to it, Reference Chen, Wu, Sha, Zhuge and Meng36,Reference Chen, Zhuge, Wu and Meng38,Reference Cui, Wu, Zhuge and Meng40,Reference Wang, Chen, He, Li and Zhang41,Reference Jin, Gao, Wu, Cui, Zhuge, Chen and Hong44 and ZnO targets doped with Fe. Reference Hassan, Khan, Naqvi, Mishra and Islam51 The majority of the studies on RF-sputtered Fe-doped ZnO thin films have investigated the influence of the dopant concentration on the properties of the films. Reference Wang, Liao, Peng and Lai22,Reference Kim and Park34,Reference Chen, Wu, Sha, Zhuge and Meng36–Reference Chen, Zhuge, Wu and Meng38,Reference Wang, Chen, He, Li and Zhang41–Reference Luo, Yang, Zhu, Chen, Zeng and Pan46,Reference Gao, Liu, Zheng, Li, Bai and Xie49 Others have also assessed the influence of the deposition parameters on the properties of films with fixed dopant concentrations. Reference Zhang, Cao, Xu, Bando and Wang33,Reference Wang, Song, Li, Geng, Zeng and Pan35,Reference Cui, Wu, Zhuge and Meng40,Reference Zhang, Ma, Li, Yang, Liu and Zhao50,Reference Hassan, Khan, Naqvi, Mishra and Islam51
The aim of this study was to examine the suitability of iron-doped ZnO thin films for optoelectronic applications. This was motivated by several factors. First, iron is abundant, nontoxic, and inexpensive. Second, it has the same potential properties as those of group III elements. Third, relatively little research has been devoted to study the optoelectronic properties of iron-doped ZnO thin films. Our films were deposited using two techniques. In the first technique, we used ZnO targets doped with specific concentrations of iron, and deposited the films using RF magnetron sputtering. In the second technique, we used co-sputtering, where a ZnO target was RF-sputtered while an iron target was simultaneously DC-sputtered. In the latter technique, the concentration of iron was controlled through variation of the DC sputtering power. The experimental conditions leading to highly transparent and conducting films were identified. Subsequently, annealing in a reducing atmosphere (i.e., hydrogen and vacuum) was investigated as a means for enhancing the electrical conductivity of the films.
II. EXPERIMENTAL DETAILS
The thin film deposition was performed in an Oerlikon Univex 350 sputtering system (Oerlikon Corporation, Remscheid, Germany), using targets of 99.99% purity. ZnO targets with dopant (elemental Fe) levels of 0.5, 1.0, 1.5, 2.0, 2.5, and 3.0 wt% were fabricated using a vacuum hot pressing method. The films were deposited using RF sputtering, with the sputtering power fixed at 120 W. For the co-sputtered samples, a pure ZnO target was RF-sputtered using a fixed RF power of 120 W, and a pure iron target (99.99% purity) was DC-sputtered using powers of 16–32 W in steps of 4 W. The system was first evacuated to a base pressure of 5 × 10⁻⁶ mbar, then the sputtering gas (Ar, 99.99% purity) was admitted into the system at a flow rate of 8 sccm. Deposition was carried out for two hours, and the films were simultaneously deposited on two types of substrates that were heated to 400 °C: single-crystal c-plane sapphire and tantalum.
The structural properties of the films were investigated by x-ray diffraction (XRD) using a Rigaku Ultima IV diffractometer (Rigaku Corporation, Tokyo, Japan) with Cu Kα radiation. Data were acquired at 1-s time intervals with a 2θ step of 0.02°, where 2θ is the diffraction angle. The surface morphology of the films was examined using contact-mode atomic force microscopy (AFM) (Veeco Innova diSPM, Plainview, New York). The surface of the sample was probed with a 10-nm radius silicon tip that oscillated at its resonant frequency of 300 kHz. The concentration of iron in the films was measured using x-ray fluorescence (XRF; Spectro Xepos EDX XRF2, Kleve, Germany). The chemical state of the constituents of the films was studied using x-ray photoelectron spectroscopy (XPS) performed in a Thermo Scientific Escalab 250Xi spectrometer (Thermo Fisher Scientific, Waltham, Massachusetts) equipped with a monochromatic Al Kα x-ray source. The instrumental energy resolution was 0.5 eV and the samples were maintained at ambient temperature and at a pressure of 5 × 10⁻¹⁰ mbar. All spectra were referenced to the adventitious C 1s peak at 284.5 eV. To minimize the electrostatic charging of nonconducting substrates, only the films deposited on tantalum substrates were examined. The optical properties of the films were determined by measuring the normal-incidence transmittance of the films over the wavelength range 300–800 nm using a Jasco V-570 spectrophotometer (JASCO Corporation, Tokyo, Japan). The resistivity (ρ) of the films was determined by measuring the current passing through the sample at a fixed bias voltage. For these measurements, two gold electrodes (of thickness 100 nm) were deposited on the surface of the films. The current–voltage characteristics were measured using a Keithley 238 source measure unit (Keithley Instruments, Cleveland, Ohio). The electrical properties (Hall mobility and carrier concentration) of conductive films (ρ < 10 Ω cm) were measured using a van der Pauw Hall effect measurement system (Ecopia HMS 3000, Anyang, South Korea).
III. RESULTS AND ANALYSIS
A. Structural properties
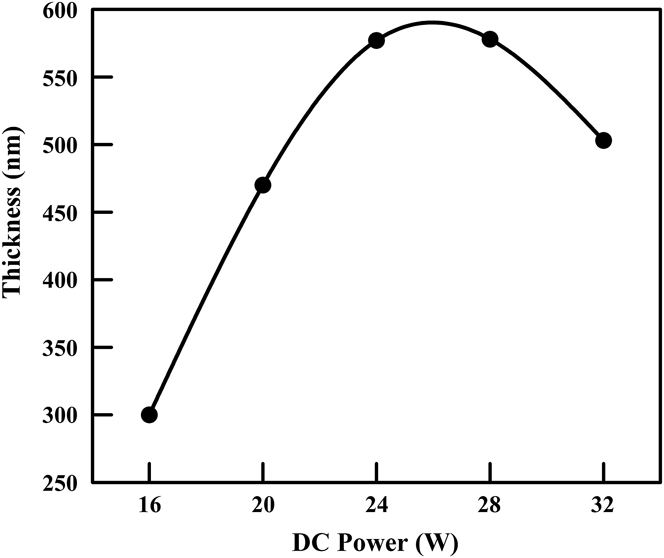
The thickness of the films was determined optically from the maxima and minima in the transmittance spectra [Fig. 6]. The thickness of the films deposited from the doped targets was found to be 320 ± 10 nm. However, the thickness of the co-sputtered films showed substantial variation as a function of the DC sputtering power [Fig. 1], where the thickness increased with the DC power. This is expected since two targets were simultaneously sputtered, and hence, more sputtered species were deposited on the substrates. For the highest DC power (32 W), the thickness showed a significant drop. It is anticipated that, at such a high DC power, the iron ions start to sputter the growing film, thus reducing its thickness.
Variation of film thickness as a function of DC sputtering power for the co-sputtered films.

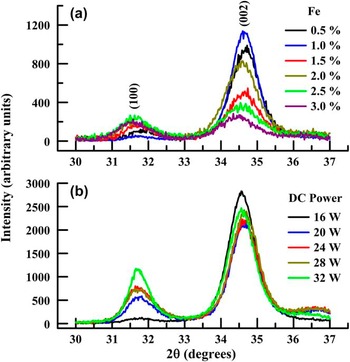
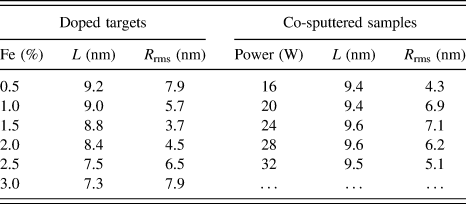
The XRD spectra of the films are shown in Fig. 2. The growth was strongly oriented along the (002) direction with the c-axis perpendicular to the substrate plane. This preferential growth along the (002) direction is due to two factors. First, the (002) direction exhibits a closely packed configuration in the hexagonal structure and is therefore energetically favorable. Reference Zhang, Cao, Xu, Bando and Wang33 Second, the surface energy density of the (002) orientation is the lowest in the ZnO hexagonal structure. Reference Hong, Wen, Liu, Chen and Liao47 There was a deviation in the diffraction angle (2θ) of the (002) peak of the films from that of the bulk value (34.42°) by 0.18°–0.32°. This deviation indicated the presence of stress in the films caused by thermal energy (heating), lattice mismatch between the film and substrate, and the growth process itself. Reference Singh, Srinivasa and Major52 The diffraction angle of the films was higher than the bulk value. Thus, the films suffered a tensile stress. Reference Zhu, Sun, Zhao, Su, Li, Wu, Wu, Wu and Liu53 The XRD patterns contained no peaks related to Fe clusters, such as metallic iron, FeO or Fe2O3, indicating that the iron ions successfully substituted the zinc ions or that they resided in interstitial sites. The higher intensity of the XRD patterns of the co-sputtered films may be attributed to their larger thickness. The influence of iron doping on the crystallinity of the films was investigated by evaluating the average crystallite size (L) using the Scherrer formula L = 0.89λα/(Γ cos θ), where λα is the wavelength of the Cu Kα radiation (1.54 Å), and Γ is the full width at half maximum of the (002) peak. The calculated crystallite sizes are given in Table I, which shows that the co-sputtered films had a crystallite size of 9.4 ± 0.2 nm that did not vary with the DC sputtering power. However, the films deposited from the doped targets exhibited a gradual reduction of crystallite size as the iron concentration increased up to 2.0%, after which there was a steep reduction in crystallite size. Previous studies have reported contrasting results regarding the influence of iron doping on the crystalline quality of ZnO thin films. In particular, four different trends have been observed: (i) a continuous deterioration of crystallinity as the iron dopant concentration increased Reference Prajapati, Kushwaha and Sahay24,Reference Lin, Young, Kung, Jhang, Lin, Kao, Chen, Ou, Cheng and Lin31,Reference Wang, Song, Li, Geng, Zeng and Pan35,Reference Chen, Wu, Sha, Zhuge and Meng36,Reference Chen, Zhuge, Wu and Meng38,Reference Wang, Chen, He, Li and Zhang41,Reference Luo, Yang, Zhu, Chen, Zeng and Pan46,Reference Hassan, Khan, Naqvi, Mishra and Islam51 ; (ii) an improvement of the crystalline quality with increasing dopant concentration Reference Hong, Wen, Liu, Chen and Liao47 ; (iii) no effect of iron doping on the crystalline quality of the films Reference Shinagawa, Izaki, Inui, Murase and Awakura19,Reference Santosh, Babu and Deepa32,Reference Gorzkowska-Sobas, Galeckas, Sunding, Diplas and Kuznetsov45 ; and (iv) an initial improvement in the crystalline quality of Fe-doped ZnO thin films up to an optimum dopant concentration, followed by a deterioration with further increases of the doping level. Reference Paraguay, Morales, Estrada, Andrade and Miki-Yoshida25,Reference Xu and Li30
Observed XRD patterns of the films. (a) Films deposited from the doped targets. The legend indicates the dopant concentrations in the targets; and (b) Films deposited using co-sputtering. The legend indicates the DC sputtering power applied to the iron target.

Structural properties of the films.

AFM was used to characterize the morphology and growth mode of the films and to estimate their surface root-mean-square roughness (R rms). Typical three-dimensional AFM images are shown in Fig. 3. The figure reveals that the films were composed of dense and uniform grains with a columnar microstructure that is typical of ZnO films grown by sputtering. Reference Zhang, Cao, Xu, Bando and Wang33 The R rms values are given in Table I, ranging from 3 to 8 nm. The two types of films showed completely opposite trends as the iron concentration increased.
Representative three-dimensional AFM micrographs of the films. (a) Films deposited from the ZnO target doped with 1.5% Fe; and (b) Co-sputtered films deposited under a DC power of 32 W applied to the iron target.

B. Chemical properties
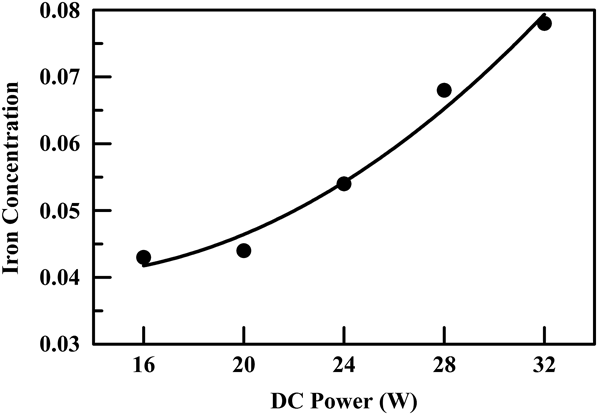
The concentration of iron in the films was estimated using XRF and was found to be 0.45, 1.0, 1.6, 2.0, 2.4, and 2.8% for the films prepared from the ZnO targets doped with Fe concentrations of 0.5, 1.0, 1.5, 2.0, 2.5, and 3.0%, respectively. Thus, the concentration of iron in the films was very close to its value in the starting targets. For consistency and ease of reference, we will continue to refer to the iron concentration in the target. The concentration of iron in the co-sputtered films is shown in Fig. 4. There was a steady increase in the iron concentration in the co-sputtered films as the DC power was increased. The iron concentration increased from 4.3 to 7.8% as the DC power increased from 16 to 32 W.
Variation of the iron concentration in the co-sputtered films as a function of the DC power applied to the iron target as measured by XRF. The vertical scale is the atomic ratio of iron relative to the total elements in the films.

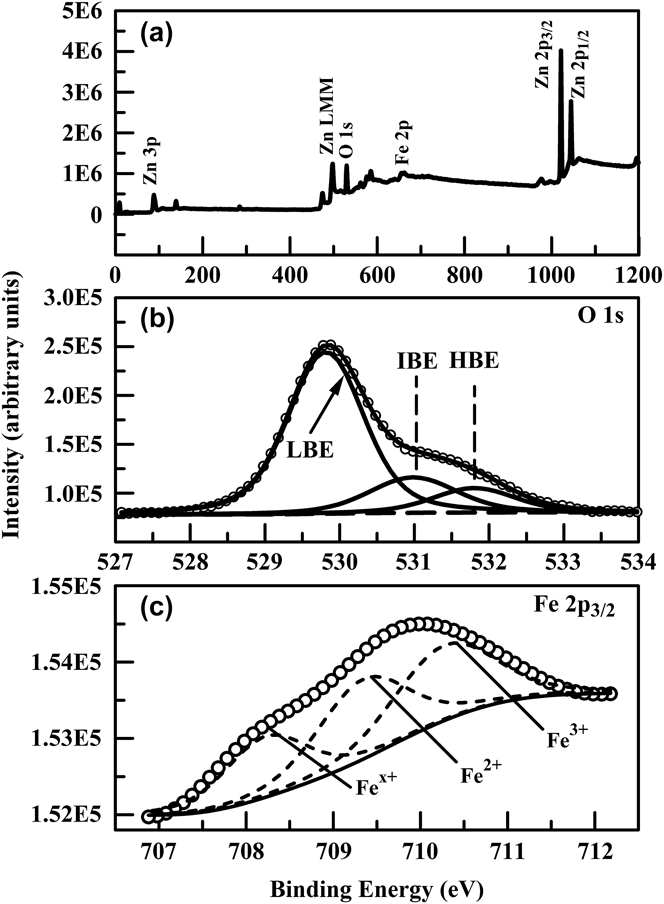
The chemical properties of the films were investigated using XPS. This technique can provide valuable information about the oxidation state of the elements present in these layers, which is especially important for iron because it can exist in several oxidation states. A typical XPS survey spectrum, along with O 1s and Fe 2p core-level spectra of the examined films, is shown in Fig. 5.
XPS spectra of the film prepared from a ZnO target doped with 1.5% Fe. (a) Survey spectrum; (b) O 1s core-level spectrum, resolved into its LBE, IBE, and HBE components. The experimental spectrum is denoted by the open circles; and (c) Fe 2p 3/2 core-level spectrum, indicating the different oxidation states of iron.

The Zn 2p level consists of two sublevels (2p 3/2 and 2p 1/2) because of spin–orbit splitting. To determine the binding energies of the Zn 2p 3/2 and 2p 1/2 levels, the Zn 2p spectrum was deconvoluted using a nonlinear least squares algorithm with a Shirley background and a mixed Gaussian–Lorentzian line shape. The measured binding energies of the Zn 2p 3/2 and 2p 1/2 components were 1021.2 ± 0.4 eV and 1044.2 ± 0.4 eV, respectively. These values are very similar to those reported in the literature (1021.0–1022.3 eV for 2p 3/2 and 1044–1045 eV for 2p 1/2), Reference Prajapati, Kushwaha and Sahay24,Reference Gorzkowska-Sobas, Galeckas, Sunding, Diplas and Kuznetsov45 which indicates that all Zn was in the single Zn2+ state. Reference Zhao, Hou, Wei, Zhou, Pan, Zhen and Tang42
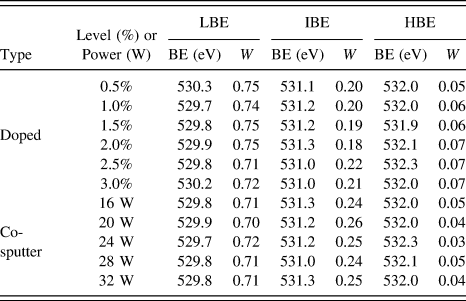
The O 1s XPS spectrum of ZnO thin films is usually asymmetric and has a complex structure, which indicates the presence of several different oxygen species. Reference Jing, Xu, Shang, Sun, Cai and Guo54 ZnO thin films are chemically active, and additional oxygen species (other than those incorporated in the ZnO lattice) are easily adsorbed on their surfaces and at their grain boundaries. Reference Choi, Kim, Kim, Lee, Lee, Cheong, Baik and Kim55 Typically, three components can be identified in the O 1s spectrum of ZnO thin films. The first is a low-binding-energy (LBE) component (529.6–530.8 eV), Reference Prajapati, Kushwaha and Sahay24,Reference Chen, Wang, Yu, Pei, Bai, Sun, Huang and Wen56 which is attributed to O2− ions in the hexagonal wurtzite structure; that is, oxygen ions involved in the Zn–O or Fe–O bonds within the crystal lattice. Reference Chen, Wang, Yu, Pei, Bai, Sun, Huang and Wen56 The second component is observed at intermediate binding energies (IBEs: 530.8–531.9 eV) Reference Prajapati, Kushwaha and Sahay24,Reference Chen, Wang, Yu, Pei, Bai, Sun, Huang and Wen56 and is associated with O2− ions in oxygen-deficient regions within the ZnO matrix. Reference Jing, Xu, Shang, Sun, Cai and Guo54 The third, high-binding-energy (HBE: 532–533 eV) Reference Gorzkowska-Sobas, Galeckas, Sunding, Diplas and Kuznetsov45,Reference Hong, Wen, Liu, Chen and Liao47 component of the O 1s spectrum is attributed to loosely bound surface oxygen species unrelated to lattice oxygen, such as atoms originating from adsorbed water as well as adsorbed oxygen and carbonates. Reference Chen, Wang, Yu, Pei, Bai, Sun, Huang and Wen56 The highly porous columnar structure of sputtered ZnO thin films Reference Hu and Gordon57 may allow these adsorbed species to segregate into the films. The deconvolution of the measured O 1s spectrum into the LBE, IBE, and HBE components is shown in Fig. 5(b), and Table II summarizes the binding energies and statistical weights (W) of each component. The latter were calculated by dividing the area of the corresponding component by the total area of the O 1s spectrum. The results in Table II indicate that 18–26% of the oxygen in the films corresponds to oxygen-deficient regions.
Binding energy components extracted from the O 1s XPS spectra of the films. “Doped” refers to the films deposited form doped targets, while “co-sputter” refers to the films deposited using co-sputtering.

Similar to Zn, the spin–orbit interaction splits the Fe 2p level into two sublevels (2p 3/2 and 2p 1/2). The 2p 3/2 binding energy depends on the oxidation state of iron and has been reported as 706.5–706.8 eV for metallic iron (Fe0), Reference Chen, Wu, Sha, Zhuge and Meng36,Reference Chen, Peng, Song, Zeng and Pan48 709.3 eV for Fe2+, Reference Chen, Wu, Sha, Zhuge and Meng36,Reference Luo, Yang, Zhu, Chen, Zeng and Pan46,Reference Chen, Peng, Song, Zeng and Pan48 and 710.5–710.8 eV for Fe3+. Reference Wang, Liao, Peng and Lai22,Reference Chen, Peng, Song, Zeng and Pan48 A representative XPS spectrum in the Fe 2p core-level region is shown in Fig. 5(c). The figure clearly indicates the coexistence of three oxidation states. The first component (Fe x+), at a binding energy of 708.2 eV, corresponds to a lower oxidation state of iron. The second and third components, at 709.3 and 710.3 eV, correspond to the Fe2+ and Fe3+ oxidation states, respectively. Thus, the iron in the films exists in an oxidized state. The presence of several oxidation states may be due to the interaction of iron ions with the Ar plasma, Reference Gorzkowska-Sobas, Galeckas, Sunding, Diplas and Kuznetsov45 or interaction with the oxygen evolving from the ZnO target. Moreover, residual oxygen in the sputtering gas and exposure to the atmosphere are possible sources of oxidation.
C. Optical properties
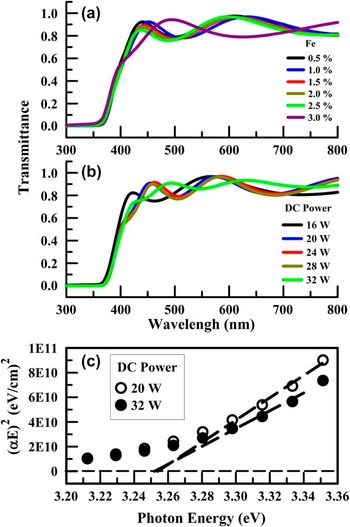
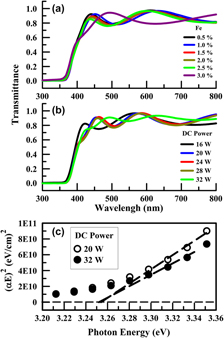
The normal-incidence transmittance spectra of the films are shown in Fig. 6. The deposited films were highly transparent in the visible range. The maxima and minima of the spectra are characteristic of transparent dielectric films and indicate the presence of sharp interfaces between the films and the substrates. In the fundamental absorption region, the absorption coefficient (α) of a film was calculated using the approximate relation α = (1/d) × ln(1/T), where T is the transmittance and d is the thickness of the film. Above the fundamental absorption edge, the dependence of the absorption coefficient of a direct-band-gap semiconductor on the incident photon energy (E) is given by αE = αo(E − E g)1/2, where αo is a constant and E g is the band gap of the material. Typical plots of (αE)2 as a function of photon energy are shown in Fig. 6(c). The band gaps were obtained as the horizontal axis intercept of linear fits to the straight portion of the (αE)2 versus E plots. The band gap of all films was found to be 3.25 ± 0.01 eV; this value was not affected by the dopant concentration nor the DC sputtering power.
Normal-incidence transmittance spectra of (a) films deposited from the doped targets and (b) co-sputtered films. (c) Representative band gap calculation of the co-sputtered films.

D. Electrical properties
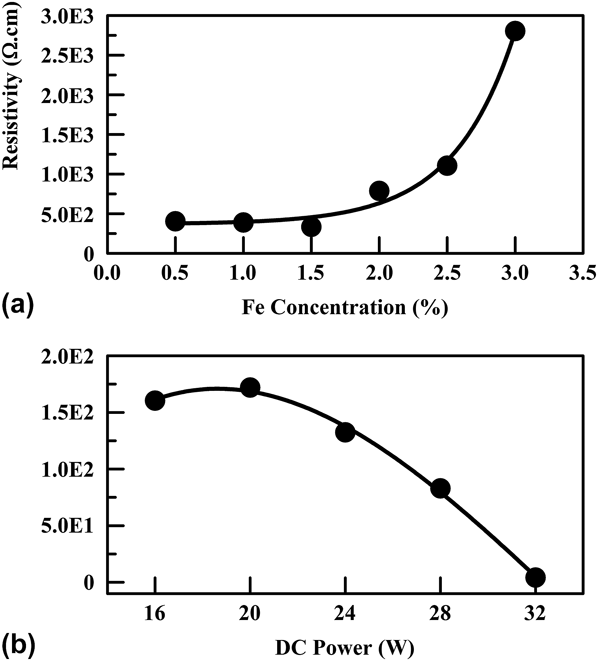
As shown in Fig. 7, the electrical resistivity of the films deposited using the doped targets did not show a significant variation up to a dopant concentration of 1.5%, but increased sharply for higher concentrations. The lowest resistivity of these films (3.4 × 10² Ω cm) was measured for the films doped with 1.5% Fe. On the other hand, the resistivity of the co-sputtered films showed an initial increase for a DC power of 20 W. This was followed by a continuous reduction in resistivity as the DC power increased beyond 20 W, reaching the lowest value of 4.3 Ω cm in the films deposited under a DC power of 32 W, i.e., two orders of magnitude lower than the lowest resistivity obtained in the films prepared from the doped targets. These results manifest the crucial role played by the method of incorporation of the dopant.
Electrical resistivity of the films: (a) Variation with the iron concentration for the films deposited from doped targets. (b) Variation as a function of the DC sputtering power for the co-sputtered films.

In the existing literature, the electrical resistivity of undoped ZnO thin films prepared by RF sputtering has been reported to be in the range of 104–108 Ω cm, depending on the substrate temperature. Reference Chaabouni, Abaab and Rezig58 Our results are similar to those previously reported on iron-doped ZnO thin films. A previous study on co-sputtered Fe-doped ZnO thin films reported a decrease of resistivity by four orders of magnitude compared to the undoped films (from 8.1 × 10² to 1.6 × 10⁻² Ω cm). Reference Wang, Liao, Peng and Lai22 However, the majority of related studies indicated an increase of resistivity upon iron doping, Reference Shinagawa, Izaki, Inui, Murase and Awakura19,Reference Chikoidze, Boshta, Sayed and Dumont21,Reference Rambu, Nica and Dobromir28,Reference Lin, Young, Kung, Jhang, Lin, Kao, Chen, Ou, Cheng and Lin31,Reference Wang, Song, Li, Geng, Zeng and Pan35 typically by one or two orders of magnitude (from 35 to 6.6 × 10³ Ω cm, Reference Chikoidze, Boshta, Sayed and Dumont21 8.5 × 10⁴ to 4.6 × 10⁶ Ω cm, Reference Rambu, Nica and Dobromir28 and 7 × 10⁷ to 5 × 10⁸ Ω cm Reference Lin, Young, Kung, Jhang, Lin, Kao, Chen, Ou, Cheng and Lin31 ). The increase in resistivity was attributed to the microstructural disorder introduced by higher dopant concentrations, which could lead to higher resistivity because of the increased grain boundary scattering and reduction of mobility. Reference Chikoidze, Boshta, Sayed and Dumont21,Reference Wang, Liao, Peng and Lai22 Because the lowest resistivity observed in our films was considerably higher than that required for optoelectronic applications (∼10−4 Ω cm), a post-deposition treatment was investigated as a means to improve the electrical characteristics of the films.
E. Post-deposition annealing
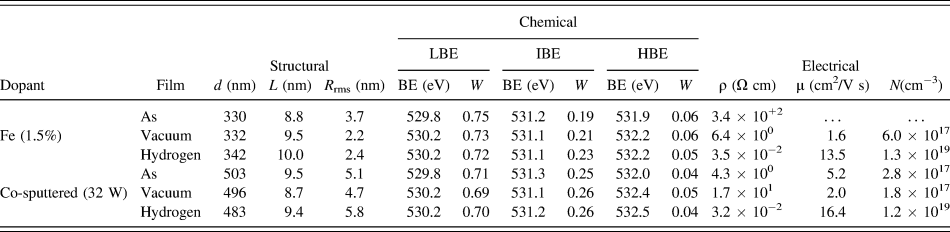
The electrical resistivity [ρ = (eNμ)−1] of thin films can be improved by increasing either the carrier concentration (N) or the Hall mobility (μ). Reference Zhu, Huang, Gong, Sun and Jinag59 To improve the electrical characteristics of the examined films, the samples with the lowest resistivity of each doping method were annealed in a vacuum and in a hydrogen atmosphere. Annealing in such reducing atmospheres is expected to enhance both the carrier concentration and mobility. Reference Chang, Lin and Hon60,Reference Lee, Yeo and Park61 In both cases, the films were annealed at 400 °C for two hours. Vacuum annealing was carried out in a tube furnace evacuated to 5 × 10⁻⁴ mbar. Similarly, for hydrogen annealing, the furnace was first evacuated to 5 × 10⁻⁴ mbar, and then hydrogen (99.99% purity) was admitted into the furnace at a flow rate of 50 sccm. The structural, chemical, and electrical properties of the annealed and as-deposited films are compared in Table III.
Structural, chemical, and electrical properties of the as-deposited films with the lowest resistivity further annealed in a vacuum or hydrogen atmosphere at 400 °C.

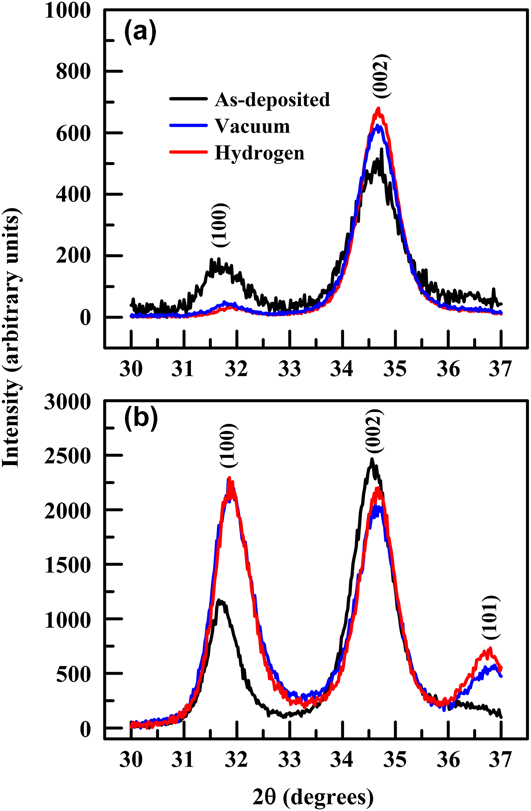
The annealed films, deposited using the doped targets, exhibited substantially improved structural properties and more oriented growth, as demonstrated by the sharper XRD spectra and the reduced intensity of the (100) peak shown in Fig. 8(a) and the larger crystallite sizes in Table III. Annealing provides thermal energy that results in the coalescence of small crystallites to form larger crystallites. Reference Gupta and Mansingh62 The enhancement of crystallinity was more pronounced in the hydrogen annealed films. The surface roughness was significantly reduced as a result of annealing, as confirmed by the R rms values listed in Table III. An increase in the weight of the IBE component of the O 1s XPS spectrum reflects a higher concentration of oxygen vacancies in the post-annealed samples. The increase in the weight of this component was 11 and 21% for the vacuum-annealed and hydrogen-annealed films, respectively.
Influence of annealing at 400 °C in a vacuum or hydrogen atmosphere on the XRD patterns of the samples. (a) Film deposited using a ZnO target doped with 1.5% Fe. (b) Film co-sputtered using a DC sputtering power of 32 W.
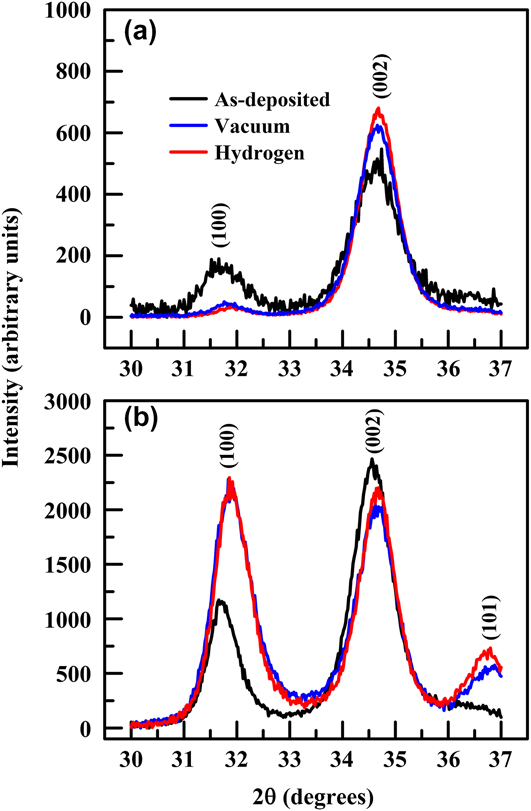
On the other hand, annealing resulted in the enhancement of poly-crystallinity in the co-sputtered films, as depicted by the greater intensity of the (100) peak in the XRD patterns of the annealed films shown in Fig. 8(b). This effect may be related to the larger iron concentration (7.8%) in the as-deposited co-sputtered films at 32 W. The thermal energy provided by annealing enhanced growth along the (100) direction, and may have displaced iron ions into interstitial sites. The vacuum-annealed films had a smaller crystallite size compared to the as-deposited films. This may indicate that in the vacuum-annealed film, the enhancement of the (100) peak was on the expense of oriented growth along the (002) direction. On the other hand, segregation of hydrogen into the films enhanced growth along the (100) direction without affecting growth along the (002) direction, as evidenced by the crystallite sizes of the hydrogen-annealed films in Table III. Vacuum annealing resulted in lower surface roughness, whereas hydrogen annealing resulted in the opposite trend. The change in the weight of the IBE component of the XPS O 1s spectrum was only 4% because the concentration of oxygen vacancies was already high in the as-deposited co-sputtered films.
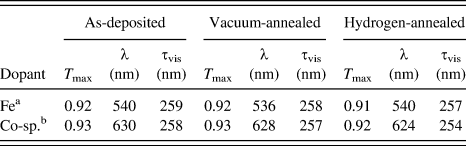
The transmittance of the films was slightly reduced due to annealing (by no more than 1.5% throughout the visible region). The optical characteristics of the films were evaluated by comparing the maximum transmittance (T max) and the integrated visible transmittance (τvis), which is defined as the area under the transmittance-wavelength (λ) spectrum in the visible range (λ = 400–700 nm). The maximum theoretical value for this quantity is 300 nm. The results displayed in Table IV indicate that, in most cases, annealing did not significantly affect T max and τvis and produced a maximum change of ≤1.5% compared to the as-deposited films. The band gap values were not affected by annealing.
Comparison of the optical characteristics of the as-deposited and annealed films.

a 1.5% Fe.
b 32 W DC power.
The electrical resistivity of the films, prepared from the ZnO target doped with 1.5% iron, was significantly reduced upon annealing. This is due to two factors. First, the crystallinity of the films was improved upon annealing, as depicted by the larger crystallite sizes. Improved crystallinity reduced the scattering of charge carriers at the grain boundaries, Reference Hao, Ma, Zhang, Yang, Ma, Yang, Cheng and Huang63 and thus the mobility increased. Second, the carrier concentration was increased, along with an increase in the IBE component of the XPS O 1s spectrum, which is related to the concentration of oxygen vacancies. Annealing resulted in the ionization of the oxygen vacancies formed by the annihilation of the oxygen acceptor states, which subsequently acted as donor states; thus increasing the carrier concentration. Reference Chang, Lin and Hon60,Reference Lee, Yeo and Park61 These two factors were more significant in the hydrogen-annealed films, resulting in decreased resistivity by four orders of magnitude, as compared to the as-deposited films. In addition, hydrogen forms a shallow donor level 35 meV below the conduction band, Reference Liu, Yao, Li, Li, Zheng, Zhang, Shan, Zhang, Zhang and Shen64,Reference Hofmann, Hofstaetter, Leiter, Zhou, Henecker, Meyer, Orlinskii, Schmidt and Baranov65 which acts as an additional source of charge carriers.
The electrical characteristics of the annealed co-sputtered films exhibited a more complicated behavior. Upon vacuum annealing, the crystallite size was reduced, causing the mobility to decrease. In addition, despite the slight increase in the weight of the IBE component of the XPS O 1s spectrum, there was a reduction in the carrier concentration. This indicates that the carrier concentration in the as-deposited co-sputtered films was largely provided by iron ions. Reduction in mobility and carrier concentration resulted in the increase of the resistivity of vacuum-annealed films. Annealing in hydrogen did not affect the crystallite size, and the increase of the IBE component of the XPS O 1s peak was the same as that obtained in the vacuum-annealed films. Yet, there was a significant increase in mobility and carrier concentration, resulting in a reduction of resistivity by two orders of magnitude compared to the as-deposited films. The increase in the carrier concentration supports the assumption of the formation of a shallow donor level. The enhancement of mobility cannot be explained on the basis of crystallinity because the crystallite size did not change upon annealing in hydrogen. We believe that hydrogen enhanced charge mobility along various crystalline directions. It is striking to note the similarity of the electrical properties of the hydrogen-annealed films for both types of doping methods, indicating that hydrogenation of the films overrides the dopant effect. It should be noted that annealing pure ZnO thin films in hydrogen can result in such low values of resistivity. Reference Al-Kuhaili, Alade and Durrani66
IV. CONCLUSIONS
Iron-doped ZnO thin films were deposited using RF magnetron sputtering of Fe-doped ZnO targets. In addition, iron doping was achieved using co-sputtering, where ZnO was RF-sputtered and iron was DC-sputtered. The films were polycrystalline, but also strongly oriented along the (002) direction of hexagonal ZnO, with crystallite sizes that ranged from 7 to 10 nm. No peaks related to iron or its oxides could be observed in the XRD spectra of the films. The surface morphology of the films exhibited columnar growth, with surface roughness values in the range 4–8 nm. Chemical analysis revealed a considerable density of oxygen vacancies that had a weight of 18–26% of the oxygen in the films. Moreover, iron existed in the films in an oxidized state. The films were highly transparent in the visible range, with a band gap of 3.25 eV that was not affected by iron doping. The electrical resistivity ranged from 3.2 × 100 Ω cm to 3.2 × 10³ Ω cm. To reduce the electrical resistivity, post-deposition annealing in a reducing atmosphere was sought. The doped films with the lowest resistivity were annealed in a vacuum and hydrogen. The structural, chemical, and electrical properties of the films were significantly affected by annealing. However, the optical properties were not affected. The electrical resistivity was reduced by 2–4 orders of magnitude upon annealing in hydrogen, which proved to be necessary to reduce the electrical resistivity. Thus, although iron has the potential to be used as a dopant in ZnO, it did not improve the properties of ZnO thin films sufficiently to warrant their use in optoelectronic applications.
ACKNOWLEDGMENTS
This project was funded by the National Plan for Science, Technology and Innovation (MAARIFAH)—King Abdulaziz City for Science and Technology—through the Science & Technology Unit at King Fahd University of Petroleum & Minerals (KFUPM)—the Kingdom of Saudi Arabia, award number 12-ADV3003-04.