

The importance of statistics courses in psychology programmes cannot be denied. According to Stoloff et al. (Reference Stoloff, McCarthy, Keller, Varfolomeeva, Lynch, Makara and Smiley2009), the statistics course is one of the two courses (the other being the introductory psychology course) that serve as the foundation for undergraduate psychology programs. Out of 374 universities surveyed in North America, 98% of them required students to complete at least one statistics course – with most of those requiring students to complete two – as a requirement for their psychology degree programme (Stoloff et al., Reference Stoloff, McCarthy, Keller, Varfolomeeva, Lynch, Makara and Smiley2009). Furthermore, these statistics courses largely determine entry into the Honors programme, which in turn, is essential for entry into postgraduate studies. Given the mandatory and high-stakes nature of statistics courses, it is not surprising that students regard statistics courses as the most anxiety-inducing course in their degree programmes. Statistics anxiety is defined as:
a negative state of emotional arousal experienced by individuals as a result of encountering statistics in any form and at any level; this emotional state is preceded by negative attitudes toward statistics and is related to but distinct from mathematics anxiety (Chew & Dillon, Reference Chew and Dillon2014, p. 199).
A consistent negative relationship has been found between statistics anxiety and statistics achievement in a wide variety of studies (Bell, Reference Bell2001; Hanna & Dempster, Reference Hanna and Dempster2009; Onwuegbuzie & Seaman, Reference Onwuegbuzie and Seaman1995; Onwuegbuzie, Reference Onwuegbuzie2003; Tremblay, Gardner, & Heipel, Reference Tremblay, Gardner and Heipel2000; however see Keeley, Zayac, & Correia, Reference Keeley, Zayac and Correia2008). In other words, students who experience higher levels of statistics anxiety tend to have lower performance on a statistics examination. Given these negative relationships, it is important for researchers and instructors to have a reliable and valid measure to identify students with statistics anxiety, and to evaluate the relative effectiveness of interventions designed to reduce statistics anxiety.
There were six measures purported to assess statistics anxiety. They were the Statistical Anxiety Rating Scale, commonly known as the STARS (Cruise, Cash, & Bolton, Reference Cruise, Cash and Bolton1985), the Statistics Anxiety Inventory (Zeidner, Reference Zeidner1991), the Statistics Anxiety Scale (Pretorius & Norman, Reference Pretorius and Norman1992), Zanakis and Valenzi's (Reference Zanakis and Valenzi1997) unnamed instrument, the Statistics Anxiety Measure (Earp, Reference Earp2007), and the Statistical Anxiety Scale (SAS; Vigil-Colet et al., Reference Vigil-Colet, Lorenzo-Seva and Condon2008). Due to the superiority of its reliability and validity data (e.g., Hanna, Shevlin, & Dempster, Reference Hanna, Shevlin and Dempster2008; Liu, Onwuegbuzie, & Meng, Reference Liu, Onwuegbuzie and Meng2011; Papousek et al., Reference Papousek, Ruggeri, Macher, Paechter, Heene, Weiss and Freudenthaler2012), the STARS is currently one of the most popular measures of statistics anxiety. Nevertheless, Vigil-Colet et al. (Reference Vigil-Colet, Lorenzo-Seva and Condon2008) argued that the STARS assesses both statistics anxiety and attitudes toward statistics rather than statistics anxiety per se and developed the SAS to address this limitation. This argument has since been supported by recent factor-analytic studies (Hanna et al., Reference Hanna, Shevlin and Dempster2008; Papousek et al., Reference Papousek, Ruggeri, Macher, Paechter, Heene, Weiss and Freudenthaler2012).
In developing the SAS, an initial 33 items were first generated by experienced statistics lecturers in the Social Sciences with more than ten years of university experience and by adapting items from the STARS. Nine items were removed in a pilot study due to poor psychometric properties. Subsequently, the 24-item instrument was completed by 159 psychology undergraduates in Spain and the data subjected to factor analysis using Minimum Rank Factor Analysis with Promin rotation. Results indicated that the rotation of 24 items on three factors, with 8 items on each factor, yielded the most interpretable structure. The three factors were: (a) Examination Anxiety, (b) Asking for Help Anxiety, and (c) Interpretation Anxiety.
Examination Anxiety deals with the anxiety involved when taking a statistics examination. Asking for Help Anxiety refers to the anxiety experienced when seeking help from others (e.g., from the lecturer or other students). Interpretation Anxiety refers to the feelings of anxiety encountered when interpreting statistical data. Responses are made on a 5-point Likert scale that ranges from 1 = No Anxiety to 5 = Considerable Anxiety. Appropriate item scores are summed for each factor and for the total scale, with higher scores indicating higher levels of statistics anxiety.
Vigil-Colet et al. (Reference Vigil-Colet, Lorenzo-Seva and Condon2008) reported internal consistency which ranges from 0.82 to 0.92 for the subscales and 0.91 for the total scale (n = 159). The factors were also negatively correlated with statistics academic performance and positively correlated with trait anxiety and neuroticism. More recently, Chiesi, Primi, and Carmona (Reference Chiesi, Primi and Carmona2011) confirmed the three-factor structure among 848 psychology students in Italy and Spain and reported internal consistencies that ranged from 0.83 to 0.92 and test-retest reliabilities that ranged from 0.57 to 0.76 (n = 232). Furthermore, the total scale was negatively correlated with basic mathematics abilities, statistics self-efficacy, and attitudes toward statistics.
The SAS offers two advantages over the STARS. First, with only 24 items, it is a shorter instrument than the 51-item STARS. This reduces participants’ fatigue and encourages research participation (Galesic & Bosnjak, Reference Galesic and Bosnjak2009). Second, with a specific measure of statistics anxiety, research can be conducted to separate statistics anxiety from attitudes toward statistics, a related but distinct construct. Currently, most researchers use the terms interchangeably, resulting in confusion and compromising statistical analysis due to multicollinearity (e.g., Nasser, Reference Nasser2004).
Among researchers who distinguished between statistics anxiety and attitudes toward statistics, the general consensus was that negative attitudes result in anxiety. Although no evidence has been found for the proposed direction of causality, a large number of studies have reported negative relationships between anxiety and attitudes (Chiesi et al., Reference Chiesi, Primi and Carmona2011; Chiesi & Primi, Reference Chiesi and Primi2010; Mji & Onwuegbuzie, Reference Mji and Onwuegbuzie2004; Watson, Kromrey, & Hess, Reference Watson, Kromrey and Hess2003; Watson, Lang, & Kromrey, Reference Watson, Lang and Kromrey2002; Zanakis & Valenzi, Reference Zanakis and Valenzi1997). However, in order to examine the evidence that attitudes is a related but distinct construct from anxiety, the amount of shared variance between the two constructs should be less than 50% (i.e., small to moderate correlations; Baloğlu, Reference Baloğlu2004).
Overall, the SAS appears to be a promising instrument that affords researchers a specific measure of statistics anxiety. Nevertheless, the measure seems to be in its infancy with only one validity study conducted in Italy and Spain (Chiesi et al., Reference Chiesi, Primi and Carmona2011). Since psychometric data are properties of scores instead of the instrument (Thompson & Vacha-Haase, Reference Thompson and Vacha-Haase2000), more research is needed in other countries with more diverse samples. Therefore, the purpose of the current study is to examine the reliability and validity of the SAS among a sample of Singaporean and Australian psychology undergraduates. Accordingly, the hypotheses for the current study were as follows:
H1: The SAS will have internal consistency coefficients above 0.70.
H2: A three-factor model will best describe the data.
H3: The SAS will share positive correlations with the STARS.
H4: The SAS will share small to moderate negative correlations with the Attitudes toward Statistics scale (Wise, Reference Wise1985).
Method
Participants
Participants were 197 undergraduates (79.2% female) in the James Cook University Psychology programs at the Singaporean (70.1%) and Australian (29.9 %) campuses. Their age ranged from 17 to 54 years (M = 23.80, SD = 7.24). Among these participants, 150 were currently enrolled in a statistics course (66.0% introductory statistics, 30.0% intermediate statistics, and 4.0% advanced statistics) whereas 47 have completed at least one of the aforementioned courses but were not currently enrolled in a statistics course.
Measures
Background Information Form
The background information form was developed by the authors for the purpose of the current study. The form was designed to assess basic demographic information such as age, gender and statistics course enrolled.
SAS
The basic structure and response format of the SAS (Vigil-Colet et al., Reference Vigil-Colet, Lorenzo-Seva and Condon2008) have been described earlier. Appropriate item scores are summed for each factor, with higher scores indicating higher levels of statistics anxiety.
STARS
The STARS is a 2-part, 51-item instrument designed to assess six factors of statistics anxiety (Cruise et al., Reference Cruise, Cash and Bolton1985). Recent research suggested that part one of the STARS (the first three factors) assesses statistics anxiety whereas part two of the STARS (the last three factors) assesses attitudes toward statistics (Papousek et al., Reference Papousek, Ruggeri, Macher, Paechter, Heene, Weiss and Freudenthaler2012). Hence, only part one of the STARS was used in the current study.
Part one consists of 23 items which assess statistics anxiety associated with situations where students have contact with statistics and it includes the following factors: (a) Test and Class Anxiety (e.g., doing the final examination in a statistics course), (b) Fear of Asking for Help (e.g., asking a fellow student for help in understanding a printout), and (c) Interpretation Anxiety (e.g., figuring out whether to reject or retain the null hypothesis). Because some items from the SAS are adapted from the STARS, the first two factors are renamed Examination Anxiety and Asking for Help Anxiety, respectively, to facilitate interpretation. Participants respond on a 5-point Likert scale that ranges from 1 = No Anxiety to 5 = Strong Anxiety. Appropriate item scores are summed for each factor, with higher scores indicating higher levels of statistics anxiety. Cruise et al. (Reference Cruise, Cash and Bolton1985) reported internal consistencies that ranged from 0.85 to 0.91 (n = 1150) and five-week test-retest reliabilities that ranged from 0.72 to 0.83 (n = 161) for the three factors.
Attitudes toward Statistics scale
The Attitudes toward Statistics scale is a 29-item instrument designed to assess two factors of attitudes toward statistics: (a) Attitudes toward Field (e.g., I feel that statistics will be useful to me in my profession) and (b) Attitudes toward Course (e.g., statistics seems very mysterious to me) (Wise, Reference Wise1985). Responses are made on a 5-point Likert scale that ranges from 1 = Strongly Disagree to 5 = Strongly Agree. Fourteen negatively worded items are reverse scored and the appropriate items scores are summed for each factor and for the total scale. Higher scores indicate higher levels of positive attitudes toward statistics. Wise (Reference Wise1985) reported internal consistency of 0.92 and 0.90, two week test-retest reliability of 0.82 and 0.91, for the Attitudes toward Field subscale and the Attitudes toward Course subscale, respectively (n = 92).
Procedure
Participants were invited to complete the Background Information Form, the SAS (Vigil-Colet et al., Reference Vigil-Colet, Lorenzo-Seva and Condon2008), the STARS (Cruise et al., Reference Cruise, Cash and Bolton1985), and the Attitudes toward Statistics scale (Wise, Reference Wise1985). Each instrument took about 10 minutes to complete. All instruments were administered online using SurveyGizmo (2013) and counterbalanced to control for order effects. Participants either received extra course credit or were entered into a lucky draw for a chance to win an iPod shuffle.
Results
All results were analysed using SPSS and AMOS version 16.0 with the alpha level set at 0.05. Although preliminary analyses found no gender or statistics experience (i.e., participants currently enrolled in a statistics course vs. participants who had completed at least one statistics course) differences for the three factors of statistics anxiety, participants from the Singaporean campus had higher scores on the Interpretation Anxiety factor than their counterparts from the Australian campus. However, the sample size was not large enough to permit separate investigations. Therefore, the results were collapsed across gender, statistics experience and campuses.
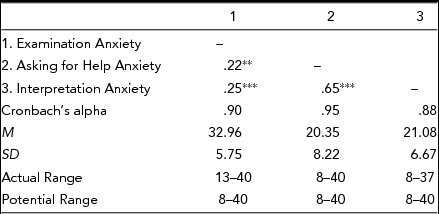
The intercorrelations, reliability coefficients, means and standard deviations of the SAS (Vigil-Colet et al., Reference Vigil-Colet, Lorenzo-Seva and Condon2008) are presented in Table 1. The internal consistency of the SAS ranged from 0.88 to 0.95. Because each factor has the same number of items, a comparison of the means showed that participants had highest anxiety associated with Examination Anxiety.
Intercorrelations, Reliability Coefficients (Cronbach's alpha), and Descriptives of the Statistical Anxiety Scale (SAS)

** p < .01, *** p < .001
Confirmatory factor analysis was used to confirm the structure of the SAS. Three models were specified and presented in Table 2: a one-factor model (Model 1), a three-factor model (Model 2) and a modified three-factor model (Model 2a). These models were evaluated using various fit indices to assess Model Fit, Model Comparison and Model Parsimony (Hair, Black, Babin, & Anderson, Reference Hair, Black, Babin and Anderson2009). Model 2 was compared to the simple, more parsimonious, Model 1 (Chiesi et al., Reference Chiesi, Primi and Carmona2011; Kline, Reference Kline2010). Results showed that Model 2 represented a better fit to the data than Model 1. However, an examination of modification indices (MI) suggested that Model 2 can be improved by allowing errors to correlate.
Model Fit, Model Comparison, and Model Parsimony Fit Indices for the three tested models of the Statistical Anxiety Scale (SAS)

Note. Model 1 = one-factor model; Model 2 = three-factor model; Model 2a = modified three-factor model; RMSEA = root mean square error of approximation; TLI = Tucker-Lewis index; CFI = comparative fit index; PGFI = parsimony goodness-of-fit index; AIC = Akaike's Information Criterion.
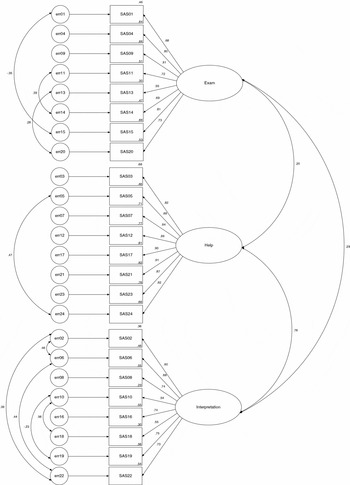
A total of nine error correlations were specified. For this process, the error with the highest MI was first allowed to correlate. If this correlation resulted in a significant improvement in model fit, the error with the second highest MI was allowed to correlate. The process continued until there was no significant improvement in model fit. As cautioned by Byrne (Reference Byrne2010), the modifications should be substantially meaningful. In this instance, all nine correlations were justified because they were between items that were hypothesised to load on the same factor (see Figure 1). For example, the errors for Item 11 (“Walking into the classroom to take a statistics test”) and Item 14 (“Waking up in the morning on the day of a statistics test”) were allowed to correlate. These two items were hypothesised to load on the Examination Anxiety factor and had similar meanings. Results showed that Model 2a represented a better fit to the data than Model 2Footnote 1.
Standardised estimates for the modified three-factor model with nine error correlations (Model 2a).

A series of Pearson product-moment correlation coefficient was conducted to explore bivariate relationships between the SAS, the STARS (Cruise et al., Reference Cruise, Cash and Bolton1985), and the Attitudes toward Statistics scale (Wise, Reference Wise1985). The results are presented in Table 3. In general, scores on the SAS shared positive correlations with scores on the STARS, and small to moderate negative correlations with scores on the Attitudes toward Statistics scale.
Pearson Product-Moment Correlations of the Statistical Anxiety Scale (SAS), the Statistical Anxiety Rating Scale (STARS), and the Attitudes toward Statistics scale

Note. Exam = Examination Anxiety; Help = Asking for Help Anxiety; Interpretation = Interpretation Anxiety.
** p < .01, *** p < .001
Discussion
The purpose of the current study was to examine the reliability and validity of the SAS (Vigil-Colet et al., Reference Vigil-Colet, Lorenzo-Seva and Condon2008) among a sample of Singaporean and Australian psychology undergraduates. The results provided support for H1. Consistent with previous studies (Chiesi et al., Reference Chiesi, Primi and Carmona2011), acceptable internal consistency reliabilities were found in the current study. For example, Vigil-Colet et al. (Reference Vigil-Colet, Lorenzo-Seva and Condon2008) reported internal consistency which ranges from 0.82 to 0.92 whereas the current study reported internal consistency which ranges from 0.88 to 0.95. These coefficients were also well above the recommended acceptable alpha level of 0.70 (Nunnally, Reference Nunnally1978). Partial support was found for H2. Although a three-factor model represented a better fit to the data than a one-factor model, the former model was significantly improved by specifying nine error correlations. Nevertheless, all items loaded on their hypothesised factor, with the same eight items on each factor as identified in the original study (i.e., Vigil-Colet et al., Reference Vigil-Colet, Lorenzo-Seva and Condon2008).
The results also provided support for H3 and H4. Significant positive correlations were found between the SAS (Vigil-Colet et al., Reference Vigil-Colet, Lorenzo-Seva and Condon2008) and the STARS (Cruise et al., Reference Cruise, Cash and Bolton1985). Since some items on the SAS were adapted from the STARS, it was not surprising to find large correlations between the same factors of the two measures. For example, the Interpretation Anxiety factor of both measures shared a correlation of 0.87. Hence, the SAS might be a suitable substitute of the STARS for researchers who wish to assess statistics anxiety only. Small to moderate negative correlations were found between the SAS and the Attitudes toward Statistics scale (Wise, Reference Wise1985). At the maximum, attitudes toward statistics explained less than 50% (r 2 = −0.462 = 21.16%) of the variance in statistics anxiety. This suggests statistics anxiety to be a related but distinct construct from attitudes toward statistics. Indeed, we recommend researchers use the SAS instead of the STARS to prevent multicollinearity with attitudinal measures (e.g., Nasser, Reference Nasser2004). In summary, the results of the study provided support for the use of the SAS among Singapore and Australia psychology undergraduates.
Limitations of the study should be noted. First, the sample was drawn from psychology undergraduates in Singapore and Australia. The results might not generalise to graduate students or undergraduates in other disciplines (e.g., Business). Second, the current sample size did not permit separate investigations across demographic variables such as country (Singapore vs. Australia). In particular, given that participants from the Singaporean campus had higher statistics anxiety associated with Interpretation Anxiety than their counterparts from the Australian campus, future research should examine the equivalence of the three-factor structure across country. Third, nine error correlations were specified in the current study. Because such modifications (e.g., error correlations) are data driven, the modifications might not generalise to samples in other studies or to the population (MacCallum, Roznowski, & Necowitz, Reference MacCallum, Roznowski and Necowitz1992). Finally, the current study only provided some evidence of construct validity by correlating the SAS with another measure of statistics anxiety and with a measure of attitudes toward statistics. Future research could include more variables, such as statistics self-efficacy and mathematics ability, into their study.