I. INTRODUCTION
Currently, human being is confronted with the problems of energy shortage and environment pollution. How to deal with these problems is an important issue for the scientist. Photocatalysis technology has promising application prospect in environmental remediation and green energy production. Reference Liang, Lin, Liu, Hu and Cui1–Reference Li, Wei, Yu, Fang, Xie, Zhou and Zhu9 Under light irradiation, photocatalysis can decompose most of the organic pollutants in water and air without selectivity, ideally producing CO2 and H2O as end products. Moreover, photocatalysts can effectively convert solar energy to chemical energy in the form of clean and renewable hydrogen fuel or solar fuels. Reference Yuan, Wen, Zhong, Li, Fang, Zhang and Liu10–Reference Li, Qian and Chen12
In recent years, tungstate-based photocatalytic materials have attracted intensive attention due to their wide light range absorption. Reference Yu, Bai, He, Fan, Zhu and Zhou13–Reference Zhu, Fan, Sun and Ai20 In numerous tungstates, Ag2WO4 possesses unique physical and chemical properties because of its special spatial structure and the characteristics of the spontaneous polarization. However, as photocatalyst, Ag2WO4 can only absorb UV light due to its large band gap (∼3.5 eV). Another problem for Ag2WO4 is its poor stability because under light illumination photocorrosion readily takes place over Ag-based semiconductors if no sacrificial reagent is present. Reference Roca, Sczancoski, Nogueira, Fabbro, Alves, Gracia, Santos, Sousa, Andrés, Luz, Long and Cavalcante21 Therefore, how to promote the photocatalytic stability and activity becomes an important issue for these Ag-based semiconductor photocatalysts.
Previous studies have shown that the electronic and energy band structures of Ag2WO4 can be regulated by changing its crystal structures. For example, Lin et al. Reference Lin, Li, Zheng, Yan, Liu, Wang and Yang22 found that upon unique laser irradiation, Ag2WO4 nanorods in liquid can realize the electronic reconstruction and these nanorods displayed obvious visible-light photocatalytic performance in organic pollutant degradation and H2 evolution. He et al. Reference He, Tong, Zhang, Chen and Song23 reported that a series of plasmonic photocatalysts, comprised of Ag supported on Ag2WO4 (Ag/Ag2WO4) with different crystalline phases, were fabricated by a facile ion-exchange method and subsequent reduction with hydrazine hydrate. Compared with pure Ag2WO4, the Ag/Ag2WO4 exhibited a markedly improved quantum yield and turnover number for CO2 reduction to CH4 under visible-light irradiation. Moreover, the plasmonic Ag/Ag2WO4 photocatalysts display high stability during the process of recycled reaction. It was proposed that the localized surface plasma resonance effect of surface-deposited Ag nanoparticles contributed to the enhanced activities and stabilities of the Ag/Ag2WO4 photocatalysts. In addition, recent investigations indicated that heterojunction, forming by two matched energy level of semiconductor, can improve the separation efficiency of photo-generated electrons and holes and the stability of Ag2WO4 catalyst.
It's vital to reduce recombination of electrons and holes and enhance charge transfer through fine controlled interfacial structure. Very recently, Li et al. Reference Li, Jin, Fang, Yang, Yang, Liu, Xing and Song2 reported that a general route for the fabrication of Ag2WO4/g-C3N4-NS with visible light photocatalytic activity for the degradation of RhB and MO. Also Dai et al. Reference Dai, Lv, Lu, Liang, Geng and Zhu14 successfully prepared a ternary visible light sensitive g-C3N4/Ag2WO4/Ag photocatalyst by deposition of Ag2WO4 onto g-C3N4 template and followed by sun light reduction of Ag2WO4 into Ag2WO4/Ag. Metallic Ag0 is used as plasmonic hot spots to generate high energy charge carriers and enhance photodegradation performance for MB. Liu et al. Reference Liu, Hu, Li, Hu, Shao, Yang, Tong and Qian24 prepared Ag2WO4/AgCl nanorods by simple hydrothermal method and the enhanced photocatalytic performances were observed over these Ag2WO4/AgCl composite photocatalysts. The research in our group showed that heterojunctions with intimate interface at nanoscale can effectively improved the activity and stability of Ag-based semiconductors. Reference Yu, Wei, Zhou, Chen, Fan and Liu25–Reference Yu, Wei, Chen, Xie, Zhou and Fan27
In current study, a series of Ag2S/Ag2WO4 composite microrods were synthesized via a facile successive precipitation route. The influences of Ag2S content on the texture and optical properties and photocatalytic performance of Ag2WO4 microrods in degradation of different azo dyes were investigated.
II. EXPERIMENTAL
All chemicals were analytical grade reagents from Shanghai Chemical Company and used without further purification. 10 mmol AgNO3 was dissolved in 20 mL of deionized (DI) water under stirring, to obtain solution A. 10 mmol of Na2S or Na2WO4 was dissolved in 40 mL of DI water, and the resulting solution was added dropwise to solution A. After stirring for 3 h, the resulting powder was collected by filtration, washed with DI water and ethanol for several times. Finally, Ag2S and Ag2WO4 products were obtained after drying at 70 °C for 4 h.
Ag2S/Ag2WO4 composites were fabricated by successive precipitation method. 10 mmol AgNO3 was dissolved in 20 mL of DI water under stirring, to obtain solution A. A mount of Na2S were dissolved in 20 mL of DI water, and the resulting solution was added dropwise to solution A. After stirring for 3 h, 20 mL Na2WO4 solution was added dropwise to Ag2S liquid suspension and was further stirred for 3 h, the resulting powder was collected by filtration, washed with DI water and ethanol for several times. Finally, Ag2S/Ag2WO4 with different Ag2S concentrations was obtained after drying at 70 °C for 4 h.
Powder X-ray diffraction (XRD) patterns were recorded at a scanning rate of 0.05 °C·s−1 using a Bruker D8 advance X-ray diffractometer (Bruker Corporation, Karlsruhe, Germany) at 40 kV and 40 mA with a Cu Kα radiation source (λ = 0.15418 nm). The Brunauer–Emmett–Teller (BET) specific surface area (SBET) was measured on an ASAP2020 nitrogen adsorption apparatus (Micromeritics, Norcross, Georgia). All the samples were degassed at 110 °C for 1 h before nitrogen adsorption measurement. The BET specific surface area was determined by a multipoint BET method using the adsorption data in the relative pressure (P/P 0) range of 0.05–0.3. Scanning electron microscopy (SEM) images were collected using a MLA650F scanning electron microscope (FEI Company, Hillsboro, Oregon), and were used to investigate sample morphologies. Ultraviolet–visible diffuse reflectance spectra (UV–Vis DRS) were recorded using a UV–Vis spectrophotometer (UV-2550, Shimadzu Corp., Kyoto, Japan). Photoluminescence (PL) emission spectra were obtained under excitation at 325 nm using a F-4600 spectrometer (Hitachi Corp., Tokyo, Japan). Surface compositions were determined by x-ray photoelectron spectroscopy (XPS), using a ESCALAB 250 XPS system (Thermo Scientific, Waltham, Massachusetts) with a monochromatic Al Kα source and a charge neutralizer. Photocurrent measurements were performed on CHI 660E electrochemical work station (Chenhua Instrument, Shanghai, China) in a conventional three electrode configuration with a Pt foil as the counter electrode and a Ag/AgCl (saturated KCl) as the reference electrode. A 500 W Xe lamp severed as a light source. 0.1 mol L−1 Na2SO4 aqueous solution was used as the electrolyte. The working electrodes were prepared as follows: 10 mg of the as-prepared photocatalyst and 0.5 mL nafion dispersing reagent were added in 5 mL absolute ethyl alcohol, sonicated for 30 min. The slurry was then spread on a 1.0 × 1.0 cm indium–tin oxide glass substrate and dried in air. The photoresponses of the samples as light on and off were measured at 0.0 V.
The photocatalytic activities of the as-prepared samples were determined by the degradation of azo dyes (methylene blue, MB and methyl orange, MO) in aqueous solution. The photocatalytic reaction was carried out in a photochemical reactor (XPA XuJiang Elextromechanical Plant, Nangjing, China). The light source was 400 W metal halide lamp. In each test, 30 mg of as-prepared samples were added into 60 mL of 20 mg L−1 MB or MO aqueous solution. Then, the suspension was stirred in the dark for 40 min to achieve the adsorption–desorption equilibrium prior to visible light irradiation. During the degradation process, the reaction temperature was maintained at 20 °C by the circulation of water. After fixed irradiation intervals, ∼2 mL aliquots of suspension were removed, and the solids removed by centrifugation. The MB and MO concentration of the clear upper layer was determined by UV–Vis spectrophotometry.
III. RESULTS AND DISCUSSION
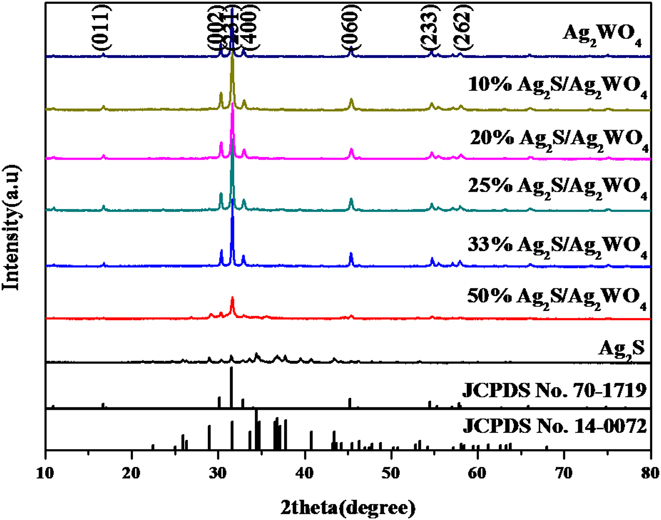
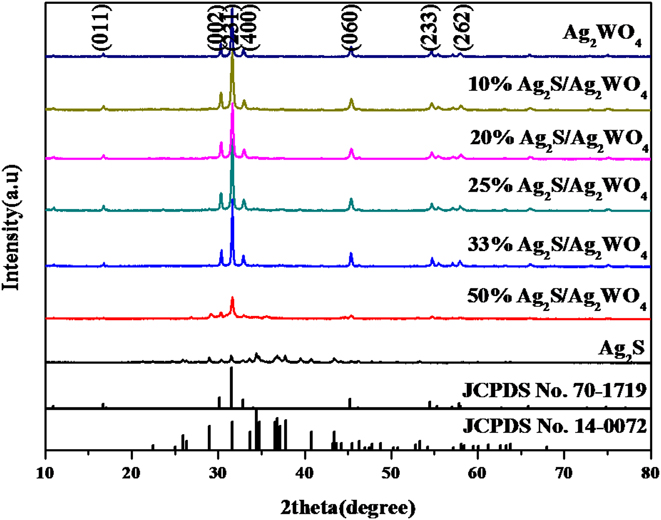
The phase composition and crystal properties of the samples were analyzed by XRD. Figure 1 shows the XRD patterns of the as-prepared Ag2S, Ag2WO4, and Ag2S/Ag2WO4 samples. Ag2S displays weak diffraction peaks and Ag2WO4 shows strong diffraction peaks. The main characteristic peaks of bare Ag2WO4 at 16.7°, 30.2°, 31.5°, 32.9°, 45.2°, 54.5°, and 58.1° can be indexed to the (011), (002), (231), (400), (060), (233), and (262) crystal planes of Ag2WO4 (JCPDS No.70-1719) with orthorhombic phase. The main characteristic peaks of bare Ag2S corresponded to monoclinic phase of Ag2S. With low Ag2S concentration (≤33%), the characteristic diffraction peaks of Ag2WO4 displays no obvious variation. But with high Ag2S concentration (50%), a decrease in the intensity of these diffraction peaks occurs, which could be due to the interruption of weak diffraction intensity of Ag2S.
The XRD patterns of the as-prepared samples.
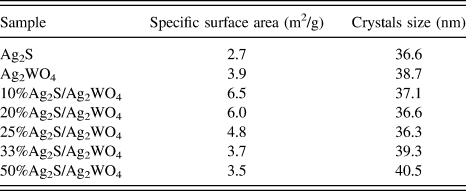
The average crystallite size of the as-prepared samples was estimated using the Scherrer equation. The strongest diffraction peaks, at ∼31.5° for Ag2WO4 and ∼34.4° for Ag2S were used in this calculation. Table I summarized the obtained results. Ag2WO4 and Ag2S have similar average crystallite size, 38.7 nm for Ag2WO4 and 36.6 nm for Ag2S. As for the Ag2S/Ag2WO4 composites, only the average crystallite size of Ag2WO4 was calculated. The deposition of Ag2S can not obviously affect the crystallite size of Ag2WO4. The specific surface area of all samples was determined by N2 physical adsorption. From Table I, we can see that all samples possess small surface area (2.7–6.5 m2/g). Coupling of small amount of Ag2S(10–25%) slightly increased the surface area and 10%Ag2S/Ag2WO4 displays the largest surface area (6.5 m2/g). But high concentration of Ag2S brings about the adverse effect, a slight decrease in surface area appears.
The average crystallite sizes and specific surface areas of the samples.

The morphologies of the prepared samples were characterized by SEM. Figure 2 shows the SEM images of the typical samples. From Fig. 2(a), we can see that pure Ag2S shows no special morphology. Ag2S was composed of the aggregations of small particles. However, Ag2WO4 appears with the regular microrod morphology with the length from 0.5 to 5 μm and diameter of ∼0.3 μm and the microrod surface is smooth. As for 10%Ag2S/Ag2WO4, many small particles were deposited over the surface of Ag2WO4 microrod. After introducing Ag2S, Ag2S made Ag2WO4 microrod display coarse surface. The coarse surface could increase the surface area. With high Ag2WO4 content (33%, 50%), the diameter of the microrod becomes bigger than pure Ag2WO4 due to more Ag2S deposited and crystallized over the outside of Ag2WO4 microrod. At the same time, many small Ag2S particles were also observed over the surface of microrod.
The SEM images of the as-prepared samples. (a) Ag2WO4, (b) Ag2S, (c) 10%Ag2S/Ag2WO4, (d) 33%Ag2S/Ag2WO4, (e) 50%Ag2S/Ag2WO4.

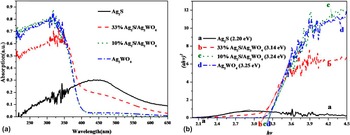
UV–Vis DRS was used to determine the light absorption of the samples at different wave length range (200–800 nm). Figure 3(a) shows that Ag2S displays obvious visible light absorption and its absorption mainly concentrates ∼450 nm. But in UV light region, Ag2S shows poor absorption. The absorption edge of pure Ag2WO4 is at around 380 and its light absorption mainly concentrates in the ultraviolet region. After introducing Ag2S, the absorption edge of Ag2S/Ag2WO4 samples shows a slight red-shift and an increase in visible light absorption appears. The optical band gap of a semiconductor can be estimated from the Tauc plot Reference Liu, Liu, Liu, Han, Zhang, Huang, Lifshita, Lee, Zhong and Kang28 [i.e., the curve of converted (αhν) n versus hν from the UV–vis spectrum, in which α, h, and ν are the absorption coefficient, Planck constant, and light frequency, respectively, and n = 2 for a direct band gap material and n = 1/2 for an indirect band gap material]. Figure 3(b) shows a good linear fit when n = 2 was applied. The value of E g for Ag2S was thus determined to 2.2 eV by measuring the X-axis intercept of an extrapolated line from the linear regime of the curve. The loading of Ag2S resulted in a decrease in the E g. The value of E g for 33%Ag2S/Ag2WO4 is 3.14 eV.
(a) UV–vis diffuse reflectance spectra of Ag2S, Ag2WO4, 10%Ag2S/Ag2WO4, and 33%Ag2S/Ag2WO4; (b) (αhν)2 versus hν curve of Ag2S, Ag2WO4, 10%Ag2S/Ag2WO4, and 33%Ag2S/Ag2WO4.

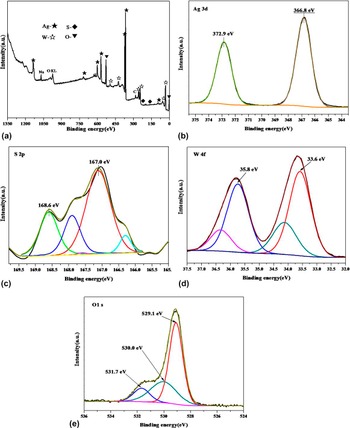
The surface element composition and chemical state of 10%Ag2S/Ag2WO4 were evaluated by XPS. As shown in Fig. 4, the XPS survey spectrum indicates the coexistence of Ag, S, W, Na and O elements. According to the previous research Reference Wang, Zhu, Wei, Chen and Shan29 the presence of Na+, K+ and etc has litter influence on photocatalytic reaction. In the high resolution XPS spectrum of Ag 3d [Fig. 4(b)], the divided two peaks at 372.9 and 366.8 eV could be assigned to the Ag+ for Ag 3d 3/2 and Ag 3d 5/2, Reference Lin, Li, Zheng, Yan, Liu, Wang and Yang22,Reference Li, Li, Gong, Bai, Ju, Wang, Xu, Zhu, Jiang and Xiong30 respectively. The band energy of S 2p [Fig. 4(c)] at 168.6 and 167.0 eV are assigned to S2− in Ag2S. Figure 4(d) shows the W 4f spectrum, two peaks at 35.8 and 33.6 eV are assigned to W 4f 7/2 and W 4f 5/2 for W6+ in Ag2WO4, respectively. Figure 4(e) shows the high resolution spectrum of O 1s. The peak at 531.7 eV is assigned to the chemisorbed oxygen in S–O. Reference Hsu, Chang and Weng31 The peaks at 530.0 and 529.1 eV are corresponding to lattice oxygen in Ag2WO4 Reference Hsu, Chang and Weng31 and absorbed oxygen, respectively.
XPS spectra of the as-prepared 10%Ag2S/Ag2WO4. (a) Survey spectrum, (b) Ag 3d, (c) S 2p, (d)W 4f, (e) O 1s.

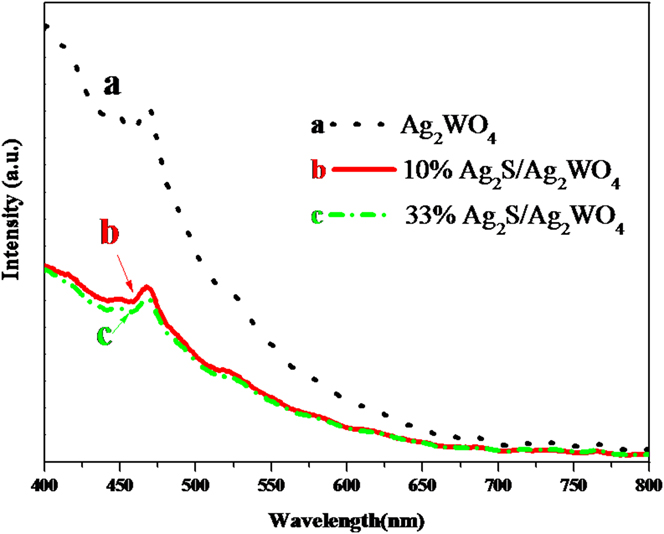
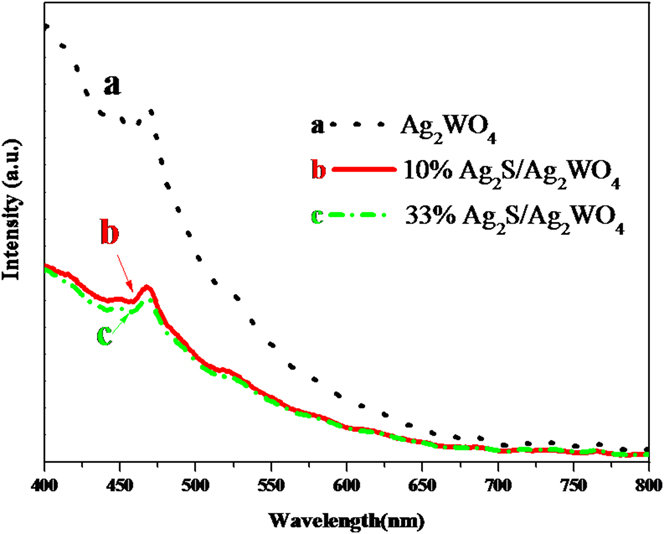
PL analysis was performed to investigate the separation efficiency of photogenerated electrons and holes. Figure 5 displays the typical PL spectra of Ag2WO4, 10%Ag2S/Ag2WO4 and 33%Ag2S/Ag2WO4. The emission peak appearing at about 468 nm could be attributed to the radiative recombination process of the photoexcited carriers in Ag2WO4. Careful observation shows that pure Ag2WO4 displays the highest intensity PL peak among these samples, which indicates that the highest recombination probability of charge carrier in Ag2S/Ag2WO4. The emission band positions of 10%Ag2S/Ag2WO4 and 33%Ag2S/Ag2WO4 are similar to Ag2WO4, while the PL peak intensity of the composite is much weaker than that of pure Ag2WO4, indicating the promoted separation efficiency of charge carriers over the composites.
PL spectra of Ag2WO4, 10%Ag2S/Ag2WO4 and 33%Ag2S/Ag2WO4.
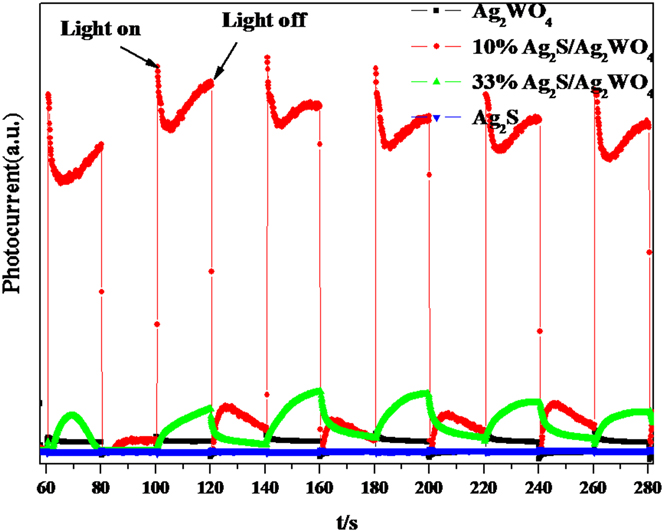
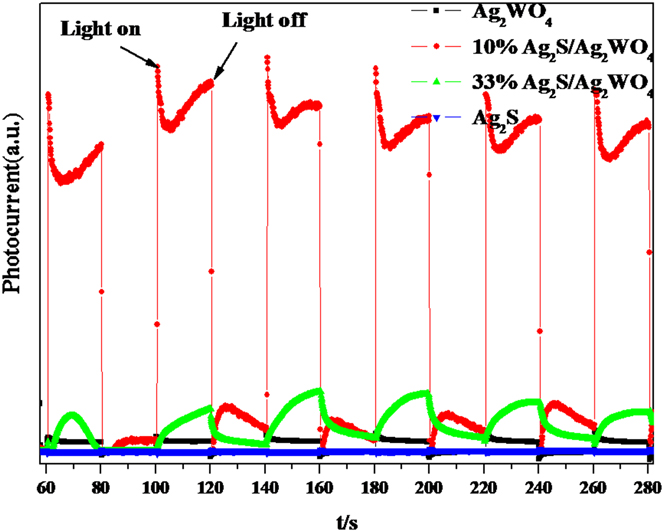
The charge separation efficiency was further investigated by transient photocurrent response. The transient photocurrent responses are monitored by electrodes consisting of Ag2WO4, 10%Ag2S/Ag2WO4, 33%Ag2S/Ag2WO4, and Ag2S samples. Figure 6 shows the comparison of the photocurrent–time (I–t) curves of the samples with several on–off cycles under intermittent xenon lamp light irradiation. Fast photocurrent responses were observed in the samples when light was turned on, and the photocurrent rapidly decayed when light was turned off, which indicates that most of photogenerated electrons are transported back to the contact across the sample to produce photocurrent under xenon lamp light irradiation. 10%Ag2S/Ag2WO4 and 33%Ag2S/Ag2WO4 exhibited much higher photocurrent intensity than Ag2WO4 and Ag2S. It is believed that the stronger photocurrent intensity suggests the high separation efficiency of electrons and holes. This result demonstrates that over Ag2S/Ag2WO4 composites, a noticeable improvement in electrons and holes separation was obtained, which could benefit the enhanced photocatalytic activity.
Transient photocurrent responses of Ag2WO4, 10%Ag2S/Ag2WO4, 33%Ag2S/Ag2WO4, and Ag2S samples in 0.1 M Na2SO4 aqueous solution under xenon lamp light irradiation.
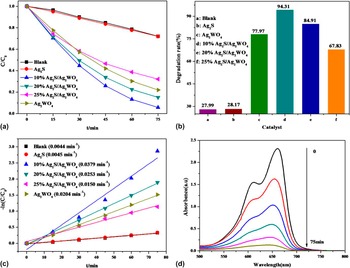
MB was used as the photodegradation target under metal halide lamp illumination. It was found that MB can be slightly degraded under light irradiation without catalysts. Figures 7(a) and 7(b) show that the addition of Ag2S as catalysts can not bring about obvious increase in the degradation rate of MB, suggesting that Ag2S has almost no photocatalytic activity for MB degradation. But, obvious photocatalytic activity over Ag2WO4 was observed. Moreover, the loading of Ag2S distinctly increased the activity of Ag2WO4 and the largest degradation rate of MB (94.31%) was observed over 10%Ag2S/Ag2WO4. Figure 7(c) shows the degradation dynamics curves of MB over as-prepared samples. The largest degradation rate constant over 10%Ag2S/Ag2WO4 reached to 0.0379 min−1, which was 1.85 times higher than that of bare Ag2WO4 (0.0204 min−1). Figure 7(d) shows the UV–visible absorption spectra of MB under different reaction time in the presence of 10%Ag2S/Ag2WO4.
(a) The adsorption and visible light photocatalytic performance of the samples in degradation of MB; (b) The comparison of degradation rates of MB under different samples; (c) Reaction kinetics of degradation of the MB over different samples; (d) UV–visible absorption spectra of MB under different reaction time in the presence of 10%Ag2S/Ag2WO4.

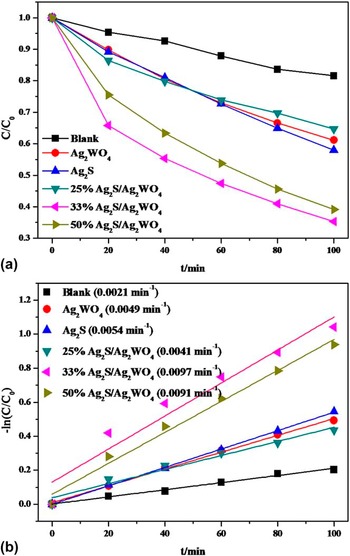
The photocatalytic activities of as-prepared samples were evaluated by other dye degradation. Figure 8(a) displays the concentration changes of MO over different samples. Both Ag2S and Ag2WO4 did not show good photocatalytic performances. Once Ag2S was coupled into Ag2WO4, a significant enhancement in activity occurred. 33%Ag2S/Ag2WO4 showed the best photocatalytic activity and the degradation rate of MO reached 64.7%. From the degradation dynamics curves of MO in Fig. 8(b), we can find that the biggest rate constant reached to 0.0097 min−1 over 33%Ag2S/Ag2WO4, which was 1.80 and 1.98 times higher than that of bare Ag2S(0.0054 min−1) and Ag2WO4 (0.0049 min−1). The stability of 33%Ag2S/Ag2WO4 was tested by recycling experiments in MO degradation. Only a slight decrease in activity was observed with the increase of recycling times. After the fourth recycle, the degradation rate over 33%Ag2S/Ag2WO4 maintained ∼50%.
(a) The visible light photocatalytic performance of the samples in degradation of MO; (b) Reaction kinetics of degradation of the MO over different samples.

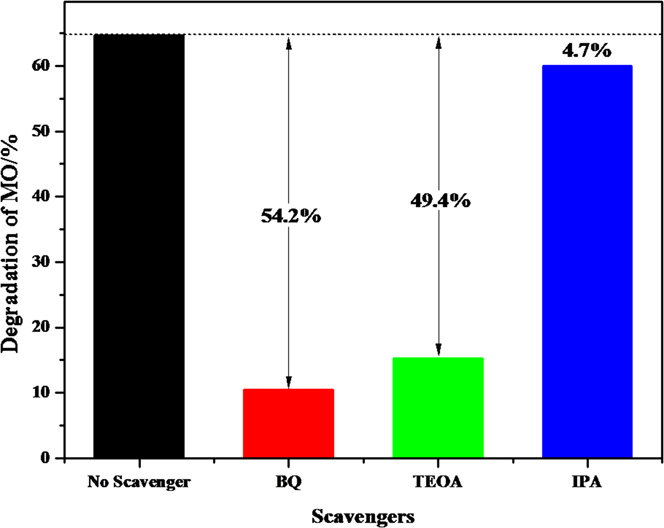
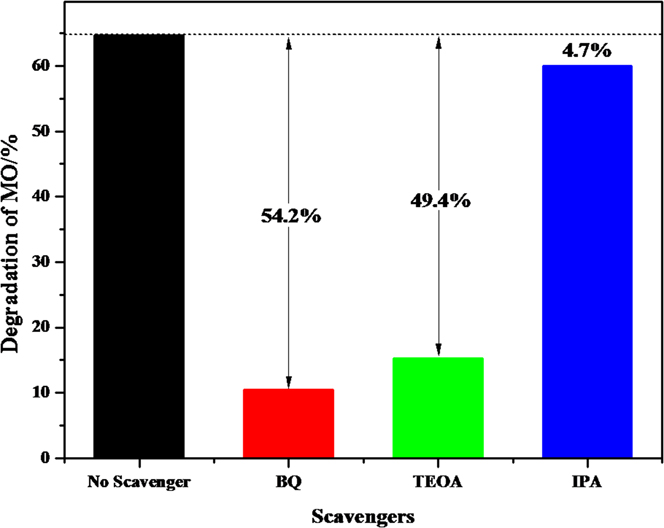
The radical capture experiment is an effective method to investigate the photodegradation reaction pathways of organic molecules on the surface of photocatalyst. Generally, hydroxyl radicals (˙OH), superoxide radicals (˙O2 −), and photogenerated holes (h+) are acknowledged as activated species in photocatalytic degradation of organic pollutants. Here, a series of radical strapping experiments were carried out by using isopropanol (IPA, a quencher of ˙OH), Reference Zhu, Lu, Wang, Tang, Yan, Shi, Wang, Gao, Yao and Dong32 benzoquinone (BQ, a quencher of ˙O2 −) Reference Lin, Xue, Yan, Yang, Yang and Yang33 and triethanolamine (TEOA, a quencher of h+) Reference Ge and Han34 over the 33%Ag2S/Ag2WO4 sample.
Figure 9 shows the effect of the quenchers on photocatalytic degradation of MO. It can be found that the degradation rate of MO still maintained around 60% in the presence of IPA, which means that hydroxyl radicals (˙OH) have little effect on photodegradation of MO. When TEOA was added into the reaction solution, the photocatalytic degradation rate decreased rapidly. It could suggest that holes (h+) are the major reactive species in the Ag2S/Ag2WO4 system. Finally, when the BQ was added into reaction solution, a smaller decrease in degradation rate was observed, which demonstrates that ˙O2 − is also the key radical to decompose the MO molecules. The band edge positions of the valence band (VB) and conduction band (CB) potentials of Ag2S and Ag2WO4 were calculated. For a semiconductor, the VB and CB can be calculated according to the empirical equation Reference Jing, Qu, Su, Yao and Fu35 :
 $${E_{{\rm{VB}}}} = X - {E^{\rm{e}}} + 0.5\;{E_{\rm{g}}}\quad ,$$
 $${E_{{\rm{CB}}}} = {E_{{\rm{VB}}}} - {E_{\rm{g}}}\quad ,$$
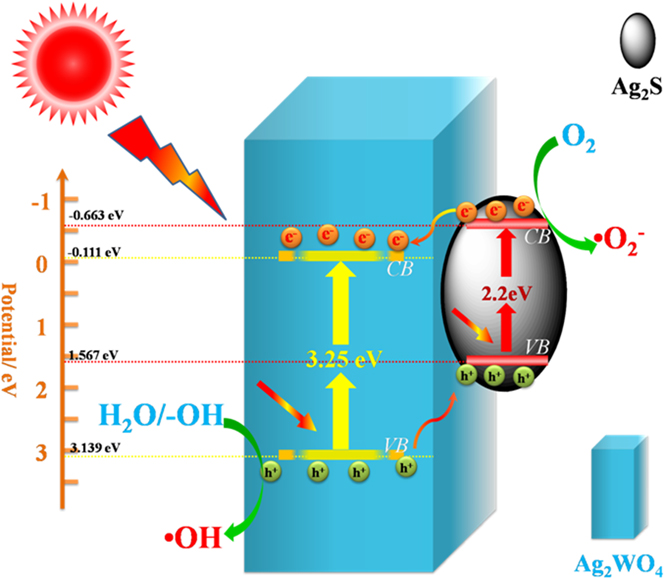
where X is the absolute electronegativity of the semiconductor, which is defined as the geometric mean of the absolute electronegativity of the constituent atoms; E e is the energy of free electrons on the hydrogen scale (approximately 4.5 eV); E VB is the VB edge potential; and E g is the band gap of the semiconductor obtained from the UV–visible diffuse reflectance absorption. There E g for Ag2S and Ag2WO4 are 2.2 and 3.2 eV, respectively. The X values for Ag2S, Ag2WO4 are 4.967 and 6.014 eV. From the calculation, the E VB of Ag2S and Ag2WO4 are about 1.567 and 3.139 eV, and the E CB of Ag2S and Ag2WO4 are estimated to be −0.634 and −0.111 eV, respectively. Thus, for the pure Ag2S, the photogenerated electrons on the CB of Ag2S can react with O2 to form ˙O2 − radicals due to the position of CB of Ag2S is more negative than the potential of O2/˙O2 − (−0.33 eV). Reference Hong, Jiang, Li, Fan, Yan, Yan and Shi36,Reference Kim, Lee and Choi37 Whereas, the VB potential of Ag2S is lower than the standard redox potential of ˙OH, H+/H2O (2.72 eV), Reference Li, Wong, Zhang, Hu, Yu, Chan and Wong38 suggesting that the photoexcited holes in the VB of Ag2S can not oxidize the adsorbed H2O molecules to product ˙OH. As for bare Ag2WO4, the photogenerated electrons on the CB of Ag2WO4 can not react with O2 to form ˙O2 − radicals because the position of CB of Ag2WO4 is less negative than the potential of O2/˙O2 − (−0.33 eV). The VB potential of Ag2WO4 is higher than the standard redox potential of ˙OH, H+/H2O (2.72 eV), suggests that the photoexcited holes in the VB of Ag2WO4 can oxidize the adsorbed H2O molecules to product ˙OH.
Effect of each reaction species on photocatalytic degradation of MO by 33%Ag2S/Ag2WO4.
Therefore, a possible mechanism for electron–hole separation and transport at the light-driven Ag2S/Ag2WO4 composite interface can be proposed. As shown in Fig. 10, upon light irradiation, electrons (e−) in VB of Ag2WO4 and Ag2S will be excited to the CB. Then the photogenerated electrons in the CB of Ag2S will product ˙O2 − radicals, and the photogenerated holes in the VB of Ag2WO4 will generate ˙OH radicals. Meanwhile, the photogenerated holes left behind in the VB of Ag2WO4 can directly oxidize organic pollutants. ˙O2 − radicals and photogenerated holes (h+) are powerful oxidative species can break down the chromophores of organic pollutants into small molecules, e.g., CO2 and H2O. The matched band energy between Ag2S and Ag2WO4 allows photoinduced holes transfer from Ag2WO4 to VB of Ag2S. Meanwhile, the Ag2S/Ag2WO4 heterostructure also allows photoinduced electrons transfer from Ag2S to the CB of Ag2WO4. Thus, the relative high separation of photogenerated holes and electrons was obtained over Ag2S/Ag2WO4, which was confirmed by former PL and transient photocurrent tests. On the other hand, the photocatalytic activity is closely related to the texture property of photocatalyst. The enhanced surface area and coarse surface could benefit the absorption of target molecules, which could be another reason for the improving photocatalytic activity over Ag2S/Ag2WO4 because after introducing Ag2S, Ag2S makes rod-shaped Ag2WO4 has coarse surface and increase its specific surface area.
Scheme of photocatalytic mechanism of Ag2S/Ag2WO4.

IV. CONCLUSIONS
Ag2S/Ag2WO4 composite microrods with different Ag2S contents were synthesized via successive precipitation route. The Ag2S/Ag2WO4 composite microrods exhibited superior photocatalytic activity and stability in dyes photocatalytic degradation. Ag2S/Ag2WO4 exhibited improved surface area than Ag2S and Ag2WO4. Moreover, the results of calculation and characterization showed that Ag2S/Ag2WO4 heterojunctions with matching electronic band structures obviously enhanced the separation of photo‐generated electrons and holes, thus greatly enhancing the photoresponse and photocatalytic activity of Ag2WO4.
ACKNOWLEDGMENTS
This work was funded by the National Natural Science Foundation of China (21567008, 21263005), Yangfan Project of Guangdong Province, Natural Science Foundation of Jiangxi Province (20161BAB203090), Jiangxi University of Science and Technology, the Young Science and Technology Project of Jiangxi Province Natural Science Foundation China (20133BAB21003), The Landing Project of Science and Technology of Colleges and Universities in Jiangxi Province China (KJLD14046).