INTRODUCTION
Preharvest sprouting (PHS), grain germination before the harvest, is a serious problem in many wheat-growing areas of the world. Periods of rainfall and high humidity after grain maturity but before the harvest can induce PHS. Germination initiates when grains absorb moisture. Visible symptoms of PHS can vary from grain swelling, germ discoloration, seed coat splitting to root and shoot emergence. The weather conditions during ripening and preharvest are important factors affecting sprouting (Paterson et al., Reference Paterson, Sorrells and Obendorf1989) and FN (Mares and Mrya, Reference Mares and Mrva2008). The grain ripening under low temperature conditions induces higher level of dormancy than under higher temperature conditions (Reddy et al., Reference Reddy, Metzger and Ching1985). The grain and flour quality parameters impacted by PHS are strongly related with climatic variables and soil water condition (Guarienti et al., Reference Guarienti, Ciacco, Cunha, Del Duca and Camargo2003).
There are several methods to evaluate PHS and these include artificial sprouting of whole (intact) spikes, germination tests, natural weathering of crop in field trials, artificial weathering trials, and indirect assessment of sprouting by measuring Hagberg FN and molecular markers (DePauw et al., Reference DePauw, Knox, Singh, Fox, Humphreys and Hucl2012). Among these, the artificial weathering trials have been used to evaluate a large number of genotypes quickly and to eliminate inferior ones (Bassoi et al., Reference Bassoi, Flintham and Riede2006; Franco et al., Reference Franco, Pinto, Scapim, Schuster, Predebon and Marchioro2009; MacMaster and Derera, Reference MacMaster and Derera1976). The time period in the assessments of PHS in rain simulators varied from 60 h (Franco et al., Reference Franco, Pinto, Scapim, Schuster, Predebon and Marchioro2009; Gavazza et al., Reference Gavazza, Bassoi, Carvalho, Bespalhok Filho and Panobianco2012) to 96 h (Shorter et al., Reference Shorter, Munro and Hodgkinson2005) and as much as 120 h (Singh et al., Reference Singh, Knox, Clarke, Clarke, Singh, DePauw and Cuthbert2014).
In addition, the heat units expressed in degree-days (DD) is a useful index to study the timing of biological processes (McMaster and Wilhelm, Reference McMaster and Wilhelm1997). For the PHS studies conducted in a rain simulator, the values of temperature and accumulated degree-days (ADD) that enable better characterization of genotypic differences are not clear. In order to determine the test conditions that enable larger expression of genetic variability for PHS, this study aimed to evaluate the effects of temperature (minimum, mean and maximum) and DD on the FN and germination percentage of wheat grain.
MATERIALS AND METHODS
Field experiments were conducted at the Experimental Station of IAPAR (Instituto Agronômico do Paraná), located at Londrina (23°23ʹS, 50°01ʹW, altitude 556 m), in state of Paraná, Brazil. The soil is a Typic Haplorthox, characterized by a deep profile, fine texture, and very deep water table. Fertility is constrained by low organic matter and phosphorus content. The region has a subtropical humid climate characterized by long hot summers and mild sunny winters. Experiments reported in this study were conducted in four years with two planting dates, and comprised of 13 spring wheat (Triticum aestivum L.) cultivars (BR 18, BRS 220, CD 104, CD 105, CD 108, CD 114, CD 116, Frontana, IPR 85, IPR 128, IPR 136, OR1 and SAFIRA). Old Brazilian cultivar Frontana, reported as tolerant to PHS (Czarnecki, Reference Czarnecki and Mares1986), was used as a check in the study. Field plots consisted of three rows of two meters in length, spaced 30 cm apart and seeded at a rate of 350 seeds m−2. Recommended agronomic management practices for wheat were used during the crop season (IAPAR, 2003). At physiological maturity, around 80 uniform spikes per cultivar were hand harvested (Hanft and Wych, Reference Hanft and Wych1982) and kept at room temperature.
The PHS tests were performed in a greenhouse (length, width and height of 10, 4, and 3 m, respectively), made of galvanized pipes and covered with a dark polyethylene screen mesh with plastic transparent sheeting on the roof. Photosynthetically active radiation (PAR) inside the greenhouse was measured with portable equipment (LCpro, ADC Bioscientific Ltd., UK) and was determined to be 29% of the outside environment.
Twenty spikes per cultivar, attached to a 4.0 cm peduncle, were inserted in rows on polystyrene trays with 100 cm × 50 cm × 5 cm of length, width and height, respectively. Spikes were spaced at 10 cm between the rows and 5 cm within the row. The trays were kept on a table at a height of 1.4 m above ground and 0.8 m below the micro-sprinkler system. The sprinkler system consisted of four tubes distanced 80 cm apart with sprinklers placed at 60 cm on the line. Each test started around 9:00 a.m. and finished 48 h later. The nebulizer was controlled by a timer, set to turn on and off each 30 min, which gave the equivalent to 280 mm of rainfall per day. The polystyrene trays were moved manually, three times a day, to assure uniform misting. After 48 h of misting, the spikes were removed from the greenhouse and sun-dried to stop the germination process. All the spikes were threshed manually and grain germination was observed in duplicate using 50 random seeds. A magnifying glass (10X) was used to observe pericarp rupture as an indication of the initiation of germination (Bassoi and Flintham, Reference Bassoi and Flintham2005; Nyachiro et al., Reference Nyachiro, Clarke, DePauw, Knox and Armstrong2002).
The FN (also known as Hagberg Number) is an internationally standardized method to measure the α-amylase activity in the grain, which indirectly relates to the degree of sprouting damage. It was determined in samples (7 g) of ground wheat, which were mixed with 25 mL of distilled water in a FN tube with a stirrer and shaken to form slurry. This slurry was heated in a boiling water bath at 100 °C and stirred constantly. The time it took the stirrer to drop through the paste was recorded as the FN value in a Perten FN 1500 (Perten Instruments), according to the 56–81 B method of the American Association of Cereal Chemists (AACC, 2000).
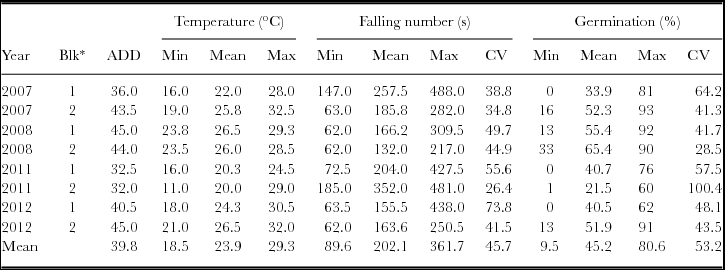
The ADD sum of daily DD, used in the study was calculated as follow: DD = Tmean – Tbase, where Tmean = (Tmax + Tmin)/2, Tmax and Tmin are daily maximum and minimum air temperature, respectively, and Tbase is the base temperature of 4 °C (Acevedo et al., Reference Acevedo, Silva, Silva, Curtis, Rajaram and Gomez Macpherson2002). The temperatures (recorded on a thermograph R. Fuess, Germany) and ADD for the duration of the experiments are presented in Table 1.
Accumulated degree-days (ADD), temperature, falling number and germination percentage of 13 wheat genotypes under rain simulator with 48 h duration.

*Test within each year.
Regression analysis and Pearson correlation coefficients of FN and GP with temperatures, ADD and coefficient of phenotypic variation were performed using the softwares Microsoft Office Excel and SAS System.
RESULTS AND DISCUSSION
There are several methods for testing PHS. The duration of these tests may vary considerably according to the method and/or type of assessment. This study considered the FN test as an appropriate measure to determine the damage caused by PHS in wheat genotypes. In general, the FN value can vary from 62 s for heavily sprouted grains, with excessive enzyme activity, to well over 500 s for grains from warm and dry areas. The exact FN values for industrial quality segregation vary between countries and/or markets depending on the end use purpose of the grain. The minimum values of the FN required for the top quality and general bread wheat class in Brazil are 250 and 220 s, respectively (Brazil, 2010).
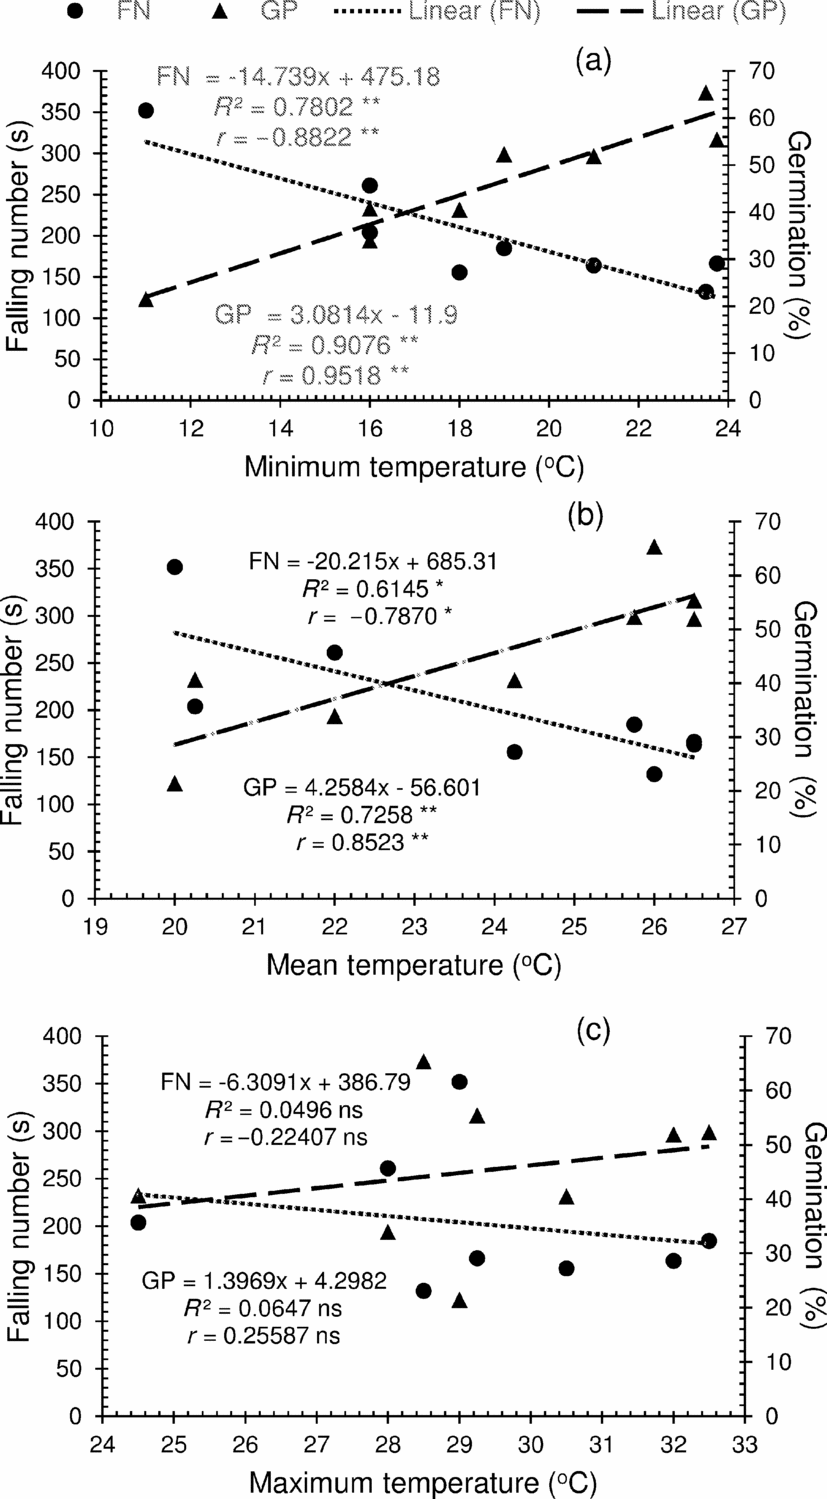
The statistical analysis, correlation and regression, performed on a large data set generated over the years in different experiments allowed us to determine that FN and GP values were highly associated with Tmin, Tmean and ADD, but not Tmax. The minimum temperature varied from 11.0 °C to 23.8 °C over the years under study (Table 1). A regression and correlation analysis of Tmin with FN (R 2 = 0.7802**; r = −0.8822**) and GP (R 2 = 0.9076**; r = 0.9518**) showed a highly significant influence on the process leading to grain sprouting (Figure 1a). Any increase in the Tmin led to a reduction in the FN and promoted the grain germination. On the other hand, the relationship of Tmean with the sprouting was not seen as strong as in the case of Tmin (Table 1). In spite of the dispersal of data points for both FN and GP shown in the Figure 1b, the analysis revealed a moderate influence of Tmean on FN (R 2 = 0.6145*; r = −0.7870*) and GP (R 2 = 0.7258*; r = 0.8523**) values. Therefore, any increase of the mean temperature, caused by a related rise in Tmin or otherwise, reduced FN values and increased the percentage of sprouted grains. A similar analysis conducted on the effect of Tmax with FN and GP was non-significant (Figure 1c).
Falling Number (FN) and germination percentage (GP) of 13 wheat genotypes subjected to simulated rainfall, related to: (a) minimum temperature; (b) mean temperature; (c) maximum temperature. Each symbol represents the mean value of 13 genotypes.

Our study demonstrates that the minimum and mean temperatures exert far more impact on the genotype discrimination for sprouting than the maximum temperature. Similar temperature influence was observed by Mares (Reference Mares1993), who asserted a higher dormancy in cultivars exposed to temperature regime (day/night) of 26.5/8.5 °C compared to those exposed to 35.6/17.5 °C.
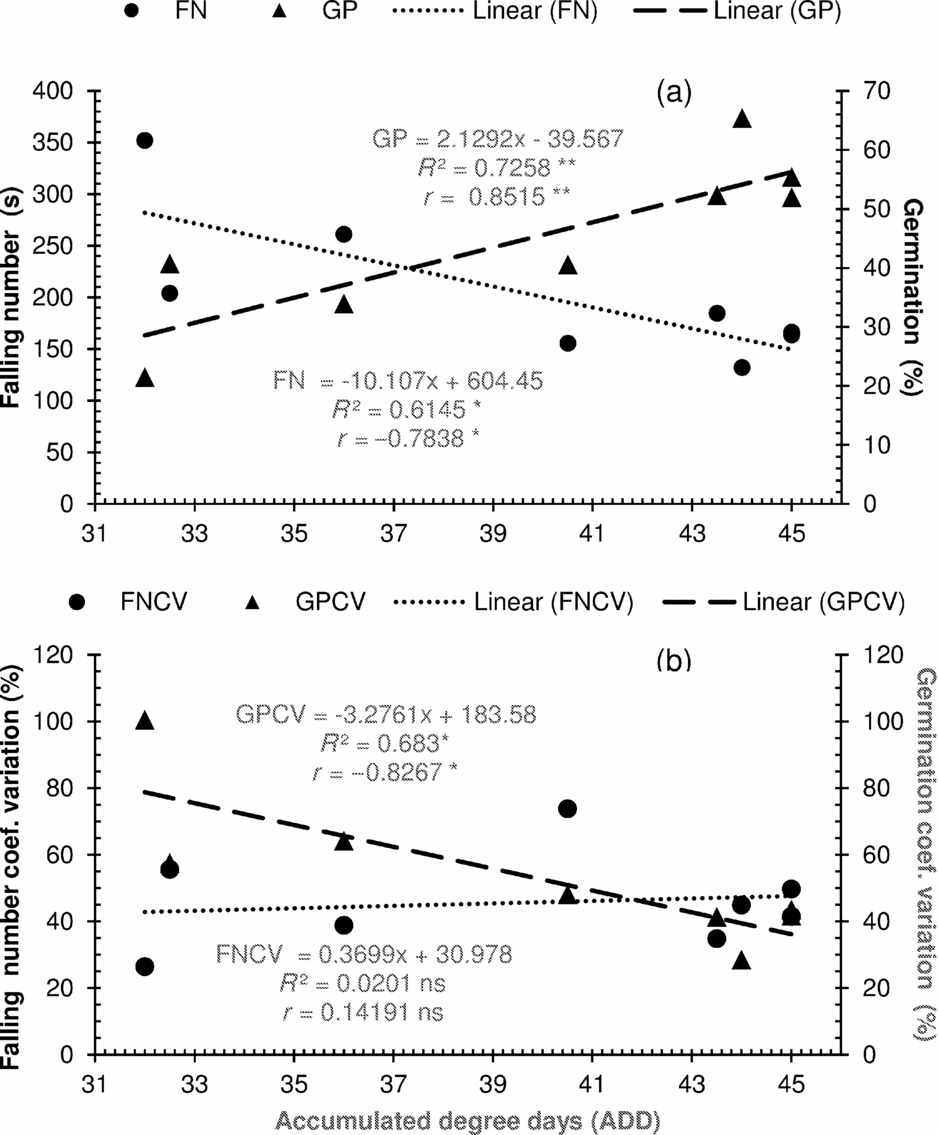
With respect to the aggregate thermal influence expressed as ADD during the nebulization tests, the values ranged from 32 to 45 (Table 1). A statistical analysis of this parameter showed a dispersal of points similar to the mean temperature and a significant relationship of ADD with FN (R 2 = 0.6145*; r = −0.7838*) and GP (R 2 = 0.7258**; r = 0.8515**), as shown in Figure 2a. As mentioned earlier, this observation confirms that any increase of DD results in a decline of FN value leading to higher percentage of sprouting. Taking the reference FN values between 220 and 250 s, accepted by the industry, for selection of genotypes tolerant to PHS, it was observed that these values correspond to a range of 35–38 ADD and 36–42 % of sprouted grains (Figure 2a). However, larger phenotypic coefficient of variation observed for GP at lower ADD (R 2 = 0.683*, r = −0.8267*, Figure 2b), indicates better discrimination of sprouting ability among genotypes at lower ADD values. The data presented in the Figure 2b also indicates lower coefficient of variation for GP, confirming our inability to discriminate among genotypes at higher ADD.
Accumulated degree-day (ADD) of 13 wheat genotypes subjected to simulated rainfall, related to: a) Falling number (FN) and germination percentage (GP): (b) falling number coefficient of variation (FNCV) and germination percentage phenotypic coefficient of variation. Each symbol represents the mean value of 13 genotypes.

Thus, for the selection of genotypes based on FN or GP, we suggest using an ADD value close to 35 to select for FN values between 220 and 250 s. As shown in the Table 1, the ADD value of 36 coincides with FN values between 147 and 488 s and grain germination values between 0 and 81%, which allowed us to visualize a wide range of variation in the performance of genotypes for PHS.
The duration of a test for sprouting resistance in a rain simulator depends on the weather conditions (Bizova et al., Reference Bizova, Hromadko and Svec2011; DePauw et al., Reference DePauw, Knox, Singh, Fox, Humphreys and Hucl2012) and the type of evaluation (Paterson et al., Reference Paterson, Sorrells and Obendorf1989). Test durations between 60 and 120 h have been used for visual evaluations of genotypes (Franco et al., Reference Franco, Pinto, Scapim, Schuster, Predebon and Marchioro2009; Gavazza et al., Reference Gavazza, Bassoi, Carvalho, Bespalhok Filho and Panobianco2012; Shorter et al., Reference Shorter, Munro and Hodgkinson2005; Singh et al., Reference Singh, Knox, Clarke, Clarke, Singh, DePauw and Cuthbert2014). Converting these durations to DD, based on the temperature data reported in each of these studies, it was observed that these researchers conducted their tests at 54 ADD (Shorter et al. Reference Shorter, Munro and Hodgkinson2005), 59 ADD (Gavazza et al., Reference Gavazza, Bassoi, Carvalho, Bespalhok Filho and Panobianco2012) and 70 ADD (Singh et al., Reference Singh, Knox, Clarke, Clarke, Singh, DePauw and Cuthbert2014). For analytical evaluations, such as FN or grain rupture (observed through the magnifying glass), no references were found associating these data with the measurements of DD.
The research reported here is based on mist duration of 48 h, generating an ADD between 31 and 45 (Table 1). Under these conditions, ADD value of 35 allowed most consistent expression of genetic variability for sprouting. These results can serve as an indicator to calculate the duration of sprouting tests based on the temperature regime of an area or test site. As an example, at a mean temperature of 21.5 °C, test duration of 48 h in a rain simulator may be best to discriminate genotypes for FN and/or percentage of sprouting based on pericarp rupture. We believe that the results of this large study provide an ideal set of experimental conditions, as well as determine the test duration for sprouting under controlled conditions. In our evaluations of PHS, we found desirable to finish the test early in the morning to enable sun or oven drying of spikes on the same day.
CONCLUSIONS
In a rain simulator study to determine PHS resistance of 13 wheat genotypes, the thermal sum of around 35-DD allowed the highest genotypic differentiation based on FN values and/or grain rupture of pericarp, expressed as germination percent. In addition, a mean temperature of around 21.5 °C and test duration of 48 h is considered ideal to evaluate genotypes for the above-mentioned parameters. Our results show a significant relationship of FN and GP parameters with the minimum and mean air temperatures and thermal index (ADD). Any increase in the temperature regime and/or the thermal index led to decreases in FN and increases in grain germination.