



1. INTRODUCTION
The development and application of freshwater and marine areas is becoming increasingly extensive. Owing to the special working requirements of water, most water operations need to be accomplished by ships. Unmanned surface vehicles (USVs), with the advantages of flexible controllability, strong autonomy and field operation, have been widely applied in the civil and military fields, such as maritime cruise ships, emergency rescue activities, lake patrols and hydrological monitoring (Thomas et al., Reference Thomas, Howells and Maier2008; Liu et al., Reference Liu, Song and Bucknall2015; Nad et al., Reference Nad, MiSkovic and Mandic2015; Nikola et al., Reference Nikola, Nad and Rendulic2015; Liu and Bucknall, Reference Liu and Bucknall2016; Ma et al., Reference Ma, Zhao, Diao, Gan, Bi and Zhao2016).
In order to guide a USV through a cluttered environment, planning a high-quality and collision-free path is a critical part during the USV's voyage (Perera et al., Reference Perera, Ferrari, Santos, Hinostroza and Guedes Soares2015). Particularly, path planning is an important technology in the application of the USV's intelligent control and an indispensable part of driverless technology, which not only determines the level of autonomy of the vehicle but also premises the reliability of a mission and the likelihood of success. Fundamentally, USV path planning is a branch of classical robot tracing, which mainly concerns two factors: the total path distance and safety (Zheng et al., Reference Zheng, Xiong and Luo2014). In addition, the quality of the generated trajectory, such as smoothness and continuity, also needs to be taken into account (Smierzchalski, Reference Smierzchalski1999).
Path planning technologies can be generally divided into two groups: the pre-generative approach (static planning) and the reactive approach (dynamic planning) (Liu and Bucknall, Reference Liu and Bucknall2015). Shi et al. (Reference Shi, Su, Wang, Wan and Luo2019) focused on the smoothness and seaworthiness properties of the path. A hybrid A* algorithm with motion primitive constraints is proposed to generate an initial reference path. In order to optimise the path, a number of computational intelligent algorithms have been applied. A genetic algorithm (GA) is used to determine the optimised path for a USV under environmental loads in Kim et al. (Reference Kim, Kim, Jeon, Kim, Song and Paik2017). The optimised paths are determined by numerical simulations. An approach of fast path planning based on a Voronoi diagram and an improved GA has been proposed in Cao (Reference Cao2015). Furthermore, as a branch of intelligent algorithms, the swarm intelligence algorithm plays an important role in research on USV global path planning. Song et al. (Reference Song, Mao, Xiang, Zhou and Du2015) proposed a method for USV global path planning based on particle swarm optimisation. By using typical obstacle modelling and the ant colony algorithm (ACO) for global path planning, the USV global path was achieved in Wang and Chi (Reference Wang and Chi2016). Song (Reference Song2014) improved the ACO-based grid environment model for USV global path planning. Meanwhile, some works have been done to combine various intelligent swarm algorithms for USV global path planning. For example, in Hu et al. (Reference Hu, Li and Ding2015), both GA and ACO are used to generate an initial pheromone distribution and carry out dynamic integration of genetic operators, which not only can improve the convergence rate of the algorithm, but also can solve the problem of precocious and poor global search ability.
The bacterial foraging optimisation (BFO) algorithm is a new bionic algorithm, which has become another hotspot in the field of heuristic computing. Owing to its advantages, such as parallel searching of the swarm intelligence algorithm and ease of jumping out from local minima, it has attracted more interest. At present, BFO has been successfully applied in many fields, such as image processing (Madhubanti and Chatterjee, Reference Madhubanti and Chatterjee2008; Nandita et al., Reference Nandita, Chatterjee and Munshi2011; Rajinikanth and Couceiro, Reference Rajinikanth and Couceiro2014), shop scheduling (Wu et al., Reference Wu, Zhang, Jiang and Liang2007; Raj and Priya, Reference Raj and Priya2013; Cheng et al., Reference Cheng, Tong, Shen and Ming2015; Li et al., Reference Li, WU and Wang2015; Zhao et al., Reference Zhao, Jiang, Zhang and Wang2015), robotics (Jati et al., Reference Jati, Singh and Rakshit2012; Mickael et al., Reference Mickael, Kiani and Fateh2012; Yang et al., Reference Yang, Wang and Wang2012; Liang et al., Reference Liang, Li, Wu and Chen2013; Frantisek et al., Reference Frantisek, Babinec, Kajan, Florek and Fico2014), etc.
1.1. Contributions of this paper
This paper proposes a more efficient grid partition-based hybrid BFO path planning method, named AS-BFO, by integrating the A* algorithm to enhance the conventional BFO algorithm, thus solving the issue of the generation of a discontinuous path. The main contributions of this paper are listed below:
(1) The bacterial foraging optimisation algorithm is improved and applied in USV global path planning under the grid environment.
(2) The cost function of the A* algorithm is integrated into the tumble motion, which solves the problem of repairing a discontinuous path.
(3) The relative optimal parameter combination is obtained and it makes the AS-BFO algorithm run effectively in different working environments.
1.2. Organisation of this paper
The rest of the paper is organised as follows. Section 2 describes the basic steps of the BFO. Section 3 establishes an environmental model and introduces the AS-BFO for our problem. The parameter combination simulation and the optimal parameter combination are obtained, and the sensitivity analysis of AS-BFO parameters is carried out in Section 4. GA, ACO and AS-BFO are selected for comparison in different experimental environments. Section 5 concludes this work.
2. DESCRIPTION OF BFO
BFO is a global random searching algorithm, whose operation aims to simulate the physiological behaviour of Escherichia coli bacterium in the process of foraging behaviour, the modelling iteration producing the optimal solution. The BFO consists of three principal mechanisms to find the relative optimal solution: chemotaxis, reproduction and elimination–dispersal, each of which is detailed below (Passino, Reference Passino2002; Hossain and Ferdous, Reference Hossain and Ferdous2015; Zhao and Wang, Reference Zhao and Wang2015).
2.1. Chemotaxis
In biology, the movement of bacteria is called chemotactic behaviour, and there are two types of chemotaxis of bacteria: swim and tumble/rotate. Swimming is the motion of bacteria forwards along the same direction as the last stage; rotation is the bacteria staying in the same position and rotating itself into a new direction. These two chemotactic operations guarantee that bacteria search the problem space as well as avoid obstacles in the searching process. The new position of the bacteria after chemotaxis can be obtained by
 $$\theta^i(j, k, l)=\theta^i(j+1, k, l)+ C(i)\frac{{\Delta ( i )}} {{\sqrt {\Delta^\text{T} (i)\Delta ( i )} }},$$
where  $\theta^{i}( j, \; k, \; l) $ represents the bacterium i in the jth chemotaxis, kth reproduction and lth elimination–dispersal step, C(i) denotes the size of chemotaxis during each swim or tumble, and Δ (i) is the direction vector of the jth chemotactic step. Finally, Δ (i) is a random direction vector with a range of [−1, 1].
During cell-to-cell communication, when each bacterium moves, it releases attractant to signal other bacteria to swarm towards it. At the same time, a repellent signal is also released to warn other bacteria to keep a safe distance from itself. Such a communication mechanism is also simulated by representing the combined cell-to-cell attraction and repulsion, which can be expressed by
 $$\begin{align} J_{cc} (\theta^i(j, k, l) ,\theta(j, k, l)) &= \sum_{i = 1}^S {J_{cc}^i (\theta^i,\theta)}\notag\\ &= \sum_{i = 1}^S {\left[ - d_{\text{attract}} \exp \left( - \omega_{\text{attract}} \sum_{m =1}^D {(\theta_m - \theta_m^i )^2 } \right)\right]}\notag\\ &\quad +\sum_{i = 1}^S {\left[h_{\text{repellant}} \exp \left( - \omega_{\text{repellant}} \sum_{m =1}^D {(\theta_m - \theta_m^i )^2 } \right)\right]}, \end{align}$$
where  $J_{cc}^{i} ( \theta^{i} , \; \theta) $ denotes the object function value, which represents a time-varying objective function, S represents the total number of bacteria, D is the number of variables to be optimised, and
 $d_{\text{attract}}$,
 $\omega_{\text{attract}}$,
 $h_{\text{repellant}}$ and
 $\omega_{\text{repellant}}$ are coefficients representing the attractive depth, attractive width, repellent height and repellent width, respectively.
2.2. Reproduction
After the chemotaxis, the health status of each bacterium is determined by the sum of the step fitness, i.e. 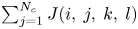 $\sum_{j=1}^{N_{c}}J( i, \; j, \; k, \; l) $, where N c is the maximum step in a chemotaxis process. Based on their health status (fitness values), all bacteria are sorted. In the reproduction step, the half of the bacteria with higher fitness values survive and the others are eliminated. And then each surviving bacterium splits into two identical ones. The reproduction process keeps the population of bacteria constant.
2.3. Elimination–dispersal
In order to avoid the bacteria becoming stuck around the initial positions or local optima, the elimination–dispersal process is introduced in the BFO. In the elimination–dispersal process, some bacteria are selected, based on a probability P ed, to be moved to another position within the environment.
3. AS-BFO FOR USV GLOBAL PATH PLANNING
The proposed AS-BFO method is detailed in this section. In particular, given a known map with a number of obstacles, the proposed algorithm first grid partitions the given map into an n × n grid environment. Then, the conventional BFO algorithm is applied to find the optimal path. During the chemotaxis operations of the BFO, each step will be monitored to check whether or not the tumbled node is continuous with the previous node as well as the following node. If any discontinuous path is identified, the A* algorithm is employed to repair the discontinuous part. This process will be applied until an optimal solution is found. The final optimal solution will be the best path for the given map. The flowchart of the proposed method is shown in Figure 1, and the key components are detailed below.
Flowchart of AS-BFO.

The grid method is an effective modelling method. The method is easy to construct, modify and simulate the geographical environment. The grid map not only can simulate relatively accurate environmental information for the USV, but also can provide simulation environments of different sizes and complexity for algorithm experiments. This provides a good basis for analysing the performance of the algorithm. The electronic chart is a digital chart that is a type of map model for USV global path planning. Electronic charts can provide map information for USVs, but such maps are less flexible than grid maps. A cellular grid map is also applied to the study of global path planning. However, in cellular grid maps, the minimum steering angle can only reach 60°, so the grid map has an advantage in steering angle. USVs usually work in vast stretches of water.
The work environment can be considered as a two-dimensional space with static obstacles. Therefore, the working environment of a USV can be gridded. In the general analysis, if obstacles occupy less than one grid, it will be considered as one whole grid (Yang et al., Reference Yang, Wang and Wang2012). Thus, it will establish a one-to-one correspondence between the grid number and the two-dimensional coordinates. The data structure of the algorithm is a nine-square graph centred on the current node, with a total of eight adjacent nodes. The following node must be chosen from these eight neighbours. In the n × n grid environment, the correspondence between the grid number S and its coordinates (x, y) is shown by
 $$\left\{\begin{aligned} x& = \bmod (S - 1,n) + 0{\cdot}5, \hfill \\ y& = n + 0{\cdot}5 - \text{ceil}(S/n), \hfill \\ \end{aligned}\right.$$
where mod(·) is the remainder operation and  $\text{ceil}({\cdot}) $ rounds an element to the nearest integer towards positive infinity. As mentioned above, the goal of path planning is to find an ordered grid with the shortest distance among feasible ordered grids.
3.1. Coding method
The population described in this paper consists of a limited number of bacteria. Each bacterium is connected by a series of nodes. One bacterium represents a feasible path. It should be noted that, owing to the randomly generated paths being composed of different numbers of nodes, the lengths of the paths are not uniform. Therefore, variable length bacteria are used to represent individuals. Figure 2 shows a path and its corresponding bacterium.
A feasible path.

3.2. Three operators of AS-BFO
3.2.1 Chemotaxis
This paper defines the chemotaxis operation of BFO in the grid environment. Chemotaxis in traditional BFO means that any nodes will tumble and swim in any direction. However, some tumbling motions can result in discontinuous paths in the grid environment. Therefore, AS-BFO improves the chemotaxis operator. Firstly, it judges whether the tumbled nodes are continuous with the previous and the following nodes. Then, the discontinuous paths are repaired using the A* algorithm.
When the chemotaxis operator is performed, the following situations are possible. Firstly, after the node is tumbled, the tumbled node is continuous with its previous and following nodes, as shown in Figure 3. If n 2 is a tumble node, it can be randomly tumbled to the adjacent free grids. Taking Figure 3 as an example, n 2 tumbles to n′2. Then, according to Equation (4), it is judged whether n 1 and n′2, n′2 and n 3 are, respectively, continuous. If Δ = 1, then n 1 and n′2, n′2 and n 3 are continuous; otherwise, they are not:
Schematic diagram of continuous nodes.

 $$\Delta = \max\{\text{abs}(x_{\text{tumbled}} - x)\}, \text{abs}(y_{\text{tumbled}} - y) \}$$
Here  $( x_{tumbled}, \; y_{tumbled}) $ are the horizontal and vertical coordinates of the tumbled node (n′2) and (x, y) are the horizontal and vertical coordinates of the previous or the following node (n 1, n 3). The path after the tumble motion is marked by the red line.
Secondly, it is discontinuous with the previous or the following node, when the node is tumbled. As shown in Figure 4(a), n 2 is used as the tumble node. So n 2 is tumbled to n′2, and then it is judged whether n 1 and n′2, n′2 and n 3 are, respectively, continuous. It can be observed that n′2 and n 3 are continuous; however, n′2 and n 1 are not continuous. At this time, the evaluation function of the A* algorithm is applied to the tumble motion, and the problem of repairing the discontinuous path has been solved. Figure 4(b) shows that there are many repaired nodes around n′2(x, y), and the yellow nodes are repaired nodes.
Schematic diagram of discontinuous nodes. (a) Intermittent path, (b) Patching path.

A repaired node will be selected depending on Equations (5)–(7):
 $$\begin{align} & F_{\min } = G + H, \end{align}$$
 $$\begin{align} & G = \sqrt {(x_{\text{tumbled}}' - x_{\text{tumbled}}'' )^2 + (y_{\text{tumbled}}' - y_{\text{tumbled}}'' )^2 }, \end{align}$$
 $$\begin{align} & H = \sqrt {(x - x_{\text{tumbled}}'' )^2 + (y - y_{\text{tumbled}}'' )^2}. \end{align}$$
Here (x, y) represents the coordinates of the previous node,  $( x'_{\text{tumbled}}, \; y'_{\text{tumbled}}) $ denotes the coordinates of a node after it has been tumbled, and
 $( x''_{\text{tumbled}}, \; y''_{\text{tumbled}}) $ indicates the coordinates of the repair nodes. As shown in Figure 4(b), we use
 $( x''_{n_{2}}, \; y''_{n_{2}}) $ as the coordinates of the repaired node. When the discontinuous path is repaired, it is represented by the red line. Although the path increases slightly, this method solves the problem that the path is discontinuous after the node is tumbled.
Finally, the tumbled node is discontinuous with the previous node and the following node after the node is tumbled. Then, the repaired point can be found by Equations (5)–(7) so that the path is continuous. Note that we need to use the evaluation function of the A* algorithm twice in this condition. The method to deal with discontinuity with the previous and the following nodes is the same as the above method. Therefore, an effective method to repair discontinuous paths is proposed, which ensures that each tumble can be performed efficiently.
3.2.2. Reproduction
When the chemotaxis operation is completed, the path length represented by each bacterium is sorted. The half of the bacteria with longer paths are eliminated, and the half of the bacteria with shorter paths are reproduced. Thus, bacteria number is kept unchanged.
3.2.3. Elimination–dispersal
When the reproduction operation is completed, a random probability P r is generated and compared with the fixed migration probability P ed. If P r < P ed, the bacterium is dispersed. This operation can reduce the possibility of bacteria falling into a local optimal solution. It can also be a good solution for maintaining diversity.
3.3. Algorithm description
In this algorithm, the path optimisation problem is encoded. One feasible path represents one bacterium. The initial population is usually randomly generated without infeasible paths, which can reduce the blindness of initial population generation. Among the three main operators in the algorithm, the chemotaxis operator can improve the local search accuracy of bacteria, the reproduction operator can increase the convergence performance of bacteria, and the elimination–dispersal operator can increase the diversity of solutions. The parameters of AS-BFO are tightly coupled. The selection of the parameters directly affects the performance of the algorithm. At present, there is no perfect theoretical basis to determine the optimal combination parameters. The traditional method is repeated trials to obtain the relative optimal combination of parameters.
4. ANALYSIS OF RESULTS
It is very important for the application of AS-BFO in practical problems to study the parameters of population size, chemotaxis number, replications number and elimination–dispersal number. However, the setting of the parameters mainly depends on the statistical data and simulation experiment. This paper studies the path planning in two different environments shown in Figure 5, in which the islands represent the obstacles, S denotes the start point and G represents the goal.
Generation of simulation environment in line with real ones, where S denotes the start point and G represents the Goal. The map size is 20 × 20 (i.e. S3).

4.1. Experiment 1
Different parameter settings may lead to different performances. In this experiment, different parameters are applied in the proposed method, in order to compare the performances generated by different parameter settings.
4.1.1. Population number
In this experiment, the chemotaxis number N c = 5, reproduction number N re = 2 and elimination–dispersal number N ed = 2 are fixed, and the population number P is selected to be 10, 20, 30, 40, 50, 60, 70 and 80, respectively. The simulated results are shown in Figure 6. The results show that the greater the number of bacteria, the faster the convergence rate.
Impact of the number of bacteria on AS-BFO using S3. (a) Correspondence between the number of bacteria and the path length. (b) Correspondence between the number of bacteria and the number of iterations.

4.1.2. Chemotaxis number
The chemotaxis operator is an important operator of AS-BFO, and the chemotaxis number directly affects the local optimisation ability of the algorithm. In this simulation experiment, P = 50, N re = 2 and N ed = 2 are fixed, and the chemotaxis number is set to N c = 1, 2, 3, 4, 5, 6, 7 and 8. The results are shown in Figure 7. For environment 1, when N c = 7, the path is the shortest. When N c = 8, the number of iterations is the least. For environment 2, when N c = 8, the path is the shortest. When N c = 6, the number of iterations is the least.
Impact of the chemotaxis number on AS-BFO using S3. (a) Correspondence between the chemotaxis number and path length. (b) Correspondence between the chemotaxis number and number of iterations.

4.1.3. Reproduction number
The reproduction operator reduces population diversity and increases the convergence rate of the algorithm. In the simulation experiment, P = 50, N c = 5 and N ed = 2 are fixed, and the reproduction number is set to N re = 1, 2, 3, 4 and 5. The results are shown in Figure 8. For environment 1, when N re = 5, the path is the shortest. When N re = 4, the number of iterations is the least. For environment 2, when N re = 2, the path is the shortest. When N re = 5, the number of iterations is the least.
Impact of the number of reproductions on AS-BFO using S3. (a) Correspondence between the reproduction number and path length. (b) Correspondence between the reproduction number and number of iterations.

4.1.4. Elimination–dispersal number
The elimination–dispersal operator is designed to improve global optimisation and maintain the diversity of solutions. As the outermost nesting of the algorithm, the elimination–dispersal number directly affects the algorithm running time. In the simulation experiment, P = 50, N c = 5 and N re = 2 are fixed, and reproduction number varies as N ed = 1, 2, 3, 4 and 5. The results are shown in Figure 9. For environment 1, when N ed = 3, the path is the shortest. When N ed = 5, the number of iterations is the least. For environment 2, when N ed = 4, the path is the shortest. When N ed = 4, the number of iterations is the least.
Impact of the number of elimination–dispersals on AS-BFO using S3. (a) Correspondence between the number of elimination–dispersals and path length. (b) Correspondence between the number of elimination–dispersals and number of iterations.

4.2. Parameter sensitivity analysis
As demonstrated above, different values of parameters lead to completely different results. The most influential parameters are identified by sensitivity analysis (SA), as well as to understand their impact on the model output. For this reason, the Morris method (Cadero et al., Reference Cadéro, Aubry, Brun, Dourmad, Salaĺźn and Garcia-Launay2018) is applied to develop the parameter sensitivity analysis. Briefly, the Morris method involves the generation of uncertain parameter samples via a trajectory-based sampling process. The method calculates and evaluates the standard deviation σi of the elementary effects μi, where i is the ith date sample, over r repetitions to assess the factors' importance. A high value of μi indicates a high linear effect for a given factor, while a high value of σi represents either nonlinear or non-additive factor behaviour. The importance of input factors of the model can often be assessed by plotting the factors ( $\mu^{*}, \; \sigma$), where μ* is the mean of μi in two-dimensional space. The factors closest to the origin are less influential.
There are four uncertain parameters, population number P, chemotaxis number N c, reproduction number N re and elimination–dispersal number N ed, involved in the proposed model. Table 1 shows the sampling ranges of each parameter during the sampling processes of the Morris method. In this experiment, the Morris method runs a model with five factors along four trajectories, and a total of 20 samples have been extracted, as listed in Table 2. Each generated data sample is applied as the input to the proposed method 10 times to get an average optimal path length, which is listed in Table 3. According to the Morris method, the corresponding standard deviation σ and its elementary effects μ for each trajectory can be calculated, which is shown in Figure 10. Figure 10 shows the sensitivity of each parameter in the environmental map of different sizes. In addition, the ( $\mu^*, \; \sigma$) is also plotted in a two-dimensional plot, illustrated in Figure 11, for parameter importance analysis. It is clear that parameter 3 (N re) and parameter 4 (N ed) are away from the origin, which indicates that those parameters are the most important.
Sampling range of each parameter.

Extracted samples.

Average optimal path of 20 data samples.

The results of the Morris method.

Screening of input factors based on the Morris method.

4.3. Algorithm comparison
The performance of the proposed method is evaluated and validated in this section. In general, GA and ACO are adopted to compare against the proposed AS-BFO. Likewise, we first obtain the relative optimal parameters of ACO and GA through repeated experiments in the S3 environment, and then apply the parameters to other environments. In order to evaluate the performance of each method under different environments, the simulated environments, described in Figure 6, are grid partitioned into five different size, denoted as: S1, 10 × 10; S2, 15 × 15; S3, 20 × 20; S4, 25 × 25; and S5, 30 × 30. Each size is considered as an individual scenario. In each environment, the ratio of the obstacle area to the entire map area is approximately equal. The experimental results of three approaches under five different sizes are listed in Table 4. Figure 12 shows the relative optimal paths of the two environments in the five size maps.
Performance comparison of various optimisation methods.

Note: AIN, average iteration number; MaxPL, maximum path length; MinPL, minimum path length; APL, average path length. There are five map sizes used in each of the two environments: S1, 10 × 10; S2, 15 × 15; S3, 20 × 20; S4, 25 × 25; and S5, 30 × 30.
Relative optimal path of two environments in five sizes.

From Table 4, we can see that the AS-BFO has a better average path length using a very small iteration number. Moreover, the maximum path length obtained by AS-BFO is less than ACO and GA in the 20 repeated experiments. In S1, S2 and S3, AS-BFO's AIN has a great advantage. However, the advantages in MaxPL, MinPL and APL are not obvious. In S4, the advantage of AS-BFO's AIN is still obvious. It is worth noting that AS-BFO's MaxPL is 24·39 (32·04) smaller than ACO and 6·83 (5·07) smaller than GA. AS-BFO's MinPL is 6 (14·49) smaller than ACO and 1·76 (0·59) smaller than GA. In S5, the advantages of MinPL's AIN are equally obvious. AS-BFO's MaxPL is 76·67 (53·01) smaller than ACO and 17·66 (12) smaller than GA. The MinPL of AS-BFO is 40·39 (57·93) smaller than ACO and 3·76 (2·58) smaller than GA. Analysis shows that the larger the map size L, the greater the advantage of AS-BFO. Therefore, AS-BFO is superior to GA and ACO in searching efficiency and obtaining an optimal solution.
5. CONCLUSIONS
This paper proposes a more efficient path planning method based on the AS-BFO algorithm. The effects of bacteria number, chemotaxis number, reproduction number and elimination–dispersal number on the global path planning are analysed. Through experimental analysis, bacteria number is inversely proportional to the path length. The greater the chemotaxis number, the stronger is the local optimisation ability of the algorithm. Correspondingly, the path length and iteration number will decrease. However, the greater the reproduction number, the smaller the diversity of the population and the faster the convergence of the algorithm. The experiments indicate that the increase of elimination–dispersal number will decrease both the path length and iteration number within a certain range. It can be found from the comparison of algorithms that AS-BFO performs better than comparative algorithms in terms of average iteration number, average path, maximum path and minimum path. A parameter sensitivity analysis shows that the effects between the various parameters and the effect of each parameter on the output are different in different environmental maps.
COMPETING INTERESTS
The authors declare that there are no conflicts of interest regarding the publication of this paper.
ACKNOWLEDGEMENT
We would like to express our sincere thanks to Wuhan University of Technology (WHUT) for supporting our work.



