Introduction
Genotypic differences for production and meat or eating quality traits have been reported for pig populations evaluated in the United States (Johnson and Goodwin, Reference Johnson and Goodwin1995), the United Kingdom (MLC, 1989) and through a range of end-product comparison tests, particularly in European Union countries. No sire breed comparisons have been published in Australia, where private companies operate most pig breeding programmes. Further, few individual breeders have adequate resources to enable accurate comparisons between progeny groups sired by boars from different breeds, particularly for carcase traits. As a consequence, Australian pig breeders have limited knowledge as to the relative merit of individual sires or sire breeds, for meat and eating quality traits in particular. Correspondingly, commercial producers have little opportunity to exert an informed choice of sire selection to improve carcase yield or meat quality, even at the between-‘breed’ level. The primary objective of this study was to quantify differences in carcase, meat and eating quality traits for some sire breeds available to commercial producers in Australia.
Material and methods
Generation of slaughter progeny
Planned matings in a commercial herd were used to generate slaughter progeny representing four sire breed groups, accommodating a secondary objective to obtain comparisons between individual sires for meat and eating quality traits. Thus, differences between progeny groups reflected additive effects (0.5 breed differences), differential heterosis, along with the sampling of sires. Commercial composite (LW/LR) females at QAF Meat Industries Pty Ltd (QAF) Balpool operation were artificially inseminated (AI) using nine Duroc (DU), 15 Landrace (LR), 17 Large White (LW) and 10 Duroc synthetic (DS) sires over a 6-week period, resulting in 157 litters that were farrowed in April/May 2004. Litters in each week represented every sire breed group but not every sire. Sires from three groups (DU, LR and LW) were commercially available for AI and came from several Australian breeding companies. Duroc synthetic (DS) sires originating only from QAF were used across mating weeks, facilitating improved comparisons between other sires mated in different weeks.
All resulting project animals were identified to litter at birth and earmarked accordingly. Management until weaning age was commercially orientated, and included cross-fostering of project piglets both within and outside sows bearing project litters. Progeny were weaned twice weekly to form 6 weekly batches transferred into separate sex eco-shelters, and grown out in large (∼400 pigs, including non-project animals) commercial eco-shelters within week-constant groups until their slaughter at 22 weeks of age. No sorting of project progeny occurred prior to their slaughter, although heavy non-project males and females were removed from eco-shelters approximately 2 weeks prior to the slaughter of project animals. Project animals were slaughtered weekly on six Mondays at the QAF abattoir.
Data collection for meat quality traits
Carcase weights and back-fat depth were recorded, where possible, on all project animals. However, in order to achieve meaningful information for project sires, and given a restricted capacity to record meat quality traits, only a sub-sample of animals were individually recorded for meat and eating quality traits. These progeny were chosen to evaluate 40 out of the 51 sires (target: 16 progeny/sire), and were sampled from litters to balance sex within sire, where possible. Sires evaluated for meat quality traits were selected solely on the basis of their projected progeny numbers at slaughter. The carcase, meat and eating quality traits recorded for this project were as follows:
1. Hot standard carcase weight (HSCW): head on;
2. Carcase back-fat depth at the P2 site (CBF): all record sources combined (weeks 33 to 38). CBF_1 and CBF_2 are subsets of CBF using on-line data from the Hennessy-Chong only (weeks 33 to 35 and 38) or also including boning room data (week 37);
3. pH (pH) ∼24 h after slaughter;
4. Colour (COL): L* value of the Minolta chromameter;
5. Cooking loss percentage (CL): average of two loin chops per pig. CL_1 and CL_2 are cooking loss percentages for each chop separately;
6. Intramuscular fat content using NIR analysis (IMF): average of two replicates;
7. Shear force (SF): average of three replicates × two chops per pig. SF_1 and SF_2 are shear force values averaged for each chop separately;
8. Fat percentage of the belly (BELE): from image analysis, predicted using the equation of Shaw et al. (Reference Shaw, Rossetto and Grigg2003);
9. Fat percentage of the belly (BELA): from image analysis, using total fat area relative to the total area of the anterior surface;
10. Lean streak percentage of the belly (LSP): from image analysis, using streak area relative to the total area of the anterior surface. Streak area predominantly contained cut surfaces of the m. latissumus dorsi, the m. pectorales profundi and, to a lesser extent, the m. cutaneous trunci;
11. Lean and bone percentage of the belly (LBP): from image analysis, using total meat + bone area relative to the total area of the anterior surface. Additional meat surface areas in this image included the m. serratus ventralis, m. intercostales integrum and the m. transversus thoracis.
A technical problem with the Hennessy-Chong equipment in the abattoir reduced the total number of fat measurements recorded on-line. For some animals, this situation was partially rectified by measuring fat depth with a ruler as close to the P2 site as possible on animals sampled for the boning room. In addition, belly images were later re-processed, also to measure fat depth as close to the P2 site as possible from the images available. Consequently, some data were available from these weeks, and only some progeny of some sires were affected by changes in measurement procedures for carcase P2. The trait CBF combined information from these three record sources.
Colour, pH, IMF content, cooking loss and shear force were measured using samples from the m. longissimus dorsi. Colour and pH were measured in the boning room at the QAF abattoirs, approximately 24 h after slaughter. Equipment was calibrated daily, preceding data collection. Colour and pH were measured using the anterior sliced surface of the loin, allowed to ‘bloom’ prior to measurement of colour. After recording for these traits, two chops of approximately equal thickness were sliced from each loin and packaged for later processing (CL was recorded 48 h post slaughter), along with an additional sample for testing IMF.
On the following day, chops were cooked at the QAF laboratory to a constant internal temperature (70°C) using a George Foreman® Health Grill set (George Foreman®; Failsworth, Manchester, England) on ‘high’ (see McKenna et al., Reference McKenna, King and Savell2003). Internal meat temperatures were monitored using a digital thermometer. Weights taken before and on the completion of cooking were used to establish cooking loss for each chop. After cooking, both chops were cooled and packed for transport to the Department of Primary Industries (DPI), Werribee, Australia. Shear force was measured at Werribee using a Lloyd Texture Analyser TA Plus (Lloyd Instruments Ltd, Fareham Hampshire, UK) fitted with a Warner Bratzler shear force blade. The machine operated under compression at a crosshead speed of 300 mm/min. IMF levels were measured at the QAF feed laboratory using near-infrared spectroscopy (NIR), validated using Soxhlet Extraction (Foster and Gonzales, Reference Foster and Gonzales1992) on random sub-samples throughout the project period.
Belly images were captured using a digital camera in the boning room. Photographs of bellies were taken by mounting the belly on a rig with a declining plane, angled 30° to the horizontal. The camera was focussed at the middle of the anterior face of the belly. Belly images were later processed using ImageProPlus™ v. 4.1 (Statsoft; Tulsa, OK, USA), largely as described in Hermesch et al. (Reference Hermesch, O’Shea and Grigg2004), and using the equation of Shaw et al. (Reference Shaw, Rossetto and Grigg2003) to predict BELE. However, the additional recording of the total area of the anterior surface of the belly enabled further belly traits to be defined: BELA, LSP and LBP, as described above.
Statistical analyses
Only records for project animals slaughtered between 148 and 162 days of age were used for analyses. In addition, for each trait, values deviating from the mean by more than three times the interquartile range were deleted. After this editing, carcase records from 1169 animals remained, with 686 animals (121 DU; 191 LR; 203 LW; 171 DS) recorded for the meat and eating quality traits.
Significant (P < 0.05) systematic effects were identified using PROC MIXED (SAS Institute Inc., 1999). Factors considered included kill date (6 levels), sex (2 levels) and their interaction (6 × 2 levels), along with sire breed group (4 levels). Carcase weight was fitted as a linear covariate for CBF, BELE, BELA, LBP and IMF while average raw chop weight was a linear covariate for CL and SF. Age at slaughter was fitted only for HSCW, BELA and LBP. For comparison, analyses were performed without fitting sire, or fitting sire (nested within sire breed) as either a fixed or random term. Bonferroni adjustments to P values were performed to accommodate multiple comparisons between least squares means (LSM) for sire breed groups.
The predicted progeny performance of individual sires for carcase back fat, including or excluding data obtained using alternative measurement techniques, was used to assess whether data derived from alternative measurement techniques substantially altered sire rankings. However, it is important to note that deleting data for CBF from weeks 36 and 37 reduced sire linkage across weeks, which would also impact sire rankings for CBF.
Results and discussion
Characteristics of the data
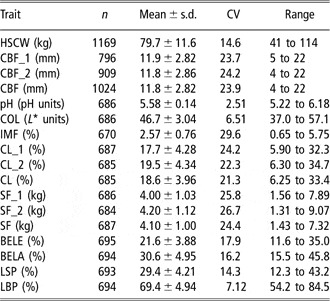
Characteristics of the data after editing for outliers are presented in Table 1. Hot carcase weights were slightly higher than Australian industry averages (Pigstats, 2002) reflecting higher than average live weights at slaughter. Weekly averages for live weight ranged from 89 to 105 kg (at 155 days), partially reflecting changes in disease challenge during this time. Live weight gain and slaughter weights were higher for females than males. This phenomenon has been observed by QAF Meat Industries previously using large eco-shelter rearing systems, and is generally attributed to increased activity of males towards the end of the finisher period.
Data characteristics after editing

1Trait definitions and abbreviations listed in text.
Coefficients of variation (CV) were very low for pH, colour and LBP and moderate for the remaining traits. A CV of 14.6% for HSCW was slightly lower than expected, particularly given the lack of sorting based on weight prior to slaughter. However, the CV for HSCW was only slightly higher (15%) prior to editing the raw data for age limits and outliers. The relatively low (i.e. <20%) CV for this trait could have reflected the consistency with which animals were treated throughout the project, minimising variation introduced by different environmental factors (e.g. management and production systems). Reduced variation between animals when rearing is conducted with large group sizes has also been reported elsewhere (O’Connell, Reference O’Connell2005). All trait distributions were approximately normal and were consequently analysed on their observed scales.
Systematic effects
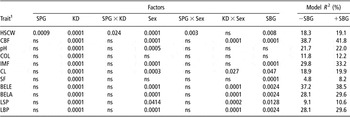
Significant systematic effects for traits analysed, including interaction terms, are presented in Table 2. Results are not presented separately for trait replicates (i.e. CL_1 and CL_2, SF_1 and SF_2) as results for values averaged across replicates (i.e. CL and SF) are the most informative. Similarly, results for CBF are considered more informative than results from CBF_1 or CBF_2.
P values for significant systematic effects (sire breed group, SBG) along with the model coefficient of determination−R 2 (− without SBG; + with SBG in the model)

1Trait definitions and abbreviations listed in text; SPG: sow parity group (3 levels: 1: parity 1; 2: parities 2 to 4; 3: parities 5 to 9); KD: kill date (6 levels); Sex (2 levels: M or F); SBG: sire breed group (4 levels: Duroc, Large White, Landrace, Duroc Synthetic).
Kill date, which encompassed rearing group, transport, slaughter and abattoir conditions common to animals slaughtered on that date, was very highly (P < 0.0001) significant for all traits. Kill date (KD) alone accounted for between 3.5% (SF) and 27% (IMF) of the variation in production and meat quality traits, explaining between 5% and 12% of the observed variation for the majority of traits. The high percentage of variation in IMF explained by slaughter date likely has more to do with weekly variation in health status than slaughter day effects per se at the abattoir.
Sow parity group significantly (P < 0.05) affected slaughter weight, although the magnitude of effect varied with progeny sex and kill date. Sow parity was not a significant factor affecting carcase composition (e.g. CBF) or meat quality traits. Sex significantly affected carcase weights and P2 measurements, as well as pH, IMF and CL. Sex of the slaughter animal was not significant for colour or shear force. Generally, females had heavier carcase weights, higher CBF and IMF, along with lower pH and cooking loss than males. However, significant sex × kill date interactions were also present for some of these traits. Further, each sex was reared separately. Thus, sex effects might combine true sex as well as shed-related (including health) effects. Significant differences existed between sire breed progeny groups for all traits, excluding pH and COL.
Linear covariates included age at slaughter for HSCW, BELA and LBP; HSCW for carcase fat (CBF), IMF percentage (IMF) and belly traits (BELE, BELA, LSP, LBP); and average raw chop weight for CL and SF, which contributed to the reported model R 2 values (Table 2). Increasing age at slaughter (between 148 to 162 days of age) increased HSCW by approximately 1 kg/day. Higher carcase weights were associated with increased carcase fat (0.123 mm CBF per kg HSCW) and IMF levels, while higher CBF was associated with darker meat, higher pH and higher shear force values. Larger chops had a lower percentage cooking loss.
Overall, identifiable systematic effects accounted for substantial variation in CBF (R 2: 41.8%) and IMF (R 2: 33.2%), and to a lesser extent variation in HSCW, pH and CL (R 2: ∼20%) (Table 2). However, relatively little of the observed variation (∼10%) in COL or SF was associated with known factors. Further, the difference resulting from sire breed accounted for only 0.3% (pH) to 3.4% (SF) of observed variation, whereas differences between sires generally contributed significantly more towards improvements in the model R 2 (results not shown). This indicates generally that variation within sire breed is relatively large compared to the observed differences between sire breeds.
Sire breed effects on meat and eating quality traits
Carcase traits
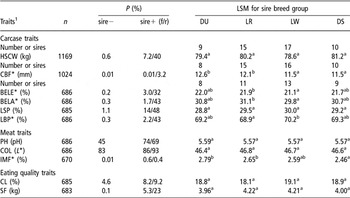
Significant differences between sire breed groups were evident for all carcase traits under models where sire was not accounted for: sire breed differences were not significant for HSCW and LSP after accounting for sire as a fixed effect (Table 3). At the same age, progeny of DS sires had heavier lean carcases, those of LW sires had lighter lean carcases, while progeny of DU and LR sires had intermediate HSCW but were significantly fatter. Fat and lean content of the belly did not mirror differences in carcase yield, as characterised by HSCW and CBF. Progeny of DS sires, with lower CBF, had a similar percentage of belly fat when compared to progeny of DU and LR sires with higher CBF. An inconsistency in ranking for back and belly fat was also reported by Baulain and Henne (Reference Baulain and Henne1999) from dam lines. Progeny of LW sires had the leanest bellies and the highest LBP. Results comparing DU with LW for carcase weight and back fat in this study are consistent with breed contrasts for average daily gain and carcase fat reported in other studies (Johnson and Goodwin, Reference Johnson and Goodwin1995; Blanchard et al., Reference Blanchard, Warkup, Ellis, Willis and Avery1999c). There was no comparable literature available for progeny of LR or DS sires.
The number of siresFootnote A with progeny recorded and the significance of sire breed group after excluding (sire−) or accounting for sire (sire+: fitted as fixed (f)/random(r)) in the model, along with least squares meansB (LSM) by sire breed group (DU: Duroc; LR: Landrace; LW: Large White; DS: Duroc synthetic)

1 Trait definitions and abbreviations listed in text
A refers to following trait(s)
B values within rows with different superscripts are significantly (P < 0.05) different after a Bonferroni adjustment to P values (sire + f model); *adjusted to a constant carcase weight.
Meat and eating quality traits
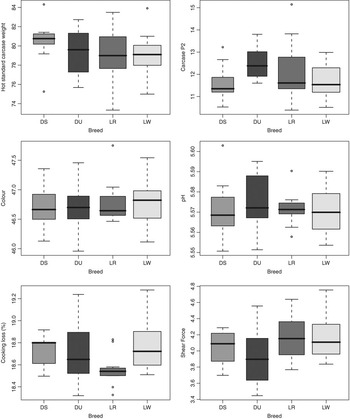
Significant differences between LSM for sire breed groups were absent for pH and COL (Table 3), although differences between sires’ progeny groups (within sire breed group) were evident for these traits (Figure 1). This outcome is consistent with results from Johnson and Goodwin (Reference Johnson and Goodwin1995). Least squares means for IMF generally followed the same trend as LSM for CBF, with leaner animals having a correspondingly lower IMF. Thus, high Duroc content did not promote higher IMF levels in the leaner DS-sired progeny. Cooking loss for progeny of DU sires was highly variable, thereby not differing significantly from progeny of other sire breed groups. Cooking loss was elevated in progeny of LW sires, compared with progeny groups sired by LR or DS boars (P = 0.046: sire-model). Ultimately, meat from DU progeny was more tender (lower SF) than meat from LW- or LR-sired animals. The lower IMF and relatively higher CL of meat from progeny of DS sires were not accompanied by increased toughness, possibly due to the higher growth rates (Blanchard et al., Reference Blanchard, Ellis, Warkup, Hardy, Chadwick and Deans1999a) of DS-sired animals. However, differences in CL and SF were no longer significant in models accounting for sire (sire + f model: Table 3).
Box-plot illustrating variation between sires with sire breed group: horizontal lines indicate the median value; each box contains 50% of sires; whiskers extend to a maximum of 1.5 × interquartile region; outliers indicated by a point.


Differences between sires
Where sire breed was significant at the P < 0.05 level, excluding sire as a model term, this level of significance was generally retained after accounting for sire as a fixed effect: exceptions were HSCW, LSP, CL and SF. However, after accounting for sire as a random term in models for analyses, the effect of sire breed was no longer significant for most traits: exceptions were CBF and IMF, with CL approaching (P < 0.10) significance. Thus, with the exception of the fat-related traits, for which selection has been consistently intense in terminal sire breeds, estimated population differences in sire breed for other traits were less certain. This result partially reflected relatively low sire numbers, but also significant variability between sire progeny groups within the sire breed group, excluding results for CL. This problem makes sire breed selection a less-accurate method for improving meat and eating quality traits of slaughter progeny in the absence of sire-specific information.
Differences between predicted progeny values of sires for each trait are illustrated using box-plots by sire breed in Figure 1. Each ‘box’ contains the middle 50% (2 quartiles) of sires with a horizontal line representing the median value, while each whisker extends to include sires ⩽1.5 times the interquartile distance from the box. Outliers for that breed group are then illustrated with a dot point outside the whiskers. For reference, the number of sires represented in each box-plot by breed and trait was shown in Table 3.
Generally, the box-plots (Figure 1) show that there was considerable overlap between sire breed groups due to variation between progeny of different sires. In most cases, the best sire from the worst breed group for any particular trait was competitive against at least some sires from the best group. However, differences in variability of sires within groups were apparent. For example, while there were similar numbers of sires represented in the LW and LR groups, variability amongst LR sires for HSCW and CBF was greater. This may reflect more diversity of breeding goals amongst breeders supplying LR sires to the project, and/or the sample of sires used in this study. In contrast, relative to all other sire breeds, the LR sires tended to display less variation in colour, pH and cooking loss, but similar variation to other groups in shear force value. Duroc sires showed considerable variation in cooking loss, contributing to their lack of a significant difference from results for other white sire breeds for this trait (Table 3).
Pork quality
Acceptability of fresh pork to consumers was approximately evaluated using results for colour, IMF levels and cooking loss. Acceptable ranges for fresh pork quality were considered to be 40 to 50 for COL, ⩾2.5% for IMF in the first instance and 18% to 24% for CL (Jennings et al., 2005). Minolta L* values >50 would typically, when combined with >5% drip loss, be regarded as pale soft exudative meat (Channon et al., Reference Channon, Pengelly and Warner1997). However, no drip loss data were available from this study.
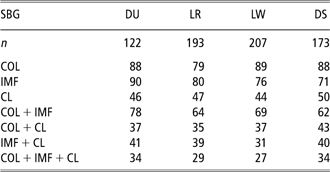
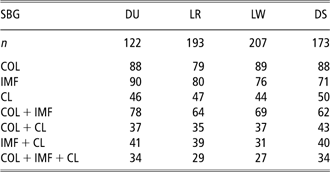
Based on raw data values, animals were allocated into classes for each criterion above representing acceptable v. unacceptable quality (1/0). Raw data were considered adequate for this purpose since progeny from all sire breeds were represented in each week’s data. For classification based on these criteria, 3.6% of loins would be completely unacceptable; 27.8% were acceptable in quality for a single trait only (mostly COL); 46.5% were acceptable in quality for two traits (mostly COL and IMF); and 22.1% had acceptable pork quality based on all three traits (pre- and post-cooking performance) (Table 4).
The number of records (n) and percentage of loins within sire breed group (SBG) within acceptable* ranges for fresh pork products for meat and eating quality traits1 (*US values, Jennings et al., 2005)
1Trait definitions and abbreviations listed in text.
At purchase, consumers are influenced by meat colour. In these data, 85.6% of loins had acceptable colour, but only 47.6% or 67.6% of all loins would be considered acceptable for both COL and IMF, where IMF > 2.5% or IMF >2%, respectively. Consumers would probably differentiate the suitability of chops for purchase based on visible marbling, such that both COL and IMF both influence the decision to purchase or otherwise. Approximately 45% of loin chops that were acceptable for both colour and IMF experienced levels of cooking loss outside the optimum range of 18% to 24%. This would likely have implications for juiciness and palatability, and ultimately the eating experience.
Progeny of LR sires showed a lower percentage of loins within the optimum colour range, while similar percentages were evident for other sire breeds (Table 4). This was not reflected by a significant difference between sire breeds in COL. The percentage of progeny acceptable for IMF generally mirrored differences in CBF, although the percentage of DU with >2% IMF was substantially higher than for the other sire breeds. Cooking loss was less acceptable for progeny of LW sires, supporting the significant difference for CL shown in Table 3. Overall, the percentage acceptability based on all of these parameters (i.e. after cooking) was only slightly higher for Duroc-sired animals. However, improved tenderness of Duroc chops (see Table 3), which is not accounted for in this procedure for determining acceptability, should also have an impact on consumer acceptability.
Different optimum ranges may be applicable for different processors and markets, and will influence interpretation of the results obtained. For example, US markets tend to slaughter animals at higher weights and fat levels, which may increase the minimum observed levels for IMF and reduce the maximum levels for CL (due to larger chop size). Consequently, defining similar optimum values for these measures in the Australian market, characterised by lower slaughter weights and fat levels, may generate different ranges for objective assessment of meat quality. Alternative ranges to define pork quality were difficult to implement due to missing measurements (e.g. drip loss percentage) and/or differences in the time post slaughter that measurements were taken.
It is also important to note that, due to the sampling strategy employed, data from this study included some animals that would not normally enter the boning room for further processing into fresh pork products. Other factors that were not assessed, such as purge and chop size, taste, odour and palatability, may also influence acceptability to processors and consumers.
Results from other studies
The National Genetic Evaluation Program (NGEP: Johnson and Goodwin, Reference Johnson and Goodwin1995) compared progeny from 3261 slaughter pigs representing nine sire lines: Berkshire; Duroc; Spotted; Yorkshire; Hampshire; and four company lines: Danbred HD; NGT Large White; Nebraska SPF Duroc and a Newsham Hybrid. Similar to the results presented here, progeny from Duroc-based sire lines had the best growth performance but less-acceptable carcase fat compared with other company lines (e.g. Danbred HD and Newsham Hybrid), although the latter could also have contained Duroc ancestry. Only Hampshire-sired progeny differed significantly from other sire lines in meat colour (Minolta L*), consistent with the lack of a significant difference evident from this study. Similarly, progeny of Duroc and Nebraska SPF Duroc, NGT Large White and Yorkshire did not significantly differ in ultimate pH, as was the case in this study for pH measured at 24 h. Significant differences were more evident between sire lines for IMF, cooking loss and tenderness. Duroc-based sire lines had higher IMF, combined with reduced cooking loss and significantly better tenderness than LW or Yorkshire pigs in the NGEP. Thus, results from the NGEP study were very similar to that observed here, despite the fact that NGEP pigs were substantially heavier (∼115 kg) and fatter (>25 mm) at slaughter. Landrace sire lines were not included in the NGEP study (Johnson and Goodwin, Reference Johnson and Goodwin1995).
The Stotfold trial report (MLC, 1989) compared production and meat quality characteristics of Meat Type and White sires using progeny from 347 litters representing four breeding companies: Cotswold; Masterbreeders; NPDC and PIC. Meat-type (MT) sires were described as containing infusions of ‘muscular European and North American breeds’ while White (W) sires included both Large White or Landrace sires. Each company provided boars representing both sire types along with their own hybrid gilts, making this trial more closely represent a product comparison trial. In the Stotfold trial, the relative performance of the two sire groups differed according to company. Further, differences between companies were larger than differences between the two sire types for most of the traits measured. This probably reflects the contribution from each company’s females to the commercial end products, along with company differences in breeding goals and the sample of sires used, which is a useful point to bear in mind when interpreting results from the current study. That is, in our study DU, LW and LR sire breeds represented several breeding companies with potentially diverse breeding goals.
Overall, the Stotfold trial (MLC, 1989) demonstrated that the cost of producing a kg of lean was higher for White- v. Meat-type sires, more so in the worst- compared to the best-ranking company for this trait. Progeny sired by Meat-type sires tended to have slightly higher drip loss than the White-type-sired progeny, but this was not consistent across companies. IMF levels did not differ between sire types. A trained taste panel indicated meat from progeny of Meat-type sires was more tender, but there were no significant differences in juiciness, flavour or odour. Further, consumer panels did not detect a significant difference between progeny of White and Meat-type sires for any eating quality traits.
In a later trial at Stotfold, 721 slaughter pigs were used to evaluate the influence of growth rate, sex and the proportion of Duroc genes on pork eating quality (Blanchard et al., Reference Blanchard, Ellis, Warkup, Hardy, Chadwick and Deans1999a, Reference Blanchard, Ellis, Warkup, Chadwick and Willis1999b and Reference Blanchard, Warkup, Ellis, Willis and Avery1999c). In their study, rapid growth prior to slaughter was favourably associated with many sensory characteristics of pork, but relationships were generally weak (Blanchard et al., Reference Blanchard, Ellis, Warkup, Hardy, Chadwick and Deans1999a). Correspondingly, faster growing boars produced more tender loin chops according to sensory panel testing. However, there was no significant sex difference in overall acceptability (Blanchard et al., Reference Blanchard, Ellis, Warkup, Chadwick and Willis1999b), suggesting other factors were also important. In our study, meat from the faster growing females was no tenderer than meat from their male contemporaries, although females did have higher IMF and reduced CL. The study of Blanchard et al. (Reference Blanchard, Warkup, Ellis, Willis and Avery1999c) also demonstrated that progeny of purebred Duroc sires had higher IMF levels and improved eating quality, but carcases were fatter, similar to the results found in this study. Slaughter progeny containing only 25% Duroc genes had IMF levels, marbling scores and subcutaneous fat levels more similar to progeny of LW (0% Duroc) than DU (50% Duroc) boars, implying that a 50% Duroc inclusion is required to obtain demonstrable differences between Duroc-infused sire breeds in meat and eating quality traits. However, it is also possible that this result simply reflected differences amongst the female breeding stock purchased for the study.
D’Souza and Mullan (Reference D’Souza and Mullan2003) reported on eating quality characteristics of 60 male pigs (entire, surgically or immuno-castrated) representing two genotypes (A: lean v. B: fat), whereby genotype A had a higher percentage of Duroc ancestry. Progeny of genotype A sires were leaner at slaughter but had higher IMF%. Genotype A animals also had significantly lower ultimate pH values and higher drip loss than Genotype B animals, along with some changes in meat colour (a* and b* values) but not meat lightness (L* value). However, since slaughter weight was fixed and average daily gain was lower in genotype A pigs, these pigs were also older at slaughter (D’Souza, personal communication, 2004). Their study also showed that leaner carcases of entire males were accompanied by drier and tougher pork, with lower acceptability to a consumer taste panel. This observation is supported in our study by the lower IMF% and higher cooking losses for males. Overall acceptability of meat to consumers in the study of D’Souza and Mullan (Reference D’Souza and Mullan2003) was influenced by a combination of genotype and castration method. For entire males and surgical castrates, overall acceptability of meat from genotype A was higher.
Litten et al. (Reference Litten, Corson, Hall and Clarke2004) reported differences in growth performance (n = 200 test pigs) and eating quality (n = 80) as assessed by a trained taste panel for pigs from different maternal and/or paternal lines (Cotswold Pig Development Company). Significant subjective eating quality differences were not supported by significant differences in objective IMF% or pH. However, tenderness was not recorded and the number of slaughter pigs evaluated for meat quality traits was low.
None of the above studies illustrated variability between sires in the performance of their progeny for belly, meat or eating quality traits.
Conclusions
This project has shown significant differences between slaughter progeny for production and some meat and eating quality traits resulting from sire breed. Progeny of purebred Duroc sires had higher IMF percentage and more tender meat, but more variable levels of cooking loss and less-favourable carcase composition (CBF, belly fat), than progeny representing sires from the alternative breeds. Favourable meat quality characteristics were not as evident in the progeny of Duroc synthetic line sires (with the exception of tenderness), although progeny of these sires were leaner on average than that of sires from other breed groups. While meat pH and colour did not significantly differ between sire breed groups, variation between average progeny performance for individual sires was evident. Such results are generally consistent with those reported for comparable sire breeds studied elsewhere.
Comparisons between sires demonstrated that there was considerable overlap between breeds due to within-breed variation between sires for production and meat or eating quality traits. Thus, while differences between sire breeds exist, it is also possible to identify sires with desirable meat quality characteristics within breeds with less-favourable meat quality characteristics overall. In practice, this would require routine performance testing for meat and eating quality traits to identify superior individuals within breed for these traits. Further, selection for meat quality characteristics (for which no direct payments are currently received) ultimately must be balanced with selection for production traits, which currently dominate returns to pig producers. Overall, significant variability of sire progeny groups within sire breed suggests that sire breed selection, potentially used for improving traits such as meat quality in commercial progeny, will be less accurate in the absence of sire-specific information, which is typically poorly recorded for this class of traits.
Where no information is available on individual sires, this selection can only be exerted through choice of sire breed, which, given the variation within breed, may not be accurate. Where information is available on individual sires, both breeders and commercial producers can exert selection decisions by both breed and sire within breed. However, the utility of such a selection strategy requires (1) that the breeding goal places value on improved meat and/or eating quality; (2) that the value to commercial producers is sufficient to offset the costs of recording and selection at the nucleus level; and (3) that breeders are then paid a premium for breeding stock while achieving genetic gain for this trait group. Selection for improved meat and eating quality traits would require the development of a routine recording system for this trait group. Whether improvements in meat quality are required is difficult to establish without Industry data on how acceptable or unacceptable fresh pork products are to consumers.
Acknowledgements
This project was funded by Australian Pork Limited. The cooperation of NPIP members (Anderlea, Aztec Farms, Belmont, Caminda, Gatton, Yelmah), Wandalup Farm and QAF Meat Industries made this project possible. Special thanks to the technical staff at QAF (Helen Grigg, Trina Adams, Ryan Person, Rob Smits), along with Bruce Trout and Brenden McClelland who operated the AI centres.