

The report and recommendations of the 4th International Conference on Environmental Education (EE; UNESCO/UNEP, 2007) portrayed environmental education as evolving to have greater emphasis on ‘broader social and cultural situated learning processes’ (p. 2) that include wider participation, new learning sites and more engagement with civil society organisations. At more than one point the document calls for nurturing and strengthening advocacy and dialogue skills, and building ‘capacity to engage critically with contemporary (unsustainable) discourses and practices . . .’ (pp. 5 & 9). The document also encourages greater capacity to engage with the effects of power. This advocacy and engagement with discourse and power assists environmental education to play a role in enabling ‘decision makers to make informed and accountable evidence-based decisions in the interests of the public good and the sustainability of life’ (p. 8).
One important discourse that environmental education can engage with is that around the feasibility of having renewable energy systems provide for the majority of a modern economy's energy needs. Government and other decisions have been based predominately on the notion that large-scale reliance on renewable energy systems is not economically or technically feasible. There are significant environmental consequences at stake to decisions founded on this notion. A number of renewable energy technologies, however, have made recent large advances in addressing the cost and intermittency issues that had limited them as viable options for our future. Utility scale solar power stations have already been built. Solar thermal plants with energy storage are able to deliver round-the-clock power (Dunn, Hearps, & Wright, Reference Dunn, Hearps and Wright2012). Evidence from the reports of a number of reputable organisations builds the case for the feasibility and affordability of 100% renewables. Organisations such as the International Energy Agency (IEA), the European Academies Sciences Advisory Council (EASAC) and the Energy Efficiency and Renewable Energy (EERE) division in the US Department of Energy anticipate some renewable energy technologies to be competitive with fossil fuel generation within 10–15 years. Wind power is competitive with fossil fuel generation at some sites already (UNEP, 2011). In Australia, we are on the cusp of solar photovoltaics, without subsidies, achieving ‘grid parity’ with retail electricity prices. Still, to realise the potential of renewable energy at the speed and scale necessary to avoid dangerous climate change, educators are needed to assist in promoting knowledge of, and/or action for, renewable energy options in formal and informal settings.
Some readers may not endorse the advocacy oriented environmental education put forward by the 4th International Conference on Environmental Education (UNESCO/UNEP, 2007). They, like Jickling (Reference Jickling2003), may feel that a balance needs to be found between advocacy and less loaded forms of environmental education. These educators can nevertheless take a role in discourse around large-scale integration of renewable energy systems. They can, as Jickling (Reference Jickling2003) suggests, focus on the ‘acquisition of relevant knowledge to understand (and maybe act on) these matters’ (p. 24) and enable students to question assumptions underlying, and consider alternatives to, current systems and practices.
Formal and informal education complement one another in the progress of renewable energy technologies and their deployment. Civil communicative networks, or social movements, have influenced state and federal government to support renewable power installations. The multifaceted informal education that has been a foundation for the civil sphere's action for renewables is an important form of environmental education. It is valuable for formal environmental educators to recognise the work and importance of the informal environmental education occurring in social movements. Stevenson and Evans (Reference Stevenson and Evans2011) write of the low representation of informal/nonformal education in this journal. Educators in formal institutions may gain insights into their practice and curriculum by conceiving of it as co-extensive with an education that stretches from the civil sphere to governmental policy making institutions.
Environmental education and other disciplines in higher education can inform and develop the discourses of the large-scale transition to renewable energy, particularly in interaction with social movements. Education crosses the boundaries between educational institutions and communities to address important issues of our time (Kemmis, Reference Kemmis2006). Much of the edge of formal education — that is, much of the exploration of new themes that come to make up formal education — is in social movements. Education is the double process of developing the individual and ‘developing the discourses and culture, social relations, institutions and practices, and the material–economic and environmental conditions of a society’ (Kemmis Reference Kemmis2006, p. 462).
Within the social movements that have been important agents in the development of renewable energy, there are multiple (largely informal) educational interactions happening at many scales. The fact that education is already a large element in the dramatic development of renewable energy technologies and their deployment may not, however, be recognised among the actors (Whelan, Reference Whelan2005). Civil actors in movements may come to recognise and develop new opportunities for action by seeing their realm of action in relation to a framework of environmental education. An orientation to education can, for example, promote understanding in a climate action group of some of the steps that members do take and can take to educate one another and others outside the group.
A valuable byproduct of the rapid development of renewable energy technologies and their adoption is hope. Such hope enables engagement with and response to the dire scientifically based forecasts about consequences of climate change. Dire projections about climate change have often led to denial or apathy (Doherty & Clayton, Reference Doherty and Clayton2011; Kefford, Reference Kefford2006). The vision for renewables, with their fast growth and lowering prices and their rapidly approaching (or current) competitive status with fossil fuels, provides the possibility of success and an avenue of action that aids people in absorbing the climate change message without paralysis.
The vision of a society powered 100% by renewables provides a more satisfactory response than many currently accepted targets for emission reduction. At present the target for atmospheric concentrations of greenhouse gases used by the Australian carbon tax is 550 ppm CO2e, even though 450 ppm only gives a 50% chance of keeping temperature increase to below 2 degrees (The Treasury, 2011, p. 14). Moreover, the 2 degree target by no means assures the avoidance of dangerous climate change (Hansen et al., Reference Hansen, Sato, Kharecha, Beerling, Berner, Masson-Delmotte and Zachos2008).
Maintaining knowledge of the rapidly developing renewable energy field is an important environmental literacy. This literacy includes some key messages; for example, that baseload power from renewable energy is possible and that large scale renewable energy systems are affordable and may actually be cheaper than fossil fuel systems. Formal and informal educators can suggest that actors interested in environmental solutions subscribe to or follow the newsletters, reports or updates from organisations such as Beyond Zero Emissions (BZE), Climate Spectator, Renew Economy, the IEA, the US Department of Energy, or many other governmental, non-governmental or even commercial organisations with a renewable energy focus.
Lack of awareness of renewable energy and the reductions in its costs is a barrier to its deployment (IEA, 2011a) and restrains policy makers from taking bold action. Environmental educators can be part of the needed acceleration of the development of renewable energy systems by actively engaging with students and networks to overcome this lack of awareness. The Australian Draft Energy White Paper (RET, 2011), which projects the percentages of renewable energy out to 2050 and is to provide a basis for national policy, uses high estimates of costs for renewable energy, while noting (p. 41) that differences in costs for renewable energy or in government policies can be game changing and ‘. . . could provide a larger transformation than described here’. Environmental education, as suggested by the 4th International Conference on Environmental Education (UNESCO/UNEP, 2007), is partly education of policy makers.
This article was developed, in part, through a review of published information about renewable energy generation and related topics from governmental, international, industry and civic bodies. Information from less established or possibly biased organisations was used as leads to more scholarly material and publications. To the degree practical, reliability of information was confirmed through reference to different credible organisations. The article also drew on the author's involvement as a participant researcher in climate action and environmental advocacy organisations and the related discussions, interactions and collaborations.
There are two main parts to this article. Part 1 presents largely technical information about renewable energy technologies and provides evidence that a large scale transition to renewable energies is possible. This information is important for literacy about renewable energy technologies that will enable environmental educators to enter the discourse on the subject that affects governmental policy and the rate of deployment. Part 2 moves to a much more theoretical (and social/political) angle to assist in understanding the educational dimensions of advocacy networks involved with the development of renewable energy. This provides insights into how educators and civic actors can play a role in the knowledge and interactions underlying the realisation of the possibilities for large scale renewables. Part 2 draws particularly from Habermas's concepts of public spheres and communicative flows.
Part 1: Rapid Development of Renewable Energy Generation Options
There have been very large increases in renewable energy installations in the world, driven largely by drops in prices and by financial incentives provided by governments. These incentives include renewable energy targets, tradeable green certificates and ‘feed in tariffs’ — guaranteed premiums for electricity generated that provide certainty of return on investment (IEA, 2011b). In 2010, approximately half of all new electricity generating capacity added globally was renewable energy (REN21, 2011). Global renewable power generation capacity (excluding hydropower) increased by 24% from 2010 to 2011 (REN21, 2012).
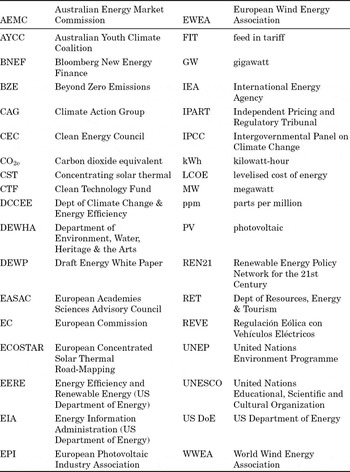
After some brief discussion of some general aspects of renewables and their benefits and costs, this section will highlight points in more detail about three technologies for renewably generating electricity. These three technologies — solar photovoltaics (PV), wind power and concentrating solar thermal — averaged annual growth rates of 25–49% in 2005–2010 (REN21, 2011). While the potential renewable energy that can be accessed through tidal, wave and enhanced geothermal sources in Australia is very large (CEC, 2011), the technologies to harness these are not yet commercial. The technologies summarised here in any detail are only those that have been successfully commercially deployed. (A key of abbreviations is provided in Table 1.)
Key to Abbreviations

Renewable energy is of interest in an environmental education context because of its potential to decrease the triple bottom line impact of electricity generation. Not all renewable energy generation technologies are beneficial; at least not in some contexts. For example, biofuel, because of the common use of food crops in its production, can cause significant increases in food prices and negatively impact poorer populations. Dams associated with hydropower can cause substantial environmental damage and social dislocation. While the renewable technologies discussed in this article — solar photovoltaics, wind and solar thermal — can have larger land use requirements (in utility scale facilities) than conventional generation, their overall impact is much less than fossil fuel generation. Land required for wind farms can still serve other uses. Bird strikes with wind turbines can be reduced with considered siting of wind farms; the overall impact on bird populations is much less with wind generation than with fossil fuel generation (Sovacool, in press). Renewable energy generation avoids damage and risks associated with other generation technologies, such as the land disturbance of coal mining, the risks of radiation leakage with nuclear or the risk of ground water contamination with coal seam gas. Even considering the embodied energy of wind and solar facilities, their greenhouse emissions per unit of electricity is a fraction of that of fossil fuel generation. Renewable energy technologies thus help minimise projected climate change with its large-scale social dislocation and biodiversity and financial (Stern, Reference Sovacool2006) impacts.
Summarising selected elements of the renewable energy situation in brief detail establishes the setting to consider the educational implications of renewable energy developments and to appreciate the dramatic nature of the growth involved. Also, these details constitute a part of the information that could be a focus for environmental education; overviewing them here in this way sets up an organising framework for appreciating the sources and significance of the information. Some environmental educators may be surprised at how some renewables have developed in installation and prices and the credibility of claims that these technologies will be competitive with fossil fuels within 10–15 years.
Investment, Research and Jobs
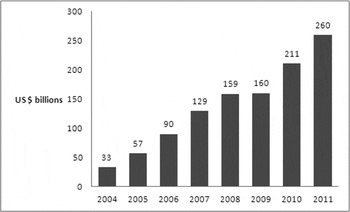
US$260 billion (excluding large hydropower) was invested globally in renewable energy generation in 2011 (Bloomberg New Energy Finance [BNEF], 2012). This $260 billion was more than 2.8 times the $90 billion invested 5 years earlier in 2006 (UNEP, 2011; see Figure 1). Investment is expected to continue to grow strongly (Pernick, Wilder, & Winnie, 2012).

Large investments in research greatly increase the chance of breakthroughs or significant improvements in the performance and cost of renewable energy systems. US$9 billion (UNEP, 2011) was invested in 2010 on research on a range of aspects of renewable energy technologies. There are many promising areas of innovation; for example, new energy storage technologies, higher efficiencies in solar generation, more efficient wind turbine components and cellulosic biofuels (which should avoid competition with food sources). Bill Gates states: ‘I think if you want a leading indicator that you can feel good about, look at the amount of IQ working on energy today . . . Compared to 20 years ago, it's night and day’ (Anderson, Reference Anderson2011).
Investment in renewables has been partly driven by the fact that renewable energy generation has greater job generating potential than fossil fuel technologies (IPCC, Reference Madruga, Edenhofer and Sokona2011). More than 600,000 direct and indirect jobs were provided globally by solar PV and wind power in 2008 and more than 2.7 million are expected to be generated by 2018 (Makower, Pernick, & Wilder, Reference Makower, Pernick and Wilder2009). Solar PV and wind power jobs numbered 980,000 at the end of 2010 (REN21, 2011).
General Points About Costs
As the viability of renewable energy projects generally still relies on incentives, rates of installations can be greatly influenced by government policies. For example, cutbacks of incentives in Europe may well reduce solar installations in Europe after 2011, and some strong federal incentives of recent years in the United States have now been reduced (BNEF, 2012). As costs for renewable energy drop, however, incentives can be scaled back and the growth in installations becomes less and less dependent on policy supports.
The cost of new renewable energy installations has dropped markedly in recent years, which has been a major driver of the growth in installations and investments. These dropping costs have been due to a combination of factors, including technical advances, economies of scale, increased competition, less expensive financing as perceived risk is reduced, and ‘learning by doing’ (EIA, 2010; IEA, Reference Philibert2011c). The rate at which costs reduce with deployment is referred to as the ‘learning rate’, that is ‘the percentage reduction in costs for each doubling of installed capacity’ (EASAC, 2011, p. 23).
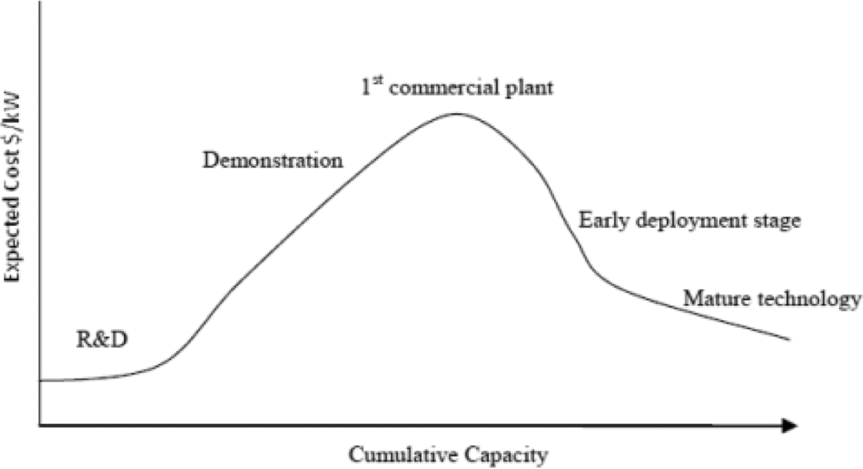
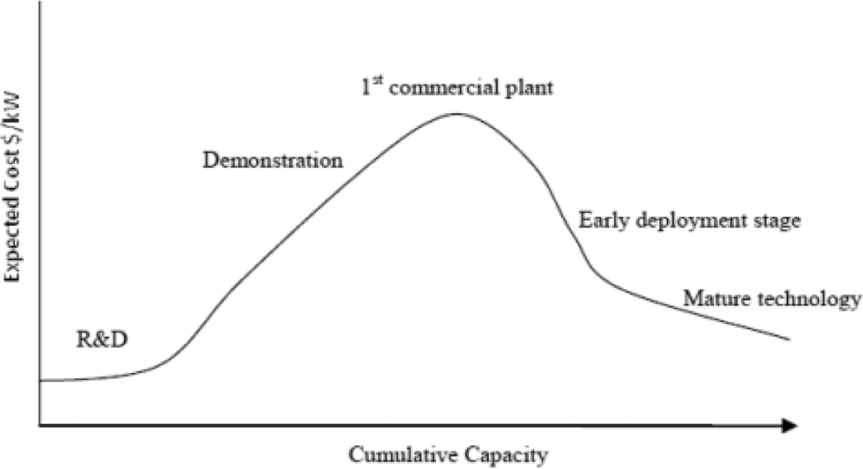
Less established technologies tend to have higher ‘learning rates’ as there is more potential for improvements. Technologies are understood to move along a ‘cost curve’ (see Figure 2) as they develop from research to demonstration to initial commercialisation to mature technologies (Hayward, Graham, & Campbell, Reference Hayward, Graham and Campbell2011; RET, 2011). Solar generation technologies, and renewable energy technologies generally, have further to drop along the cost curve than conventional fossil fuel generation technologies.
Technology progression with change in cost with increasing cumulative capacity. Note: Sourced from Hayward et al., Reference Hayward, Graham and Campbell2011, p. 11; used with permission.
A way of comparing the cost competitiveness of different generation technologies is the ‘levelised cost of electricity’ (LCOE) — ‘the wholesale price at which a power plant needs to sell its electricity to break even over the life of the plant’ (BZE, Reference Wright and Hearps2010, p. 54). While LCOE provides a measure that allows comparisons between different technologies of generation, such comparisons need to be treated with caution (and assumptions made transparent if practicable) as LCOE can be quite sensitive to the assumptions used (Branker, Pathak, & Pearce, Reference Branker, Pathak and Pearce2011; CSIRO, 2011). Still, LCOE can be a valuable indicator as to the cost competitiveness of different technologies.
Solar Photovoltaic
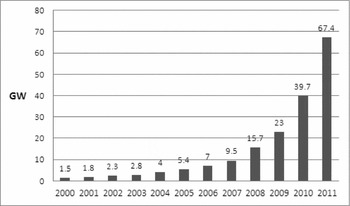
In solar photovoltaic (PV) systems, electricity is generated by sunlight striking a thin cell of light sensitive semiconductor material such as silicon (IPCC, Reference Madruga, Edenhofer and Sokona2011). The average annual growth rate of installed solar PV capacity was more than 40% from 2000 to 2010 (IEA, 2010a; Branker et al., Reference Branker, Pathak and Pearce2011). As Figure 3 shows, in 2011 the installed world capacity of grid-connected solar PV increased by almost 70%, from 39.7 gigawatts (GW) to 67.4 GW (EPIA, 2012). The 27.7 GW installed in 2011 was substantially more than the cumulative total that had been installed in all years to the end of 2009 (REN21, 2011). Clearly, installations in solar PV have been accelerating, due in part to significant drops in prices that will be discussed below.
Global grid-connected solar PV capacity. Note: Adapted from EPIA (2012, p. 5).

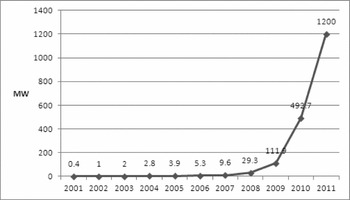
Cumulative PV installations in Australia more than doubled during 2011 (EPIA, 2012), rising from 493 MW to 1200 MW. This cumulative capacity generates electricity equivalent to the consumption of over 220,000 households. As Figure 4 shows, installed capacity in Australia at the end of 2011 was approximately 3,000 times that of 10 years earlier.

Solar PV has a learning rate of about 20% (IPCC, Reference Madruga, Edenhofer and Sokona2011, p. 848). That is, for every doubling of capacity, prices have dropped approximately 20%. Prices for PV modules ‘dropped from USD2005 22/W in 1980 to less than USD2005 1.50/W in 2010’ (IPCC, Reference Madruga, Edenhofer and Sokona2011, p. 68). The rate of decrease has been particularly rapid in the last few years, with PV ‘system’ prices (which includes the ‘balance of system’ such as inverter and installation) falling 40% between 2008 and 2009 (IEA, 2010a) and further dramatic declines through 2011 (BNEF, 2011a, 2012).
Feed-in tariffs (FITs) have been particularly effective in promoting the rate of solar PV installations, which has been so important to the above price reductions; ‘Nearly all countries with growing [solar PV] markets have used FITs’ (IEA, 2011b, p. 20). In Australia, state FITs were key drivers of the 35 times increase in solar PV installations from 2008 to August 2011 noted by the Clean Energy Council (CEC, 2011). These Australian state-based FITs have been significantly wound back as PV prices have fallen and the costs of the schemes have become a politically sensitive issue in the context of rising energy prices. The lowering (or eliminating) of FITs may cause the rate of installations to plateau for a time. Also, price reductions for solar PV systems in Australia may not continue at the rate of the last few years, as reductions have reflected, to a degree, a global surplus in supply of PV modules (UNEP, 2011) and the possibly short-term factor of the high Australian dollar.
Before long, however, falling prices driven by worldwide volumes in production and installation (as well as technological advances and learning by doing) will result in evident ‘grid parity’, which will propel further installations. ‘“Grid parity” refers to the lifetime generation cost (or LCOE) of the electricity from PV being comparable with the electricity prices for conventional sources on the grid’ (Branker et al., Reference Branker, Pathak and Pearce2011, p. 4471). Because solar PV frequently generates at the site of use, it generally competes with the retail price of electricity rather than the much lower wholesale electricity price (which wind energy, for example, would normally compete against). Due to this, a number of areas in Australia and elsewhere in the world (where there are high levels of sunshine and/or high electricity prices) have already reached grid parity (BNEF, 2011a; Branker et al., Reference Branker, Pathak and Pearce2011; BZE, Reference Wright and Hearps2010; Lacey, Reference Lacey2011; Laird, Reference Laird2011; Mills et al., Reference Mills, Passey, Watt, Franklin, Bruce and Johnson2011a, Reference Mills, Passey, Watt, Franklin, Bruce and Johnson2011b; UNEP, 2011).
Many other countries are likely to reach grid parity by 2020 for solar PV-generated electricity (Bazilian et al., Reference Bazilian, IjeomaOnyeji, Liebreich, MacGill, Chase, Shah and Zhengrong2012; Bony, Doig, Hart, Maurer, & Newman, Reference Bony, Doig, Hart, Maurer and Newman2010; Branker et al., Reference Branker, Pathak and Pearce2011; BZE, Reference Wright and Hearps2010; EASAC, 2011; EERE, 2010a; IEA, 2010a; Jablonski, Tarhini, Touati, Gonzalez Garcia, & Alario, 2012), with prices continuing to fall strongly after that (EERE, 2010b; IEA, 2010a). In Australia, increasing electricity retail prices, driven predominately by investments to update and upgrade transmission and distribution networks (AEMC, 2011), mean that widespread grid parity will occur (or has occurred) much earlier than it would have otherwise.
Another driver of installations is likely to be the ‘peer effect’. Bollinger and Gillingham's (2011) research showed that a 1% increase in installations of solar PV in a neighbourhood resulted in a 1% increase in the rate of installation. Given that solar PV installations in Australia have increased by 35 times in 3 years (CEC, 2011), the peer effect is likely to be significant in accelerating installations.
Deployment of solar PV will also be driven by third-party financing, in which householders or businesses agree to have a third party install solar PV on their roof, with low or no upfront costs, in order to be supplied with electricity at below retail rates. This opens the solar PV market to large numbers of customers for whom the usual upfront capital costs would have been an obstacle.
Wind
The blades of wind turbines harness kinetic energy of wind, turning a rotor. At sufficient speeds, this rotational energy is converted to electricity by a generator, as with hydropower.
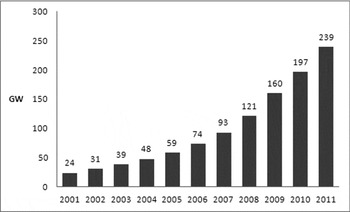
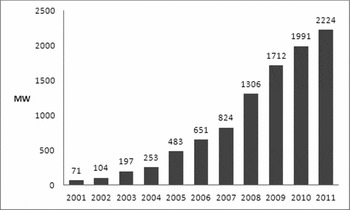
Globally, 42 GW of wind power was installed in 2011, up from 37.6 GW installed in 2010 (WWEA, 2012). Total installed global wind power capacity increased 22% during 2011, from 197 GW to 239 GW (WWEA, 2012) (see Figure 5). The energy generated by this wind capacity would be enough to power more than double Australia's current electricity use (assuming wind capacity factor of 25% and Australian electricity consumption of 242TWh, as in RET, 2011). World wind power capacity has been close to doubling every three years since 1996 (REN21, 2011). Australian wind capacity has also increased remarkably (see Figure 6).
Global wind capacity. Note: Adapted from WWEA (2012).


Some wind power plants in good wind locations around the world have a levelised cost of electricity (LCOE) that is equal to or lower than new coal plants (BNEF, 2011b; IEA, Reference Brown, Müller and Dobrotková2011d; UNEP, 2011) or even lower than ‘current energy market prices’ (IPCC, Reference Madruga, Edenhofer and Sokona2011, p. 95). With a carbon tax, the LCOE of wind generation compares even more favourably. Also, wind prices are expected to continue to decline, although not as steeply as solar prices (IEA, 2009; IPCC, Reference Madruga, Edenhofer and Sokona2011; Jablonski et al., Reference Jablonski, Tarhini, Touati, Gonzalez Garcia and Alario2012; Wiser, Reference Wiser and Bolinger2011).
While much of the variability of wind can be overcome through geographically dispersed systems (Delucchi & Jacobsen, Reference Delucchi and Jacobson2010; IEA, 2009; Mills & Wiser, Reference Mills and Wiser2010), grids with growing substantial percentages of renewable generation from variable sources such as wind and solar PV require increasing inclusions of ‘balancing systems’ (IEA, 2009), which can be called on to generate when the wind or PV generation is low. Electricity, unlike heat as we shall see, is expensive to store. Coal and nuclear generation cannot effectively balance the intermittency of wind and solar PV because of their low ramp rate (the rate at which they can increase or decrease generation). As the transition to high levels of renewables is made, the concept of baseload is likely to be ‘replaced by a system of flexible and inflexible energy sources’ (Elliston, Diesendorf, & MacGill, Reference Elliston, Diesendorf and MacGill2012; Parkinson, Reference Parkinson2012a, 5th para; see also Parkinson Reference Parkinson2011a, Reference Parkinson2011b). The need for flexible generation leads us to our next technology, concentrating solar thermal.
Concentrating Solar Thermal (CST) — Possibility of Round-the-Clock Solar Power
Concentrating solar thermal (CST) power generation ‘has strong potential to be a key technology for mitigating climate change’ (IEA, 2010b, p. 7). CST focuses sunlight to produce heat, which can then be used to drive a steam turbine. The heat energy can be stored (molten salt is the usual storage medium) relatively inexpensively to generate electricity during cloudy periods or at night (or to generate additional electricity during periods of peak demand). Commercial scale CST plants with molten salt storage or ‘backup’ have been running successfully for years, primarily in Spain (Dunn et al., Reference Dunn, Hearps and Wright2012).
‘Round trip efficiencies’ [i.e., the amount of usable energy that comes out of storage as a percentage of what went in] of 93% have been routinely achieved by commercial plants in Spain, even when energy is stored for 24 hours. Scale-up of plant sizes should further reduce heat losses as the surface area of storage tanks will reduce in relation to the stored volume. (EASAC, 2011, p. 25).
Others claim higher storage efficiencies can be expected (Denholm & Mehos, Reference Denholm and Mehos2011) with 99% storage efficiency claimed for solar towers (Dunn et al., Reference Dunn, Hearps and Wright2012; BZE, Reference Wright and Hearps2010).
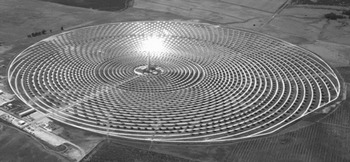
The Gemasolar CST solar tower plant in Spain (pictured in Figure 7) has storage for 15 hours of generation at full capacity (BZE, 2012) — effectively providing round-the-clock solar power —and has been operating since May 2011. EASAC states that ‘incorporating thermal storage capacity can extend the operating period of the CSP [CST] plant by a few hours after sunset up to 24 hour, base-load operation’ (2011, p. 11). The output from the Gemasolar 19.9 MW plant will be enough to supply about 25,000 households (Torresol Energy, 2011).
Gemasolar Solar Tower CST plant in Andalucia, Spain (Courtesy, Torresol Energy).

There are other forms of CST beside the solar tower shown in Figure 7; for example, the parabolic trough, Linear Fresnel Reflector (LFR) and dish (for descriptions see BZE, 2012; EASAC, 2011; IEA, 2010b; Wyld & MMA, 2008). The parabolic trough CST has been deployed most extensively. Of the different forms of CST, the solar tower is often a focus for least cost LCOE in the long run, due in part to the high temperatures that can be achieved (CTF, 2009a), the better tracking of the sun than trough and LFR through the year (BZE, 2012) and the fact that it is not yet as far along the cost curve as trough CST.
CST requires an area of high direct irradiance (direct sunlight), whereas solar PV can operate, with reduced output, under cloud cover. This means that CST is most suitable for areas such as northern Africa, southwestern United States, the Middle East and many regions of Australia.
CST is coming from a low base of deployment but has enough of a track record to stimulate large-scale deployment where sufficient incentives are available. According to EASAC, Worldwide in 2011, 1.3 GW of CSP [CST] were operating and a further 2.3 GW were under construction’ (2011, p. 1). The 354 MW ‘Solar Electric Generating Stations’ (trough CST) in California have been operating for over 20 years (IPCC, Reference Madruga, Edenhofer and Sokona2011, p. 357). A 370 MW solar tower CST plant (with gas backup) being constructed in Ivanpah (California), assisted by a US$1.6 billion government loan guarantee, is expected to supply the peak demand of 140,000 homes (NREL, 2011; Dyer, Reference Dyer and BrightSource2011).
As CST with storage can provide round-the-clock power on demand, it overcomes the intermittency issue that many have considered to be renewable energy's major shortcoming (along with higher cost); it has become a symbol of the potential for 100% renewables. Since the energy from CST can be stored and generation from the stored heat can be ramped up quickly, CST is considered dispatchable, that is, available when needed (Dunn et al., Reference Dunn, Hearps and Wright2012). Hence CST plants with storage can complement the variable generation of other renewable energy technologies (Dunn et al., Reference Dunn, Hearps and Wright2012) and effectively enable greater penetration (i.e., higher percentages) of wind and solar PV in the electricity grid (Denholm & Mehos, Reference Denholm and Mehos2011b; IEA, Reference Philibert2010b; EASAC, 2011).
The current levelised cost of electricity (LCOE) for CST is indicated to be about two to three times the LCOE of baseload fossil fuel electricity (EASAC 2011; Kolb, Ho, Mancini, & Gary, Reference Kolb, Ho, Mancini and Gary2011; Wyld & 2008). A number of sources, however, anticipate CST, given continuing growth in deployment and technical improvements, to be competitive first with peak load and then with intermediate and baseload load fossil fuel generation between about 2020 and 2030 (EASAC, 2011; IEA, 2010b; Kolb et al., Reference Kolb, Ho, Mancini and Gary2011; ECOSTAR, 2005). In some areas with particularly good solar resources and/or high electricity prices, CST is expected to achieve competitiveness with fossil fuel generation earlier (EASAC, 2011), as on Australia's Mt Isa network (Wyld & 2008).
If costs of CST are reduced, as forecast, to competitiveness with fossil fuel generation, then developing nations, where the largest growth in energy use is expected, may in many cases adopt CST rather than fossil fuel generation. Hence, driving the cost of CST down through deployment can be a ‘major contribution to climate change mitigation’ (Lovei & Walters, Reference Lovei and Walters2010). This principle underlies the World Bank's Clean Technology Fund's $US750 million investment in the Middle East and North Africa (MENA) CST deployment plan (Clean Technology Fund [CTF], 2009a). In the MENA plan, the excellent solar resources of Northern Africa and the Middle East will be used to supply electricity for Europe as well as the local MENA nations (CTF, 2009b; EASAC, 2011; Mukwaya, Reference Mukwaya2011; Trieb, Müller-Steinhagen, & Kern Reference Trieb, Müller-Steinhagen and Kern2011; Trieb, Schillings, Pregger, & O'Sullivan, Reference Trieb, Schillings, Pregger and O'Sullivan2012).
Comparative Levelised Cost of Electricity
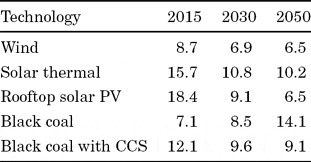
To present comparative LCOE with a standard set of assumptions, Table 2 uses data from one source, a CSIRO report by Hayward, Graham and Campbell (Reference Hayward, Graham and Campbell2011), although this source does not show CST as competitive with coal as early as sources cited above. Note that the price given for rooftop solar PV for 2015 (Aus18.4¢/kWh) is substantially below the current (2012–2013) electricity retail price of 25–33¢/kWh in New South Wales (IPART, 2012).
Comparative LCOE

Note: Adapted from Hayward et al. (Reference Hayward, Graham and Campbell2011, p. 29). In accord with current government policy, the figures are inclusive of a carbon price with a target of 5% reduction on 2000 emissions by 2020 and stabilisation of atmospheric CO2 at 550ppm by 2100. Discount rate is 7%. For further assumptions see Appendix B of source.
‘Zero Carbon Australia’: A Plan for 100% Renewables for Australia
The Zero Carbon Australia Stationary Energy Plan, produced by the non-governmental group Beyond Zero Emissions (BZE, Reference Wright and Hearps2010), proposes how to supply 100% of Australia's electricity needs with renewables in 10 years (by 2020). (The rest of Part 1 examines ideas and proposals from this BZE plan.) The plan is formed in light of the need to reduce greenhouse gases in the atmosphere to preserve the conditions within which civilisation developed. The plan was written by engineers working pro bono in collaboration with the University of Melbourne's Energy Institute. The plan states that it only considers commercially available generation technologies, not relying on any new breakthrough technologies. It is the first completed of six BZE plans to address how all of Australia's energy needs, including transport and liquid fuels, can be supplied by renewables. The plan breaks through many misconceptions about the limitations of renewables and provides evidence of the feasibility of supplying the energy needs of a whole economy without fossil fuels. Such a vision can bring into an integrated framework, government renewable energy policy initiatives. The vision provides the broad perspective necessary to come to terms with the large scale transformation of energy systems that has begun in the world.
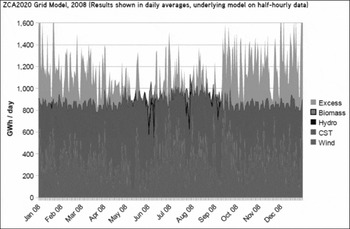
The Stationary Energy Plan uses the dispatchability of CST with storage to complement the use of wind power, expected to remain ‘the cheapest way of generating renewable energy’ (BZE, Reference Wright and Hearps2010, p. 24). The plan recommends an electricity generating system in which CST power towers with molten salt heat storage meet nearly 60% of demand, wind meets nearly 40% of demand and crop-waste biomass and hydroelectricity provide backup for uncommon occasions when generation from wind and solar does not meet demand (as illustrated in Figure 8). Such occasions are estimated to amount to only about 2% of demand.
Modeling generation of Beyond Zero Emissions system against demand (BZE, Reference Wright and Hearps2010, p. 80; used under source's Creative Commons license). The figure represents modelling of the generation from solar and wind in half-hourly segments against demand over a year on the basis of detailed records of wind generation, insolation (available sunlight) and National Energy Market (NEM) demand (BZE, Reference Wright and Hearps2010, pp. 80–81).

As the BZE aim is for all of Australia's energy needs to be supplied by renewable sources, the Stationary Energy Plan provides for electricity to supply energy needed for transport, heating and many industrial processes currently relying on fossil fuels. The electrification of transport results in major savings in energy and emissions, largely because electric motors are so much more efficient in converting energy to motion than internal combustion engines (BZE, Reference Wright and Hearps2010), as discussed in other large-scale decarbonisation scenarios (e.g., Jacobson & Delucchi, Reference Jacobson and Delucchi2010). Electrical ‘heat pumps’ can effectively replace gas space heating in most circumstances and many industrial processes can be electrified. Because of these additional services provided by electricity, the Stationary Energy Plan is designed with over twice the capacity that would otherwise have been needed.
Energy efficiency is a major part of the Stationary Energy Plan, as with other large-scale decarbonisation plans (e.g., see European Commission, 2011). Energy efficiency initiatives are generally regarded as the most cost-effective way of reducing emissions and often realise substantial net financial savings for household, commercial or industrial consumers. The Stationary Energy Plan calls for improving energy efficiency by one-third to bring ‘. . . Australia energy efficiency into line with other modern, developed economies’ (BZE, p. 10). These perspectives and aims are consistent with those of the Prime Minister's Task Group on Energy Efficiency (DCCEE, 2010).
The nearly 200-page Stationary Energy Plan systematically considers details on many aspects of implementation, from how deployment can be ramped up over years, leading to establishment of domestic components manufacturing, to the jobs that would be needed for construction and maintenance and even to the amount of concrete that would be required. The plan proposes wind and solar generation sites around Australia, selected to best meet demand through the year. In order to flatten the variability of wind and solar generation and to link remote generation sites with the grid, the BZE plan proposes a number of extensions and interconnections for the grid. Some of these are quite substantial, particularly that from Western Australia to the grid of the eastern states. The many grid links are costed and amount to over 20% of the total costs of the plan.
The Stationary Energy Plan provides economic calculations (with explicit assumptions) to assert that in the 30 years from 2011–2040 the proposed renewable energy system has approximately the same net present cost as business as usual, due to the avoided costs of investment in fossil fuel generation capacity, reduced fuel costs and savings through energy efficiency. Other sources also suggest that, for these reasons, the costs of high renewable scenarios may be less than or similar to existing policy settings or business as usual (EC, 2011; IPCC, Reference Madruga, Edenhofer and Sokona2011; Mathiesen, Lund, & Karlsson, Reference Mathiesen, Lund and Karlsson2011; Rocky Mountain Institute, 2011). The European Commission's (EC, 2011) ‘Energy Roadmap 2050’ notes (p. 5, italics in source): ‘Decarbonisation is possible — and can be less costly than current policies in the long-run . . . the costs of transforming the energy system do not differ substantially from the Current Policy Initiatives (CPI) scenario.’
What the BZE (Reference Wright and Hearps2010) plan perhaps did not highlight sufficiently was that the costs of the incentives required to stimulate the market to invest in the proposed 100% renewable system are much less than the total costs ($37 billion per year for 10 years) of the project. The plan did point out that the total costs should be seen in relation to the avoided investment costs in fossil fuel generation capacity and avoided fuel costs. It also stated that the cost of the plan, if funded totally through an electricity price rise, would only amount to an increase of $.065/kWh (p. 121), much less than the electricity price increases endured in recent years in eastern Australia due to conventional transmission and distribution (‘poles and wires’) investments. The plan, however, compared the total costs in relation to other public expenditure, even though only the incentives necessary to precipitate capital investment are required from the public purse.
It is worth noting that renewable energy can actually lessen market prices of electricity through the ‘merit order effect’ (EWEA, 2010; IEA, Reference Philibert2011c; Parkinson, Reference Parkinson2012b). As renewably generated electricity does not involve fuel costs, it generally continues to be offered at low prices during peak periods, offsetting the need for much higher priced generation from other sources, usually gas plants. Thus, the costs of incentives to promote deployment of renewables can be partially or totally offset by price benefits to energy consumers (Parkinson, Reference Parkinson2012b).
There are other benefits to the adoption of large-scale renewable energy systems such as BZE proposes. These include health benefits (particularly respiratory) through reductions in the particulate matter, SO2 and mercury emissions of coal generation (IEA, 2011a; Jacobson, Colella, & Golden, Reference Jacobson, Colella and Golden2005; World Bank, 2007; IPCC, Reference Madruga, Edenhofer and Sokona2011). Another benefit is decreased exposure to possible fossil fuel price increases, including higher gas prices (BZE, 2012) and oil prices (as oil is largely no longer needed for transport in the BZE plan). Funds that would have gone overseas for oil purchases can stay within Australia, improving balance of payments. Also, (again) the deployment of renewable technologies contributes to decreases in the costs of the technologies, which increases the likelihood that the technologies will be affordable for less developed countries, allowing ‘leapfrogging [of] the emission-intensive development paths that developed countries have taken so far’ (IPCC, Reference Madruga, Edenhofer and Sokona2011, p. 750).
The BZE plan has received some criticism. Trainer (Reference Trainer2010) challenges a number of BZE's assumptions and calculations as overly optimistic. He also argues that it is unrealistic to aim to supply society's energy needs with renewable energy unless we dramatically reduce our consumptive lifestyles. Diesendorf (Reference Diesendorf2011) questions whether: the timeline is realistic; an expensive grid link to Western Australia is necessary; there are not less expensive combinations of renewable technologies to achieve 100% renewables (see also Elliston et al., Reference Elliston, Diesendorf and MacGill2012). These critics, however, still see a transition to renewables as desirable and refer to the BZE plan as ‘a valuable contribution’ (Trainer, Reference Trainer2010, para. 1) and ‘a ground-breaking study’ (Diesendorf, Reference Diesendorf2011, para. 5).
Part 2: Insights Into the Educational Dimensions of Realising 100% Renewables
In Part 1 we looked at the developments in renewable energy costs, deployment and modelling that provide evidence that renewable energy generation is economically feasible for large scale integration into our national energy systems. In Part 2 we examine elements that assist in understanding how to realise the recommendation of the 4th International Conference on Environmental Education (UNESCO/UNEP, 2007) to build capacity for engagement in discourse or advocacy around such issues. Part 2 uses, in particular, Habermas's concepts of public spheres and communicative flows to assist in understanding the dynamics and communicative phenomena underlying advocacy networks and their and other influences on discourses and policy. By recognising the (often informal) educational dimensions of developments in the public sphere, educators may learn new ways in which they can take a role in furthering understanding and/or action in relation to renewable energy (and other issues).
Part 2 first briefly sketches some social action and policy developments in relation to renewables, to set the context for the more theoretical considerations. Part 2 finishes with discussion of the ‘architectural effect’ of the deployment of renewable energy technologies and the importance of vision developed in the civil sphere.
Some Social Action and Policy Developments
There is much action in the community for 100% renewables. Two other groups besides Beyond Zero Emissions that are dedicated to progressing large scale solar plants and a transition to 100% renewables are the Australian Youth Climate Coalition (AYCC) and 100% Renewables. The group 100% Renewables has been very effective in demonstrating community support for renewables and has recently centred its campaign around the image of CST tower plants, using the power of the visual to symbolise the capacity of renewables to provide large-scale and baseload energy. In May 2012, the AYCC presented 26,000 signatures (Albion, Reference Albion2012) and 100% Renewables presented 12,000 signatures (Bray & Soutar, Reference Bray and Soutar2012) to federal parliamentarians in support of large-scale renewables. In the past 3 years the winners of the ‘Young Environmentalist of the Year’ have been leaders of these three organisations (Banksia Environmental Foundation, 2009, 2010, 2011).
Other large environmental groups in Australia, as well as a network of many climate action groups and civic actors, are also working for implementation of 100% or large-scale renewable energy systems. This is occurring in concert with a global movement for climate action and renewables. Evidence of community support is shown through the Australian advocacy group GetUp's (2012) recent poll of its 500,000 plus members, which named ‘Investment in renewable energy’ as the number one priority.
The people in the 3,400 full time jobs directly created through wind, solar, geothermal and wave renewable energies in Australia (CEC, 2011), with many more in sales, administration and management, are likely to amplify support for renewable energy systems. Occupations tend to have strong influences on the identity and ways of thinking of workers, as Habermas (Reference Habermas1987) explains. For workers in renewable energy, norms and beliefs around renewable energy change. The settings of these workers, and the interests generated there, promote learning about the possibilities and rationales for renewable energy. Such workers communicate the possibilities and rationales to others, in some cases through advocacy roles.
Several pieces of recent legislation (Australian Government, 2012) should provide important support to the progress of renewables in Australia. The foundation of these is a carbon tax (transitioning to an emission trading scheme later), which increases the cost of generating electricity with fossil fuels and effectively lessens any additional cost of generating electricity with renewables. Money from the carbon tax is to fund the Clean Energy Finance Corporation (CEFC, 2012). The CEFC (2012) will have $10 billion to catalyse large-scale investment in renewable energy, low emissions and energy efficiency technologies, including renewable technologies that might otherwise seem too risky for the market in the early stages of commercialisation. The CEFC is to achieve a financial return on investment. The Australian Renewable Energy Agency (ARENA) will also be formed, in a consolidation of other programs (with funding totaling $3 billion), with the ‘objectives of improving the competitiveness of renewable energy technologies and increasing the supply of renewable energy’ (RET, 2012a).
The UNEP (2011) notes, however, that policy-makers in late 2010 and early 2011 (up to the time of the publication) were failing to spot the rapidity of progress of renewable energy and the pace ‘in [its] investment levels and, even more, in [its] cost-competitiveness with conventional power’ (p. 16). This has been true with the Federal Government's Draft Energy White paper (2011) and the Productivity Commission's (2011a, see also 2011b) report evaluating Australian carbon emissions policies, which overestimated costs of renewables. The costs of solar PV forecast in the Draft Energy White Paper (DEWP) for 2030 are in the order of double what the International Energy Agency (2010a) views as realistic for that time. Hearps and McConnell (Reference Hearps and McConnell2011) assert that the DEWP's anticipated 2030 solar PV costs are higher than current solar PV costs. The DEWP does not discuss the likelihood, or consequences, of grid parity for solar PV, which is anticipated before 2020 for much of Australia (Mills et al., Reference Mills, Passey, Watt, Franklin, Bruce and Johnson2011a, Reference Mills, Passey, Watt, Franklin, Bruce and Johnson2011b). Similarly, the DEWP's estimates of LCOE for wind generation for 2030 closely resemble the range that the IEA (2009, p. 12) estimates for 2009 installations.
Public Spheres, Communicative Flows and Governmental Policy
Habermas's (Reference Habermas1996, Reference Habermas, Goodin and Pettit1997, Reference Habermas2003) concepts of the role and importance of civic society and public spheres, and the flows of communicative action originating there, provide a framework for reflecting on where environmental education is occurring within the developments affecting the deployment of renewable energy technologies. The concepts provide a way of thinking about environmental education that includes informal and formal education, social movements and government decisions, all within the notion of needed learning processes to address an unsatisfactory situation — such as the high emissions from our current energy systems. The climate action movement, which has been the basis for much of the renewable energy movement, is discussed below as an illustration of Habermas's concepts.
Habermas (Reference Habermas1996) describes a process in which the governmental/bureaucratic systems need to be informed or sensitised by the public sphere to problems caused by governmental and economic structures and practices. He describes the process as a flow that can start from informal discussions on the periphery of the public sphere and can aggregate and strengthen and eventually reach to the formal decision/policy making of the legislative structures. These processes can bring about learning and policies that pave the way for deployment of renewables.
A public sphere is a domain in which public opinion can be formed (Habermas, Reference Habermas, Goodin and Pettit1997): ‘A portion of the public sphere is constituted in every conversation in which private persons come together to . . . deal with matters of general interest without being subject to coercion . . .’ (p. 105). The public sphere extends from the ‘informal periphery’ — the spontaneous interaction of individuals — to the formal, constitutionally based procedures for incorporating the will of the people into law and policy. The legitimacy and democratic processes of government depend on flows of communicative power ‘coming from the informal contexts of communication found in the public sphere, in civil society, and in spheres of private life’ (Habermas, Reference Habermas1996, p. 352). Habermas (Reference Habermas1996, p. 350) notes, however, that the constitutionally established flows of will formation are ‘preserved only if government officials hold out against corporate bargaining’.
In the spontaneous interactions of the periphery of the public sphere — at the intersection of the public sphere and personal sphere — people talk together about the effects they have experienced or are concerned about in situations facing a group or larger society (e.g., effects of climate change). They form opinions on what is in the general interest (for example, the advancement of renewable energy options). As the outcomes (‘communicative power’) of their and others’ discussions come together and are developed, they can, under the right conditions, impact on governmental systems responsible for the problematic situation.
In order to have influence on policy, these flows of communicative power often have to contend with the power of vested interests and the influence these interests have in the media and in government. Powerful industry players can portray their industry interests as being the same as the national interest and can use their influence in government to choke out debate, information and resources for promising alternative systems (Curran, Reference Curran2009; Pearse, Reference Pearse2007). The descriptions in this section of the identification, themetisation and dramatisation of problems and solutions in the public sphere can be regarded as strategies for dealing with such hegemonic influences.
In this context is it helpful to remember the original purpose of the systems that require sensitisation. As a society develops it allocates many decisions to ‘systems’ (or ‘subsystems’ as Habermas calls them) it creates so that it does not have the burden of democratically working through these many decisions (Habermas, Reference Habermas1987). Government makes many functional decisions on behalf of society members. To take a simple example, a water board decides on the size and design of a network of pipes and treatment plants to serve expanding areas of a city or to upgrade others. The public is normally content to have routine decisions like these decided by such a governmental system. If, however, there were some aspects of the resulting activities that were unsatisfactory, say they disturbed the high environmental value of some area or the work caused too much disruption to local business activities, the public could sensitise the system (the water board or other relevant government departments) to the problem and to alternatives.
In some cases the unsatisfactory nature of a legacy of decisions only emerges after a long period, perhaps due to new information, and may involve much larger scales of government, society and economy. This is the case with awareness of anthropomorphic climate change. Information has emerged that many of our existing economic structures and practices put our future at risk through the emissions involved. The decision-making processes underlying these circumstances have been ongoing for generations, are embedded in innumerable parts of our economy, and are part of the interests of large financial forces. This means the institutionalised decision-making processes tend not to be alert and responsive to new information and alternatives, as this new input is from outside the usual routines of interaction and patterns of thinking (Habermas, Reference Habermas1996).
As self-referential functional systems may not be responsive to newly emergent problems (perhaps through the conscious efforts of vested interests), the public sphere can serve as the sounding board for such problems (Habermas, Reference Habermas2003). In addition to detecting and identifying problems, the public sphere must:
amplify the pressure of problems, that is . . . convincingly and influentially thematize them, furnish them with possible solutions, and dramatize them in such a way that they are taken up and dealt with by parliamentary complexes. (Habermas, Reference Habermas1996, p. 359)
This is what the climate action movement has done over the past 10 years. The climate action movement constitutes much of the foundation for the 100% renewables vision and has been an astonishing environmental education phenomenon. The flows of concern about climate change brought many people together in civil organisations devoted to solutions on this issue. These were able to amplify the pressure of calls for climate action, in part just through the sheer numbers involved. One hub for climate action groups around Australia lists over a hundred and twenty groups around Australia (http://www.climatemovement.org.au/groups/).
Themetisation of flows of climate change concerns began, for example, through public meetings for some climate action groups (CAGs). Participants distilled themes from discussions and began work on finding information, strengthening arguments and teaching one another and local communities in relation to these. Local CAGs formed networks with similarly oriented groups nationally and regionally. Members of CAGs met with and corresponded with local or distant parliamentary representatives. These exchanges both alerted parliamentary representatives to the concerns and arguments about climate change and provided encounters for CAG members to refine their arguments. Those concerned about climate change engaged in many other actions, both local and virtual (such as signing petitions and emailing government ministers).
Civil actors also took steps in defining and proposing solutions at both local and larger scales. Calls for renewable energy gradually became more refined as CAG members and others educated themselves and one another about which renewable technologies were most cost effective in different locations. Civil actors highlighted to government possibilities for specific policies that would lessen emissions, based often on information passed through climate action networks and/or developed in reports from state, national and international organisations. Members of formal educational and scientific institutions published analyses, or were covered in the media, on many aspects of climate change and emission mitigation. CAGs also worked with local councils to promote initiatives such as community solar PV bulk buy programs and community energy efficiency programs.
CAGs and other civil actors dramatised the problems and solutions around climate change in a number of visual, engaging and memorable ways. Images of lines of people spelling out words like ‘clean energy for eternity’ made national TV news. The Australian Youth Climate Coalition had representatives attend 2010 federal election events in a costume to dramatise ‘the elephant in the room’ that is climate change. The group GetUp and others ran TV ads for climate action. The group 100% Renewable, with its affiliates, conducted its first poll of 14,000 people on their desire for renewable energy, which was presented to the Multi Party Climate Change Committee negotiating the carbon tax policies (SMH, 2011).
This identification, themetisation and dramatisation of problems and solutions by the public sphere has had significant effects on the Australian policy and legislative process. Civic awareness and demand has forced changes in policy (Curran, Reference Curran2009; Lawrence, Reference Lawrence2009). Before the 1997 election, rebates for residential installation of solar PV panels were doubled and both major political parties committed to a price on carbon. A Renewable Energy Target of 20% by 2020 was subsequently passed, with the support of both major political parties. Most states have had a period of feed-in tariffs for solar PV. In 2009 the government announced the Solar Flagships program, now designed to support the construction of two 150–250 MW large-scale solar facilities (RET, 2012b). More recently, with support from environmental networks in many forms such as online petitions and email campaigns, the ‘Say yes campaign’ large demonstrations and the poll of 14,000 people by the group 100% Renewable, the government has, as mentioned, legislated the carbon tax and allocated $10 billion for clean energy in the Clean Energy Finance Corporation. This policy process has, however, been dogged by setbacks, such as recent opposition to wind farms, and the axing of funding for renewable programs, by some state governments.
Recursiveness
There is a recursive nature to the communicative flows from the periphery of the public sphere to the legislative institutions. As social movement organisations gathered information and refined rationales for climate action and renewables to put before governmental representatives, their reports were being used by CAGs and individuals as substance for further discussions within the groups and at the periphery of spontaneous interactions. This was likewise the case with reports and other publications coming from academic institutions and agencies around the world, such as the IEA, the EERE, the Intergovernmental Panel on Climate Change and many, many others.
Governments responding to the civil communicative pressure on an issue have set up departments or teams dedicated to the issue, such as those involved in the modelling of the carbon tax or in the Garnaut Climate Change Review. Their analyses inform (and sometimes challenge) climate action networks and interactions in the civil sphere. New policies are formed in response to the climate movement and these policies then affect organisations and individuals in the movement. Renewable energy and energy efficiency business organisations, sometimes made possible by policies resulting from the advocacy of the climate movement, produce reports that inform the movement and further sensitise the government. Habermas (Reference Habermas1996, p. 357) writes of ‘an extraordinary mode of problem solving’ in which bureaucratic systems are sensitised by ‘renovative impulses from the periphery’, and there is a ‘consciousness of crisis, a heightened public attention, an intensified search for solutions . . . the attention span of the citizenry enlarges’. This brings about ‘accelerated learning processes’ (p. 358).
While the discussion above only touches on a tiny fraction of the communicative flows, including recursive influences, around climate action and renewable energy, it is perhaps enough to show that the flows from periphery to centre (and back again) are educational processes. There are innumerable educational acts as members of CAGs or other civil actors repackage newly developing information (from an array of sources) for their group, their local council advisory committee, or informally for their friends or associates. Also, professionals develop themes in reports, publications or informally. The evidence and rationale for climate action and renewable energy becomes more detailed, in depth, refined, targeted and sometimes simplified.
‘Communicative Space’, Personal Development and Lifeworld Change
In our discussion of Habermas thus far we have been considering the development of information, ideas, coordinated action and political will that can flow (with recursive influences) into legislative organs and policy action. There are other important dimensions to communicative action, which involve the development of the identity and dispositions of the participants. These constitute transformational aspects of environmental education that are personal, yet also political.
Habermas (Reference Habermas1996, Reference Habermas1987) writes that there is a feature of communicative action that is beyond the coordination of action or the cognitive contents of communication. It relates to the social space — or ‘communicative space’ (Kemmis & McTaggart, Reference Kemmis, McTaggart, Denzin and Lincoln2005) — generated when actors seek to understand together and ‘take a second-person attitude, reciprocally attributing communicative freedom to each other’ (Habermas, Reference Habermas1996, p. 361). That is, they show respect for one another, considering each other's perspectives, in the intersubjective attitude of ‘I and Thou’ (Habermas, Reference Habermas2003, alluding to the theologian Martin Buber). In this communicative space, actors can develop personally and individuate as they express the I's ‘inner world of spontaneous experiences, which come out not through norm-conforming actions but only through communicative self-presentation’ (Habermas, Reference Habermas1987, p. 42). The audience of the other as equal creates the setting for this expression that can constitute self development.
In addition to the individuation experienced through communicative space, members of social movements subject elements of the lifeworld — the normally unquestioned intersubjectively shared knowledge and perspectives that form ‘the communicative infrastructure’ of interaction (Habermas, Reference Habermas1987, p. 375) — to scrutiny. The members consider elements of the lifeworld in relation to the rationales involved with their social movement, such as those for climate action. In doing so they can change their way of life and aspects of their identity as they change the ‘grammars’ or rules associated with language games that are part of the constitution of the lifeworld (Habermas, Reference Habermas2003). They change the reference points for life and how life is lived. So these communicative settings can engender profound educational changes for individuals, and for society.
The very personal and developmental effect of communicative space and the problematisation and change of elements of the lifeworld complement the recommendations of the 4th International Conference on Environmental Education (UNESCO/UNEP) and Jickling's (Reference Jickling2010) reflections on the 5th World Environmental Education Conference. The 4th International CEE recommended that environmental education cultivate transformative approaches, not surprising in view of its emphasis on critical engagement with established discourses. Jickling (Reference Jickling2010) writes of an ‘urgency to find ways to enact radically new stories to live by and to enact fundamental changes in the ways that knowledge is created, transmitted and applied’ (pp. 34–35).
Architectural Effect
Not only is there lifeworld change through discursive interactions, as in the communicative networks of a social movement, but there is lifeworld change on more unconscious levels. New circumstances change the sense of norms in relation to which people act and interact. This changes the opportunities for development of relevant discourse and advocacy.
As mentioned, Bollinger and Gillingham (Reference Bollinger and Gillingham2011) describe the peer effect — how an increase in solar PV installations in a neighbourhood increases the uptake by others. This is not surprising, given the influence of our environment on us, on our lifeworld. Churchill stated: ‘We shape our buildings and afterwards our buildings shape us’ (Hansard, 1943, p. 403). The physical environment around us is a hidden curriculum. The environment is visible, but we often do not recognise that it is teaching us something, shaping what we believe to be possible in life (Reynolds, Brondizio, & Robinson, Reference Reynolds, Brondizio and Robinson2010). The human-made physical environment conveys ideas, a ‘paradigm’ about our wider relationship with nature (p. xiv). Architecture ‘is a powerful form of pedagogy’ (p. xiv).
If solar panels are part of local architecture, the pedagogy of that architecture can subtly teach about renewable energy and its potential (and that it is a normal part of our life). This unconscious effect on our lifeworld has been due in large part to the government policies that have been a response to the communicative pressure in the public sphere. Given that solar PV installations increased by over 35 times in approximately the last 3 years (CEC, 2011) and we are near to grid parity, which will further drive installations, this architectural effect may be significant. Many people will be interested in learning more about renewables and may be alerted to the possibility that our entire energy system could undergo transformation.
These architectural effects and lifeworld changes influence social identity and are extended through social interaction. There is an element of mutual constitution of social identity (and worldview) that occurs in discussion (Berger & Luckmann, Reference Berger and Luckmann1966; Cunliffe, Reference Cunliffe2008; Gergen, McNamee, & Barrett, Reference Gergen, McNamee and Barrett2001; Shotter, Reference Shotter1993; Yanow, Reference Yanow, Yanow and Schwartz-Shea2006). Hence, ‘comparing notes’ with others about solar panels and generation would be expected to have a social cultural effect. For example, those with solar panels may be more likely to perceive, seek out, cognitively assimilate and remember information about opportunities arising from renewable energy.
Vision
In a presentation to the Australian and New Zealand Solar Energy Society Conference in 2006, Zerong Shi — the entrepreneur who took his University of NSW solar PV education to backers in China to establish Suntech, hailed in 2012 as the world's largest solar PV company (Solar Energy, 2012) — stated that ‘the trouble with politicians is they have no imagination’. While this generalisation is unfair to innovative work done by politicians and their staffers, it makes the point that politicians can often have a bureaucratic orientation that sets goals in relation to existing norms. The public sphere plays a crucial role in stimulating imagination of what can be. Such vision, tempered with rigorous analysis of practicalities, can set new reference points for the development of policy and investment.
Vision is a feature of environmental education and an important motivator for pro-environmental behavior (Birdsall, Reference Birdsall2010). The National Action Plan for Education for Sustainability recognises that ‘Vision is a vital step in the policy process’ (Department of Environment, Water, Heritage and the Arts, 2009, p. 7). With the vision of 100% renewables, it has been possible for groups like Beyond Zero Emissions to think boldly enough to undertake analyses that suggest the affordability and benefits of a 100% renewable energy system. The vision sensitises policy makers and the public sphere to the rapidly emerging developments relevant to achieving the vision. The fact that winners of the Young Environmentalist of the Year in 2009, 2010 and 2011 were in organisations that are pursuing 100% renewables, suggests that this is a powerful vision. It acts both as a motivator and a curriculum focus for environmental education.
Conclusion
Renewable energy technologies have been developing so quickly that it can surprise people's tacit expectations and cultural gauge of what is realistic. Continuing growth will be propelled by investment in research, jobs created, dropping prices and prospects for competiveness with conventional systems of generation. The dramatic and innovative nature of advances with renewables makes them an exciting field in which to guide student learning or focus civil interactions. There are many sources of information available that track the fast moving issues.
The progress of renewable energies holds promise that an adequate response to climate change can be achieved. However, it will require an acceleration of the developments that environmental educators, or educators more generally, can facilitate. To do so, it is helpful to appreciate the education that has already been occurring in the movements dedicated to renewables and climate action, and to perceive the policy responses to that public pressure as part of an educational phenomenon. Habermas's theories of public spheres and the circulation of communicative power help us to see the many points of education that are occurring in this educational movement that includes formal and informal education. These theories also help us to see the many points and ways in which educators may inform and engage with the development of the discourse around renewable energy.
The vision of a society powered 100% by renewables is central to efforts to coordinate and understand renewables and climate change. The vision conveys the scale of the change needed to mitigate emissions sufficiently to avoid dangerous climate change. Analyses — by Beyond Zero Emissions (Reference Wright and Hearps2010), Elliston et al. (Reference Elliston, Diesendorf and MacGill2012), Mathiesen et al. (Reference Mathiesen, Lund and Karlsson2011), agencies such as the European Commission and others — of how large-scale renewables can be attained, help us to realise that this is a vision with a practical basis.
Author Biography
William Adlong has been working with community groups for over a decade to demonstrate and advocate for low emission pathways. Within the local City Council environmental advisory committee, William was recently part of a team with Council staff facilitating substantial reductions in Council's emissions and developing support for community photovoltaic bulk buy.
William is an Educational Designer with Learning and Teaching Services at Charles Sturt University. He was manager of the university's new sustainability office for 2 years as the office was established. He is also a PhD candidate focusing on nonformal and informal education involved with community responses to climate change.