The debate continues on how best to provide health insurance to the US population. Our goal in this paper is to answer one of the questions raised by the Affordable Care Act (ACA) and its potential revision – whether providing health insurance to the population approaching retirement affects the likelihood they will work longer, and in particular whether the general availability of health insurance coverage to those under the age of 65 accelerates their retirement.
The analysis takes advantage of the natural experiment associated with the adoption of the ACA to examine how such insurance affects the likelihood of retirement. Concern about this issue stems from the findings in an extensive literature suggesting retiree health insurance accelerates retirement.Footnote 1 ACA may have a similar effect to retiree health insurance since it provides health insurance to those who would not be covered until they become eligible for Medicare should they choose to retire before age 65. To the extent that ACA accelerates retirement, this side effect would be inconsistent with decades of public policies that were designed to increase the retirement age.Footnote 2 Because any substitute for ACA might have a similar effect, it is useful to determine how publically provided health insurance is likely to affect retirement – and the effect of ACA on retirement is an obvious place to start.
In contrast to the suggestion from the literature on retiree health insurance, Levy et al. (Reference Levy, Buchmueller and Nikpay2015) do not find those under the age of 65 have changed their retirements following the implementation of ACA. They compare changes in retirements through mid-2015 between individuals residing in states that participated in ACA with changes in retirements observed for individuals from states that did not participate.
A goal of this paper is to help to fill the gap in our understanding of the effects of the ACA on retirement. In particular, we wish to determine whether the apparent contradiction in findings between the retiree health literature and the recent analysis of the retirement effects of ACA continue to hold up upon further examination of the effects of the ACA.Footnote 3
In contrast to the previous literature on the ACA, we focus on three major groups of employed individuals, categorized by their employer-provided health insurance coverage before the adoption of ACA. A first group consists of individuals with employer-provided health insurance when working, but with no employer-provided retiree health insurance to cover them should they retire before age 65. This group is subject to an incentive from ACA that is similar to the incentive created by retiree health insurance. ACA would not induce as large a change in the marginal incentive to retire for two other groups, those whose employers provide health insurance both on the job and in retirement, and those with no employer-provided health insurance either at work or when retired. Note that our approach, comparing the differences in outcomes among these three groups between two periods, differs from and is somewhat complementary to the approach taken by Levy et al. (Reference Levy, Buchmueller and Nikpay2015).
First, using two cohorts from the Health and Retirement Study (HRS), we conduct a difference-in-difference analysis of the actual effects of ACA on retirement in the short term. This analysis uses data from the HRS Mid Boomer cohort (born from 1953 to 1959) to calculate the differences in retirement outcomes between those whose retirement incentives are modified by ACA and those whose marginal incentives are not affected by ACA. Retirement changes are calculated over the 2010–2014 period. The analysis then compares the changes among the three groups over the period since ACA was adopted with the analogous changes over an earlier period for those in an older cohort (Early Boomers born from 1948 to 1953), a cohort not subject to incentives from ACA.
In view of the possibility that too few years have elapsed since the implementation of ACA to find effects on actual retirements, our second step is to extend the time period for measuring retirement. We do this by considering changes in respondent reports of their expected retirement and Social Security claiming dates. For Mid Boomers, the changes in expectations are calculated for each of the coverage groups over the 2010–2014 period. For Early Boomers, calculations are made over the comparable age span. Many expect to retire after 2014. Thus, the period of analysis is not limited to the 2010–2014 period used to observe actual changes in retirements. Using the change in retirement expectations as the dependent variable allows individuals to consider changes over a much longer period. As a result, it allows them to enhance the attractiveness of retiring earlier by changing saving and other related behaviors, changes that are not possible in the short run.
Our third step is to project the potential effects of ACA over an even longer period. For this exercise, we use a structural model of retirement.Footnote 4 The model was previously estimated to explain the retirement behavior observed for married men from the original HRS cohort (Gustman and Steinmeier, Reference Gustman and Steinmeier2018, forthcoming). The model includes the role that health insurance plays in buffering against small probability catastrophic health events that may create very large declines in assets and consumption.Footnote 5
To simulate the effects of ACA on retirements, we introduce ACA into the budget constraint facing each individual. We adopt the simplifying assumption that there is no medical spending once the ACA is implemented. This procedure allows us to simulate the effects of ACA in the long run, that is, the full adjustments in retirement that might be observed for those who entered the labor market with ACA already in place. It also allows us to simulate adjustments in outcomes over the short and intermediate terms. We do this by introducing ACA at an older age and allow respondents to reoptimize their behavior in view of the unexpected change in the law. Thus, a major advantage of the structural approach is that it allows us to compare the effects of ACA on retirement in the short, intermediate, and long run. Note, however, that simulations from our structural model are likely to provide an upper bound to the effects of ACA. The Medicaid expansion and the income-related subsidies under ACA for those who are not covered by group plans may provide coverage that is inferior to that provided by employer health plans, deductibles, copays, and limitations on coverage notwithstanding. In contrast, our simulations assume that all medical costs will be covered under ACA.
We are aware of an important potential pitfall in analyzing the relation of retiree health insurance to retirement. Availability of employer-provided health insurance is correlated with coverage by a defined benefit pension. Previous analyses have at times confounded the effects of retiree health insurance with those of Defined Benefit (DB) pensions. To avoid this pitfall, after we explore the retiree health insurance – pension relation in descriptive data, we standardize for the influence of correlated pension incentives on retirement in a multivariate setting, and then make the comparison in a structural setting. This is designed to eliminate any specification error that would otherwise result from failing to standardize for the covariance between employer-provided health insurance and incentives from pensions.
In Section 2, we estimate the size of the groups classified by their health insurance coverage in 2010; we indicate the changes in employer-provided health insurance at work and in retirement between 2010, before ACA, and 2014, after ACA was implemented; and provide related descriptive data. Section 3 estimates the relation between initial type of health insurance coverage and retirements observed between 2010 and 2014, and for an older cohort over a 4-year period involving the same initial age span. Section 4 examines changes in retirement intentions and benefit claiming intentions before vs. after adoption of the ACA. Section 5 modifies a structural model to project responses to ACA in the long term, as well as in the short run and intermediate run. Section 6 concludes. The equations and methods for estimating the structural model are described in the Appendix and in Gustman and Steinmeier (Reference Gustman and Steinmeier2018, forthcoming).
2. Descriptive analysis of the availability of health insurance
We arrange the descriptive analysis around three groups. ACA is most likely to affect marginal retirement incentives for members of the first group, those who had health insurance on the job, but did not have employer-provided health insurance should they retire before age 65. After ACA, the private health insurance market and exchanges provide retiree health insurance, often subsidized, reducing the incentive for members of this first group to stay on the job. In contrast, ACA does not affect incentives for a second group, those who before its implementation had employer-provided health insurance on the job and in retirement. Nor does it affect incentives for those who initially had no employer-provided health insurance, either while working or when retired.Footnote 6
The data in this section is from members of the Mid Boomer cohort of the HRS, individuals who were born from 1954 through 1959. We restrict the sample to respondents who were aged 51–56 when they first entered the HRS.Footnote 7 Observations begin in 2010, before ACA affected the availability of health insurance. The last HRS observations available at the time of the writing of this study are from 2014.
2.1 Health insurance coverage from employers
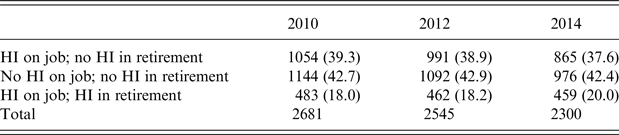
Table 1 begins with data on insurance from work-related sources only. The sample in each year is restricted to those who have a current job in that year. Percentages of observations in the indicated year are reported below the counts in each cell.
Employer-provided health insurance on current job and in retirement in 2010, 2012, and 2014 (percentages of total are in parentheses)1

1 The sample is restricted to Mid Boomers who had a current job and were aged 51–56 when they first entered the survey.
HI, Health Insurance.
From row 1, column 1 of Table 1, 1054 respondents in 2010, or 39.3% of 2010 respondents who were currently employed, had employer-provided health insurance while working on their current job, but did not have employer-provided health insurance in retirement. This juxtaposition of health insurance availability generates the strongest first-order incentive influencing retirement prior to ACA, encouraging the individual to postpone retiring. Moving down column 1, 42.7% of respondents had no employer-provided health insurance either on their current job or in retirement. When a person has no employer-provided health insurance either before or after retirement, health insurance does not differentially affect the incentive to retire. The third group includes 18% of employed respondents. In 2010, these individuals had employer-provided health insurance whether working or retired, so that employee-provided health insurance did not create a strong incentive affecting retirement.Footnote 8
There are very small differences between years in the proportion falling within each health insurance group.Footnote 9 This can be seen by comparing values across the three columns of Table 1. Between 2010 and 2014, the fraction of the employed with health insurance on the job and no health insurance in retirement decreases from 39.3% to 37.6% of the employed. The fraction with no health insurance either on the job or in retirement decreases from 42.7% of the employed in 2010 to 42.4% in 2014. Lastly, the percentage of employees with health insurance both at work and when retired increases from 18.0% to 20.0%.
The summary statistics in Table 1 do not provide a full picture of the changes experienced by those falling in different health insurance groups before ACA. Those in one category of health insurance in 2010 frequently are found in another category in 2014. Nevertheless, because the flows into and out of each category roughly offset, the gross row and column totals of Table 1 suggest small changes in the total within each category between 2010 and 2014.
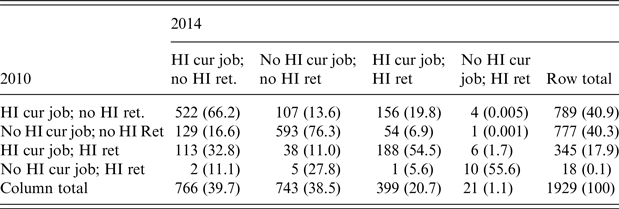
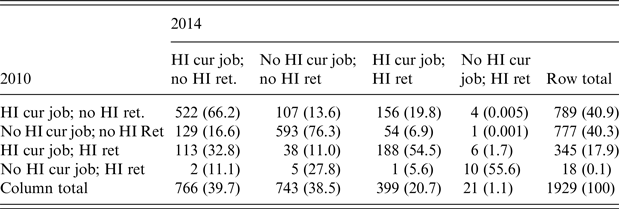
From the perspective of individuals, despite the substantial probability of moving from one health insurance category to another, the probability of having the same coverage at work and in retirement in 2014 as in 2010 is substantially >50%. Consider row 1 of Table 2.Footnote 10 In 2010, before the ACA was implemented, 40.9% of respondents were covered by health insurance on their current job, but not in retirement. Looking across row 1, by 2014, only 66.2% of those individuals (522/789) still had health insurance on their current job, but not in retirement. From row 1, column 2, by 2014, 13.6% (107/789) had lost health insurance on their current job and still had no health insurance in retirement. In contrast, among those with health insurance on their current job in 2010 but not in retirement, by 2014, 19.8% (156/789) had maintained their insurance on their current job, while also gaining retiree health insurance.
Number of respondents by health insurance coverage on current job and in retirement, 2010–2014 (percentages of total are in parentheses)1
1 Sample includes those respondents in 2010 and 2014 who had a current job in each of those years.
HI, Health Insurance.
Row 2 of Table 2 pertains to the 40.3% of respondents in 2010 who had no health insurance either on the job or in retirement. Of this group, 16.6% (129/777) gained health insurance on the job by 2014. An additional 6.9% (54/777) of those with no insurance in 2010 gained health insurance both while employed in their 2014 job and also when they retired.
Consider next the third group in 2010, those with health insurance at work and when retired. Although 54.5% (188/345) were similarly insured in 2014, 32.8% (113/345) lost their retiree benefits, although they maintained insurance on their current job, while by 2014, 11.0% (38/345) no longer had either current or retiree health insurance.
2.2 Health insurance coverage from all sources
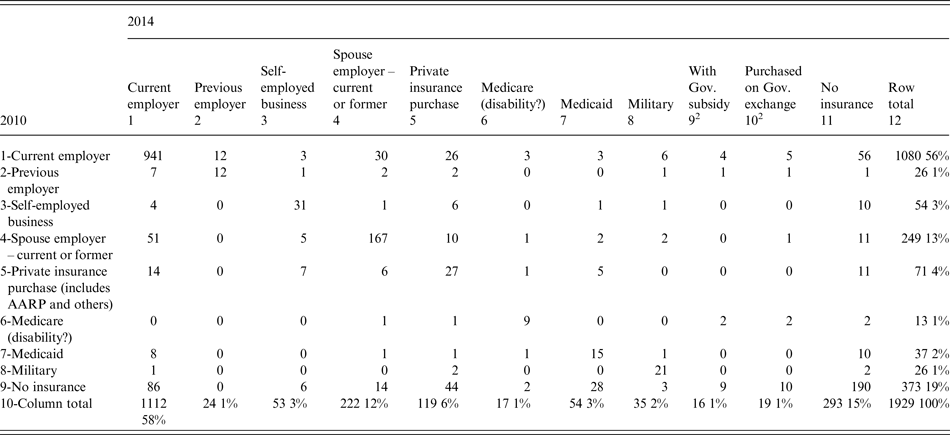
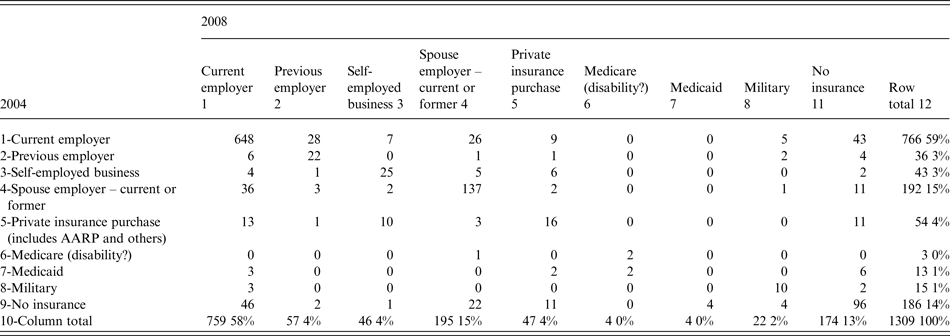
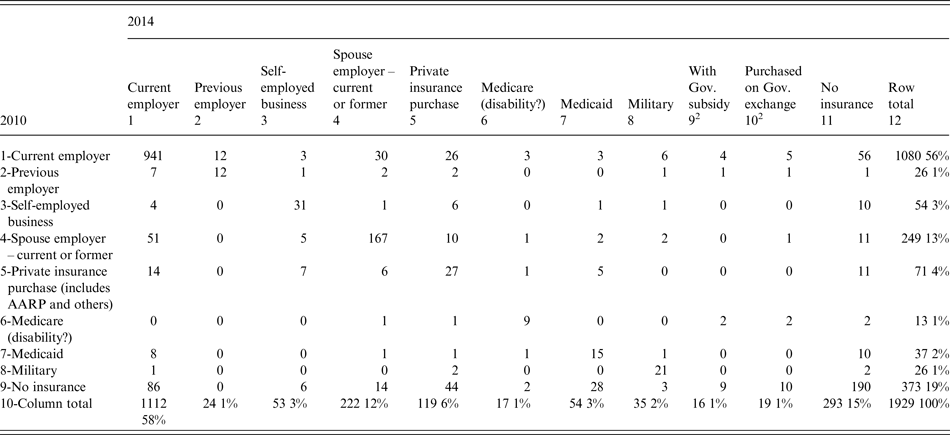
The goal of ACA is to increase health insurance coverage, whether that coverage is through the employer or from other sources. The shares of respondents with each source of employer-provided coverage in 2010 are reported in the last column of Table 3. Shares of employed respondents by source of coverage in 2014 are reported in the bottom row. The cells in the table trace the changes in sources of coverage between 2010 and 2014, before and after ACA. For purposes of comparison, Table A1 reports the same flows for the Early Boomer cohort between 2004 and 2008, when the Early Boomers fell in the same age span as the Mid Boomers. Remember, however, Early Boomers were unaffected by the ACA.
Number of employed respondents by the source of insurance in 2010 and 20141
1 This sample is constrained to include those who were currently employed in 2010 and in 2014.
2 Columns 9 and 10 are not mutually exclusive. These are subsets of private insurance purchase.
AARP, American Association of Retired Persons.
Health insurance coverage is considerably higher when one considers sources beyond own current employer. Looking down the last column of Table 3, other sources of coverage increase the health insurance coverage rate from 56% of employed individuals based on insurance from own employer up to 81%. (In 2004, the Early Boomer cohort shows an analogous increase from considering other sources of health insurance from 59% to 86%.) Aside from own employment, in 2010, the spouse's employer (13%), private insurance (4%), and insurance through self-employment (3%) are the three most important sources of coverage.Footnote 11 The results in Table A1 for Early Boomers in 2004 are similar.
From row 9, right-hand column (12), when health insurance coverage from private insurance, Medicare, Medicaid, from military service, and from other sources are included, 19% of the continuously employed had no health insurance in 2010. (In 2004, 14% were uninsured.) After ACA, from row 10, column 11 of Table 3, the group with no insurance had fallen to 15%. Thus, between 2010 and 2014, the share of currently employed individuals without health insurance coverage had fallen by about 4 percentage points. (Between 2004 and 2008, there was a 1 percentage point decline in the share of the employed who were uninsured.) Among 1080 respondents who had coverage from a current employer in 2010, 87% (941) had insurance from a current employer 4 years later. Of the remainder, 5.2% (56/1080) ended up with no health insurance; 2.8% (30/1080) were newly insured through a spouse, and 2.4% (26/1080) had purchased private insurance.
Of 373 individuals who had no insurance in 2010, just over half (50.9% = 190/373) still had no insurance by 2014; 23.1% (86/373) gained insurance from a current employer; 11.8% (44/373) secured private insurance; and 7.5% (28/373) gained coverage from Medicaid. The transitions observed between 2004 and 2008, before the advent of ACA, were similar.
Not shown in Table 3, the percentage of the sample with retiree health insurance from their own current employer, a previous employer or a spouse's employer increased from 19.2% in 2010 to 22.5% 2014.
There are three lessons to take away from these data. The first is that the transitions from the period before to after ACA are not very different from the comparable transitions observed for an older cohort over the same age span. The second lesson is a caveat about our methodology. We will attempt to measure the effects of ACA on retirement incentives by focusing on the group that, before ACA, had employer-provided health insurance on the job, but not in retirement. We assume they gain coverage in retirement from ACA that they otherwise would not have had, so their incentive to keep on working is reduced. But as Table 3 demonstrates, some of them would have secured health insurance in retirement from the other sources listed in that table. For those respondents, we will overstate the effects of ACA on their retirement incentives. Members of other groups would also have experienced a change in their insurance status before reaching retirement age. For some, ACA would have a greater effect on their retirement incentives than we are supposing. The third lesson is that others would have secured health insurance coverage outside of their own employment. This means that our attempt to identify the affected group by focusing only on insurance from the employer tells only part of the story. This approximation should be borne in mind when interpreting our later results.
2.3 Health insurance coverage and pensions
To understand the relationship between retirement and retiree health insurance, one must eliminate the effects of any covariation with incentives created by defined benefit pensions (Gustman and Steinmeier, Reference Gustman and Steinmeier1994). There is a very close relationship between coverage by a defined benefit pension and the availability of retiree health insurance. Omitting the incentive created by an early retirement spike due to a defined benefit pension from a retirement analysis invites specification error. The effect on retirement of the omitted pension incentive, which varies with the terms of the pension benefit formula as well as the work history of the covered individual, will be attributed inappropriately to retiree health insurance.
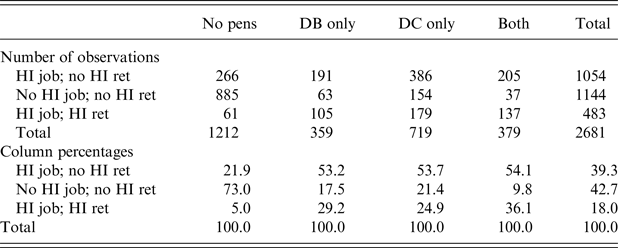
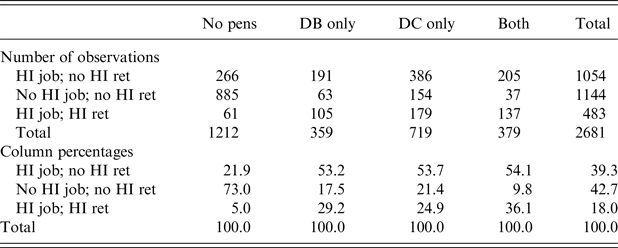
Descriptive data on the relation between pension coverage and the availability of employer-provided retiree health insurance are reported in Table 4. In the top panel, we find counts for pension outcomes against the availability of employer-provided retiree health insurance. For example, from the bottom row of the upper panel of Table 4, columns 1 and 5, we see that 45.2% (1212/2681) of the sample has no pension from their current job.
Pension plan coverage and plan type for pension from current job by health insurance coverage, Mid Boomers 2010
HI, Health Insurance.
The bottom panel of Table 4 reports the column percentages. From column 1, row 3, we see that only 5% of those with no pension on their current job have health insurance at work and in retirement. From column 1, row 2, almost three-fourths (73%) of those who do not have a pension on their current job also do not have either health insurance on that job or in retirement. Just over one-fifth of those without a pension (21.9%) has health insurance on the job, but does not have retiree health insurance. Looking across row 1 of the bottom panel from column 2 to 4, whatever the pension plan type, 53–54% of those with a pension have health insurance on the job, but do not have retiree health insurance. The next most likely outcome for those with a pension is to have both health insurance on the job and retiree health insurance. That probability is highest for those with both DB and Defined Contribution (DC) pensions at 36.1%. Of those with a DB plan only, 29.2% have employer-provided insurance both on the job and in retirement. In addition, 24.9% of those with a ‘DC plan only’ have health insurance both when working and into retirement. Roughly a fifth of those with a DB only or DC plan only have no health insurance either when working or retired (17.5% and 21.4%, respectively). Those who have both DB and DC pensions have only a 9.8% chance of having no health insurance both when working and when retired.
From the top panel of the table, we can also calculate the type of pension conditional on health insurance coverage on the current job and/or retiree health insurance (data not shown). The percentages of the currently employed with a DB pension only, a DC pension only, and both types are 13.4%, 26.8%, and 14.1%, respectively. (Similar results are found when plan type is computed for pensions from any job, not just the current job.) Half of those with retiree health insurance have a DB plan only, or both a DB and a DC plan on their current job (21.7 + 28.4). Yet of the total sample, only 27.5% have a DB plan, whether alone or in combination with a DC plan. Given the overwhelming evidence that DB pension incentives strongly influence retirement outcomes, this confirms the importance of controlling for the relationship between retiree health insurance and coverage by a defined benefit plan in retirement equations.
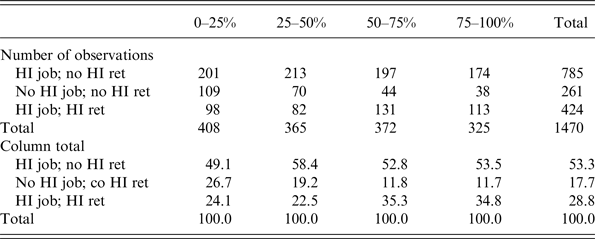
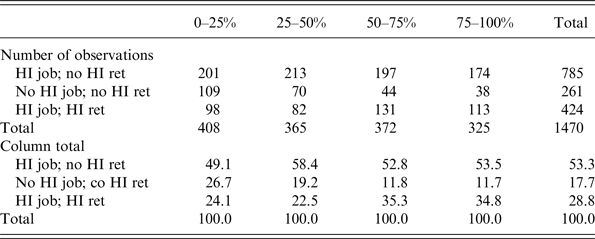
Instead of sorting individuals based on type of pension, Table 5 includes only those who are covered by a pension on their current job and sorts them by pension wealth quartile. The top panel reports the raw numbers in each cell, while the bottom panel reports the column percentages.
Employed respondents by type of health insurance coverage and pension plan wealth quartile, Mid Boomers with pension wealth for pensions from current job, 2010
HI, Health Insurance.
As pension wealth increases, so does the share of respondents who have both health insurance on the job and health insurance in retirement. From row 2 of the top panel, the number with no health insurance either on the job or in retirement declines as pension wealth increases.
Looking across row 3 of the bottom panel of Table 5, the percentage with health insurance on the job and in retirement rises from 24.1% of those in the lowest pension wealth category (column 1, row 3) to 34.8% of those in the highest pension wealth category (column 4, row 3).
From the row percentages (not reported here), 30.9% of those with retiree health insurance come from the third quartile of respondents ranked by pension wealth. Those falling in the highest pension wealth quartile account for a smaller share of those with retiree health insurance at 26.7%.
3 Health insurance coverage and actual retirement age
Levy et al. (Reference Levy, Buchmueller and Nikpay2015) studied the effects of ACA on actual retirements by relating the probability of retirement to the availability of ACA by state. We begin with a simple relation between observed retirements (an answer from the Current Population Survey type labor market status question in the HRS that the individual was retired in 2014 after having reported a job in 2010) and the type of health insurance held.
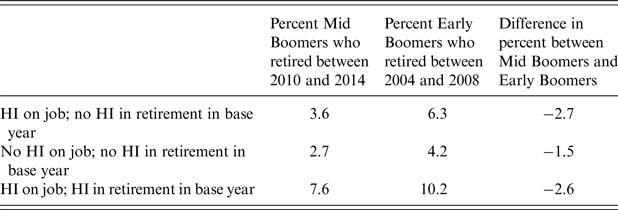
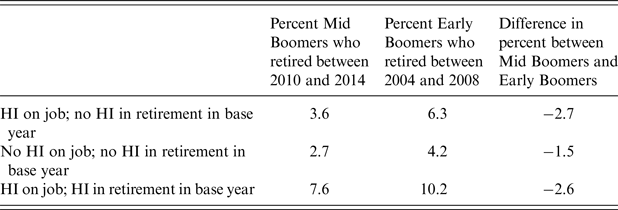
Table 6 reports retirement rates over a 4-year period for the three groups of employed, categorized by their employer-provided health insurance while working and when retired in the base period. Retirements for those in the Mid Boomer cohort are reported in column 1. Retirements by members of the Early Boomer cohort are reported in column 2. Differences in retirement rates between cohorts are reported in column 3. Note that differences in retirement between the cohorts may not be the result of the ACA. There are other differences between members of the cohorts that are not addressed in Table 6. We attempt to standardize for the effects of these differences in Table 7.
Percent who retired over 4-year period, Mid Boomer and Early Boomer cohorts
Sample is conditioned on having held job in base period.
HI, Health Insurance.
Probit of retired in 2008/2014 on health insurance dummy variable in 2004/20101
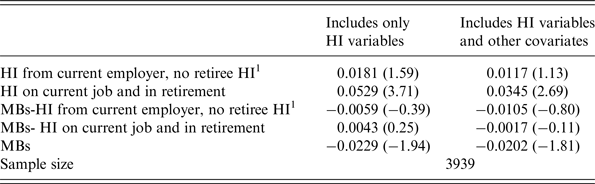
1 Marginal effects are reported in this table; t-statistics are in parentheses. Also included in each probit is a dummy variable indicating no health insurance coverage when working, but coverage when retired. That category includes only 58 observations. Other covariates included in column 2 measure gender, age, education, health, occupation, type of pension coverage, and whether the individual is looking for work. MB stands for Mid Boomers.
HI, Health Insurance.
There are two takeaways from Table 6, neither of which is very helpful in isolating the relation between ACA and retirement. First, looking down column 1, as one might expect if health insurance coverage were the only determinant of retirement, retirement is higher in the Mid Boomer cohort for those with health insurance both on the job and in retirement (row 3, 7.6%) than it is for those with health insurance on the job but not in retirement (row 1, 3.6%). But retirements are even lower for those with no health insurance on the job or in retirement (row 2, 2.7%). A similar relation is found for the Early Boomer cohort.
The second take away is from column 3. Here we compare changes in retirement over the 4-year age span between cohorts. If the results in Table 6 were produced by a natural experiment, the differences in column 3 would indicate the effect of ACA on retirement. The expectation would be that retirement rates would increase by more for those in row 1 of the table since ACA reduces their marginal incentive to stay at work, while it does not affect marginal incentives for members of other groups. In contrast to expectations, however, this comparison suggests that there is no difference in the absolute reduction in retirement over the period ACA was phased in between those who had employer-provided health insurance only on the job and not in retirement and those with health insurance both when working and when retired.
The fact that retirements were reduced for all three groups probably reflects the effects of the Great Recession. In particular, the labor supply response to that recession probably discouraged early retirements. In contrast, the policies adopted by employers to deal with downturn in demand are likely to have encouraged retirements, but those policies probably differed among employers offering different health insurance options. The changes in retirements observed in column 3 may be expected to reflect the joint effects of ACA and the different reactions to the Great Recession. In any case we can find no direct evidence in simple descriptive statistics that ACA accelerated retirements.
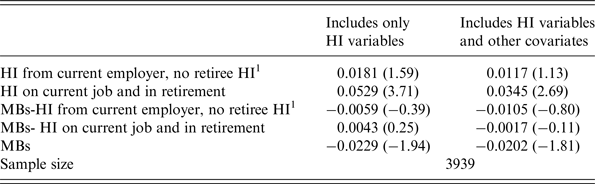
To further analyze the relation between health insurance type and actual retirement between 2010 and 2014, and over the analogous period for an older cohort, Table 7 presents the results of a probit analysis. Here we pool the samples from the Early Boomer and Mid Boomer cohorts and observe their retirement behavior from the year they entered the HRS until 4 years later. The dependent variable is 1 if the individual retired over the 4-year period, either between 2010 and 2014 for Mid Boomers or 2004–2008 for Early Boomers.
The differences in probability of retiring reported are derived from the coefficients estimated in a probit equation for interaction variables between cohort (Mid Boomer) and indicators of the type of employer-provided health insurance in the base period. The interaction variables reflect the difference in retirements between the Mid Boomers and the Early Boomer cohort. Dummy variables for cohort and type of coverage in the base period are also included. There are no other covariates in the probit underlying column 1, but covariates are included in the probit underlying column 2.
Those with health insurance on their current job but not in retirement, and those with health insurance both on the job and when retired, are more likely to have retired than those without health insurance either at work or in retirement. This result is consistent with the descriptive statistics in Table 6. However, neither interaction variable is significant. That is, we can find no statistically significant evidence that compared with Early Boomers, Mid Boomers with health insurance on the job, but with no retiree health insurance, were less likely to stay in the labor market as a result of ACA. Nor is this result changed when covariates related to demographics, education, health, pension coverage, and unemployment are included. Thus, we find no statistically significant evidence that ACA accelerated the relative retirement rates of those who, before ACA, had health insurance when working, but did not have retiree health insurance.
To be sure, the effects of ACA on retirements may have been obscured by major differences in employer behavior between the Early Boomers’ and Mid Boomers’ retirements. It might also be that not enough time has passed to see the basic effect of ACA on retirement. In view of these possibilities, we turn to alternative approaches to estimating the effects of ACA on retirement.
4 Health insurance coverage and expected claiming and retirement ages
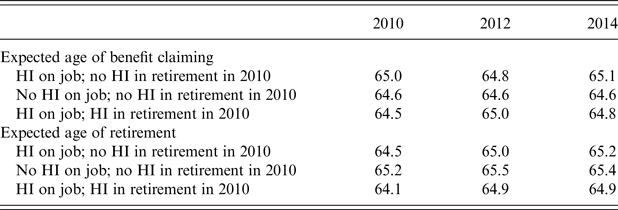
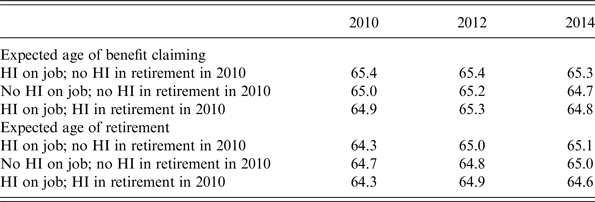
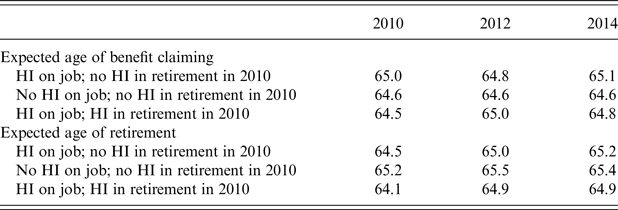
To set the stage for our analysis of the effects of ACA on retirement in the intermediate term, in Table 8, we report the expected ages of claiming Social Security benefits (or the expected retirement age – the age at which the individual stops work entirely) from 2010 through 2014.Footnote 12 We then relate expected ages of benefit claiming, or retirement, to health insurance coverage in 2010.Footnote 13 Consider Table 8, column 1, row 1, in the top panel. On average respondents with health insurance on the job but not in retirement in 2010 expected, as of 2010, to claim benefits at age 65.0. From column 1, row 2, respondents with no health insurance either on the job or in retirement expected to claim benefits at 64.6. Thus, respondents who in 2010 had health insurance on the job, but not in retirement, expected to claim their Social Security benefits 0.4 years later than those with no health insurance on the job, or in retirement. A person with health insurance on the job but not in retirement also expected to claim benefits half a year later than someone with health insurance both on the job and when retired (65.0 vs. 64.5).Footnote 14
Expected ages of social security benefit claiming and retirement, weighted1
1 2010 weights. Includes only respondents who held a job in all 3 years.
HI, Health Insurance.
The lower panel in Table 8 indicates the age of expected retirement for those with different health coverage. From column 1, reporting expected retirement ages (not claiming ages) as of 2010, we find those with health insurance on their current job, but no health insurance in retirement, expected to retire seven-tenths of a year earlier than those with no health insurance either on the job or in retirement (64.5 vs. 65.2). They expected to retire 0.4 years after those with health insurance both at work and in retirement (64.5 vs. 64.1).
Next compare results between the two panels in Table 8, beginning with row 1, column 1 in each panel. This comparison suggests that the relation of type of health insurance to Social Security claiming age differed somewhat from the relation of type of health insurance to expected retirement age. Those with health insurance on the job and no health insurance in retirement in 2010 expected to claim their Social Security benefits at age 65, half a year after they retired. Those with no health insurance on the job and no health insurance in retirement expected to claim benefits 0.6 years before they retired, while those with health insurance both on the job and in retirement expected to retire four-tenths of a year before they claimed their benefits.
Next consider the statistics relevant to the effects of ACA on age of benefit claiming or retirement expectations. Compare the expected ages of claiming or retirement in 2010 with the expected ages in 2014. There was little change in the expected age of Social Security benefit claiming. More importantly, the movement in the expected age of retirement is in the opposite direction of what was expected from changes in ACA. If no other influences were operating except for the change in ACA, both the expected age of claiming and of retirement should decline for those who had health insurance on the job, but not in retirement. Instead, from the lower panel, first row, between 2010 and 2014, the expected age of retirement increased by seven-tenths of a year for those who had health insurance when working, but no retiree health insurance.
To be sure, the increase in retirement age in all categories may reflect an adjustment to capital losses and job losses suffered during the Great Recession. However, the increase in expected retirement age for those with health insurance at work but not in retirement was larger than the increase observed for those who had no employer-provided health insurance from their employer while working, or in retirement.
Clearly the descriptive statistics on changes in expected retirement age conditional on initial health insurance coverage are not sufficient to test the underlying effects of health insurance availability on retirement. There are many considerations beyond the availability of health insurance that drive the claiming and retirement decisions. If these are systematically related to the availability of health insurance on the job and/or in retirement in 2010, we will not observe the expected relationship between health insurance and retirement in simple descriptive statistics. To isolate the effects of health insurance availability at work and in retirement on retirement outcomes, it will be necessary to take account of the role of pensions and other covariates that are correlated with the availability of health insurance and are also correlated with retirement outcomes. Accordingly, we turn to multivariate regressions of changes in expected retirement age on initial health insurance coverage.
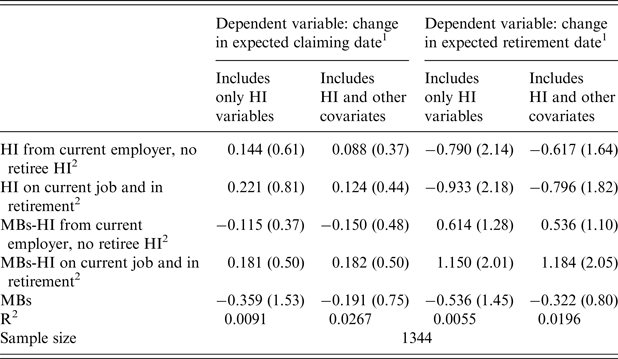
The sample underlying Table 9 includes members of both the Early and Mid Boomer cohorts. It is restricted to those who reported a claiming or retirement age in the initial and final years, either 2004 and 2008 for the Early Boomers, or 2010 and 2014 for the Mid Boomers. To be included, the respondents could not have answered ‘don't know’ or ‘refuse’ when asked about their expectation. Table 9 is also restricted to respondents who in the initial year they were in the survey reported they expected to claim benefits or retire at age 65 or earlier, since ACA only affects availability of health insurance when retired for those under 65. The first two columns in Table 9 report results for regressions with the expected claiming age as the dependent variable. The next two columns report results where expected retirement age is the dependent variable.
Change in expected dates of claiming and retirement for Early and Mid Boomers
t values are in parentheses. Sample restricted to those who reported expected claiming or retirement age of 65 or below.
1 Covariates include variables measuring gender, age, education, health, occupation, and type of pension coverage.
2 The omitted category is no health insurance on the current job and no retiree health insurance.
HI, Health Insurance; MB, Mid Boomer.
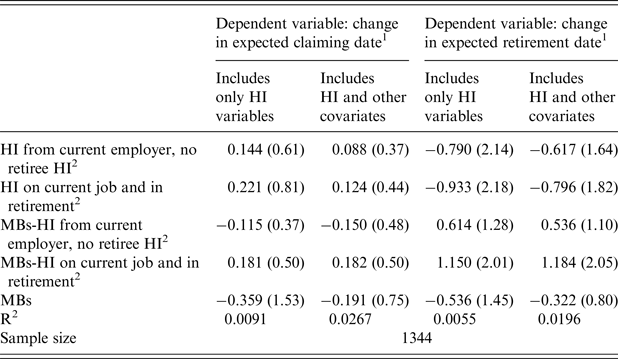
In all cases, the key independent variable is a dummy variable indicating that the individual had health insurance at work but not in retirement, interacted with an indicator that he or she was a member of the Mid Boomer cohort. The coefficients on this variable are reported in row 3. Once again, for purposes of difference-in-difference analysis, other health insurance dummy variables in all regressions include an indicator of coverage in the base period on the job but not in retirement, an indicator of coverage both on the job and in retirement, an indicator of membership in the Mid Boomer cohort, as well as the interaction between coverage on the job and in retirement with an indicator the individual is from the Mid Boomer cohort. The multiple regressions in columns 2 and 4 also include variables measuring gender, age, a series of dummy variables measuring schooling, education, health, occupation, and type of pension coverage.
The fits for all regressions are very poor. The coefficients reported in row 3, columns 3 and 4 are in the wrong direction, suggesting that compared with those with no health insurance on the job or in retirement, ACA would increase the expected retirement date for those with health insurance on the job but not in retirement. This small effect is not statistically significant, however. The coefficients in the regressions for expected claiming age are very near zero and also are not statistically significant.
The bottom line is that there is no statistically significant evidence that ACA has affected retirement intentions.
Once again, it is possible that too short a time has passed for ACA to have affected retirement expectations, especially since many in the sample would have been a number of years away from retirement, even in 2014. Reoptimization may take time, and not enough time may have passed for plans to have been fully readjusted.
It is also possible that the new incentives were not yet fully understood. Learning may take time, or the time period may have been too short to allow other adjustments, such as the additional saving required if retirement is to be accelerated; or as the dynamics of health insurance coverage examined in Section 2 suggest, the specification of the expected retirement date equation may be too simple. When we allow for other sources of health insurance coverage, type of employer-provided health insurance in 2010 may be an imperfect measure of the incentive facing some individuals. This error in measurement may obscure a true effect of ACA on retirement.
To further investigate the reasons for this finding in the intermediate term, we now turn to an analysis of a structural model that has been useful in explaining various discontinuities in the retirement hazard, and the relation of non-linear retirement incentives to retirement outcomes.
5 A simulation analysis based on a structural model
Our structural analysis simulates the effects of the ACA on retirement. The basics of the model include the following. The model is dynamic. Life expectancy and health are stochastic. There is considerable heterogeneity built into the utility function. Time preference and preference for leisure over work differ among individuals. Although time preference varies among individuals, time preference is assumed to be constant over time for any individual. Leisure preferences can change after retirement, possibly inducing some individuals to return to work after an initial period of retirement.
The budget equation includes earnings in full- and part-time employment, detailed specification of formulas governing employer-provided pension plans, Social Security benefit rules, health insurance and health expenditures, and spouse's income. Because the analysis explicitly models the incentives from defined benefit pensions, it avoids a fundamental mistake of studies that focus on retiree health insurance, but ignore or mismeasure the accrual profiles of each individual's DB pension. Typically such studies attribute some of the (omitted) effects of DB pensions on retirement to retiree health insurance.
A point of emphasis is the relationship between detailed health outcomes, health risks, wealth, and retirement. The health section of the model includes several individual health behaviors, such as smoking, drinking, and obesity, as well as the effects of several medical conditions, such as diabetes, heart problems, and lung problems. These help to determine the health status of an individual, which can change over time. The health status, in conjunction with the individual's insurance status, determines the distribution of out-of-pocket health costs. In the model, there is also a consumption floor that provides implicit insurance.
The retirement model incorporates uncertain asset returns and uncertain life expectancy. Other sources of uncertainty include health status, job loss, Social Security Disability Insurance (SSDI) availability, medical expenditures, and nursing home expenditures.
Within this framework, individuals make labor force choices and savings choices to maximize expected utility over time. Maximization of utility, subject to the budget constraint over the life cycle, governs the retirement decision and the decision to increase work effort once retired.Footnote 15
Description of the structural modelFootnote 16
The retirement model starts out with a basic recursive expected utility function
 $${\rm E(}{\rm U}_{\rm t}{\rm \vert} {\rm S}_{\rm t}{\rm )} = \mathop {{\rm max}}\limits_{{\rm C}_{\rm t}{\rm,}\, {\rm L}_{\rm t}} {\rm [u(}{\rm C}_{\rm t}{\rm,}\, {\rm L}_{\rm t}{\rm )} + {\rm e}^{ - \rho} {\rm E(}{\rm U}_{{\rm t} + {\rm 1}}{\rm \vert} {\rm S}_{\rm t}{\rm,}\, {\rm C}_{\rm t}{\rm,}\, {\rm L}_{\rm t}{\rm ),}$$
Where C is consumption and L is the leisure of the husband. L can take on three values: zero (full-time work), ½ (partial retirement work), and unity (complete retirement). ρ is the time preference rate, and S is the set of state variables. The utility function u(Ct, Lt) is given by
 $${\rm u (} {\rm C}_{\rm t}{\rm,}\, {\rm L}_{\rm t}{\rm )} = \displaystyle{{\rm 1} \over \alpha} {\rm C}_{{\rm t}} ^\alpha + \displaystyle{{\rm 1} \over {\rm \gamma}} {\rm} {\rm e}^{{\rm} \beta {\rm} {\rm X}_{{\rm t}} + {\rm} \varepsilon _{\rm t}}{\rm L}_{\rm t}^\gamma. $$
The variables in X include a constant, a linear term in age, and dummy coefficients for fair health, poor health, and terrible health (good health is the omitted category). ε is a term reflecting the relative desirability of leisure (as opposed to work).
The state variables include the level of assets, family structure (whether one or both spouses have survived), health state, medical conditions (including SSDI eligibility), whether the individual is still in the main job, pension and social security amounts, and the relative value of leisure. The transition equation for assets is given by
 $${\rm A}_{{\rm t} + {\rm 1}} = \left( {{\rm 1} + {\rm r}_{\rm t}} \right){\rm}\,({\rm A}_{\rm t} + {\rm w}_{{\rm t},{\rm L}}{\rm L}_{\rm t} + {\rm S}_{\rm t} + {\rm P}_{\rm t} + {\rm I}_{\rm t} + {\rm T}_{\rm t} - {\rm}{\rm C}_{\rm t} - {\rm}{\rm M}_{\rm t} - {\rm}{\rm N}_{{\rm t })}.$$
r is the rate of return on assets and is stochastic with a distribution mimicking a portfolio of roughly half stocks and half treasury bills. w is the wage rate and depends on the amount of labor supplied and whether the husband is still in his long-term, full-time job; part-time work and a break in full-time employment will generate lower wage rates. S is the total amount of Social Security benefits for the couple, adjusted for the earnings test if applicable. S also includes SSDI payments for those on disability and below the full retirement age for Social Security. P is the amount of pension benefits received. For individuals retired from defined benefit pension jobs, the amount of the pension payments and the age they are available are calculated according to the plan rules. Individuals with defined contribution plans have their contribution amounts compounded over time at the same stochastic rate of return that applies to other assets, and the entire balance is made available on the retirement date. I is other income and includes the wages and pension receipts of the wife, which as noted above are assumed exogenous for reasons of computational tractability. M represents the stochastic medical expenses for uninsured individuals before the Medicare eligibility age.Footnote 17 N is the amount of stochastic nursing home expenses which are incurred by a spouse who passed away at the end of the previous year.Footnote 18 A is constrained to be non-negative; if the sum of assets plus income less medical and nursing home expenses is insufficient to meet a minimum consumption standard, the household receives enough transfers T to bring consumption up to a minimal level ($4,000 in 1992 dollars).
The probabilities for transitions for family structure changes, among the health states and medical conditions, and into SSDI follow equations depending on current health states and medical conditions. Transitions for Social Security benefits and pension amounts depend on current employment and follow the Social Security and pension plan rules and, for defined contribution amounts, depend on the stochastic rate of return. The value of ε, the relative desirability of retirement, is fixed until retirement, but thereafter it changes to reflect changes in the desirability of retirement once the individual has actually experienced it.
The model was previously estimated for individuals in the original HRS cohort, ages 51–61 in 1992. In the estimation, the model considered consumption as endogenous from ages 25 to 99. To ease the computational burden, however, the model considered work history and the associated earnings prior to age 50 as exogenous at the values observed in the Social Security earnings records. The estimation procedure in essence chooses individual time preferences, so that the wealth for each individual matches the observed amount, and chooses the remaining parameters, so that the modeled sequence of work decisions during the survey years best matches the observed sequence of work decisions in the aggregate.
The individuals in the original cohort of the HRS are now in their 70s and 80s, however, well past retirement age. To make the current simulations more relevant to individuals on the cusp of retirement today, several changes have been made to the budget sets for the individuals in the sample. First, the full retirement age for Social Security has been set to 66. For most of the individuals in the original HRS cohort, the full retirement age was 65, but for individuals currently retiring, it is 66. For the same reason, the value of the delayed retirement credit has been adjusted to 8% for the entire sample; it was considerably less for most of the members of the original HRS cohort. Third, the earnings test has been eliminated for individuals above the full retirement age, reflecting a change in the law in 2001. Finally, for individuals who had only a defined benefit pension, 43% of them were randomly reassigned to have a defined contribution pension. This roughly reflects the change in the pension environment between the original HRS cohort and the more recent Early and Mid Boomer cohorts who are currently in the age range where they are making retirement decisions.
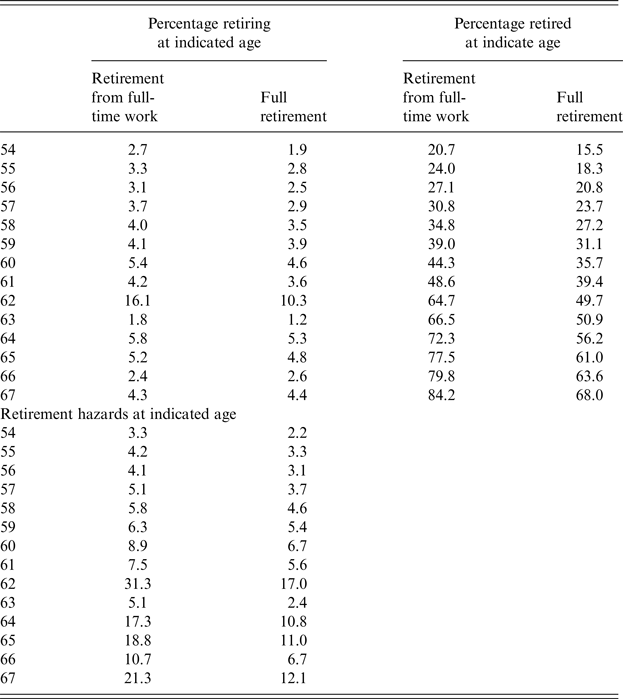
The results of the base simulation, which omit the effects of the ACA, are shown in Table 10. The last two columns at the top of Table 10 give the simulated percentages of individuals who are retired from full-time work and who are fully retired, by age. The first two columns in the top part of the table give the increase in the percentages of individuals in the associated retirement state. For instance, at age 61, 48.6% of the individuals are simulated to be retired from full-time work, and at age 62, 64.7% are simulated to be retired. The difference, 16.1%, is the net increase in the number of individuals retired from full-time work. It is the net flow of individuals who are newly retired from full-time work less the individuals who were not working full-time at age 61 but have returned to full-time work at age 62. The bottom of the table indicates the hazard rates for retiring at the indicate ages. As expected, the hazard rate has a sharp peak at age 62, the Social Security early entitlement age, and a secondary peak at age 65, the Medicare eligibility age.
Retirement percentages in baseline simulation

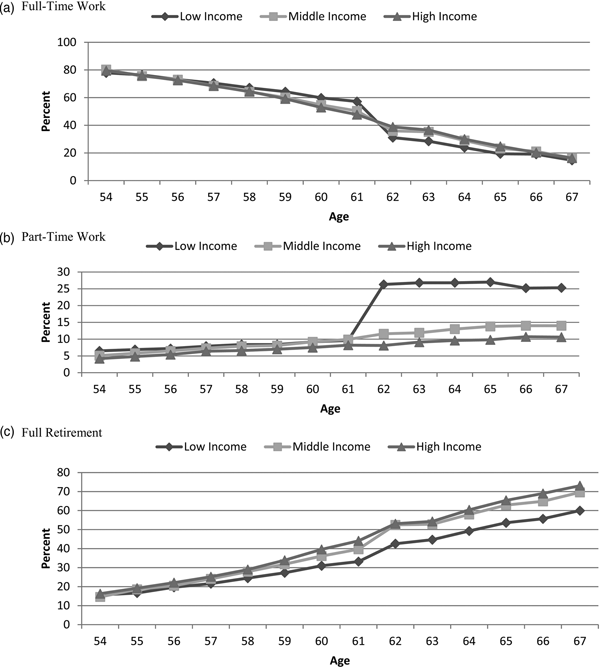
Figure 1, panels A, B, and C break down the percentages of individuals working full-time, part-time, and not working at all by lifetime income status. To do so, we calculated the potential lifetime income from the Social Security records and divided the sample roughly into thirds. Panel A shows that those in the lower income group are more likely to be working full-time until they reach the eligibility age for Social Security, at which time they become less likely to engage in full-time work. In panel B, the lower income group is simulated to have much higher rates of part-time work after reaching the Social Security early entitlement age. Part-time work may be more attractive to low earners because the wage penalty for part-time work vs. full-time work is not nearly as severe for lower wage workers. Conversely, higher income individuals are much less likely to be in part-time work, implying that they have a much greater probability of moving from full-time work to full retirement.
Percentage in each retirement status by income group in the base simulation.

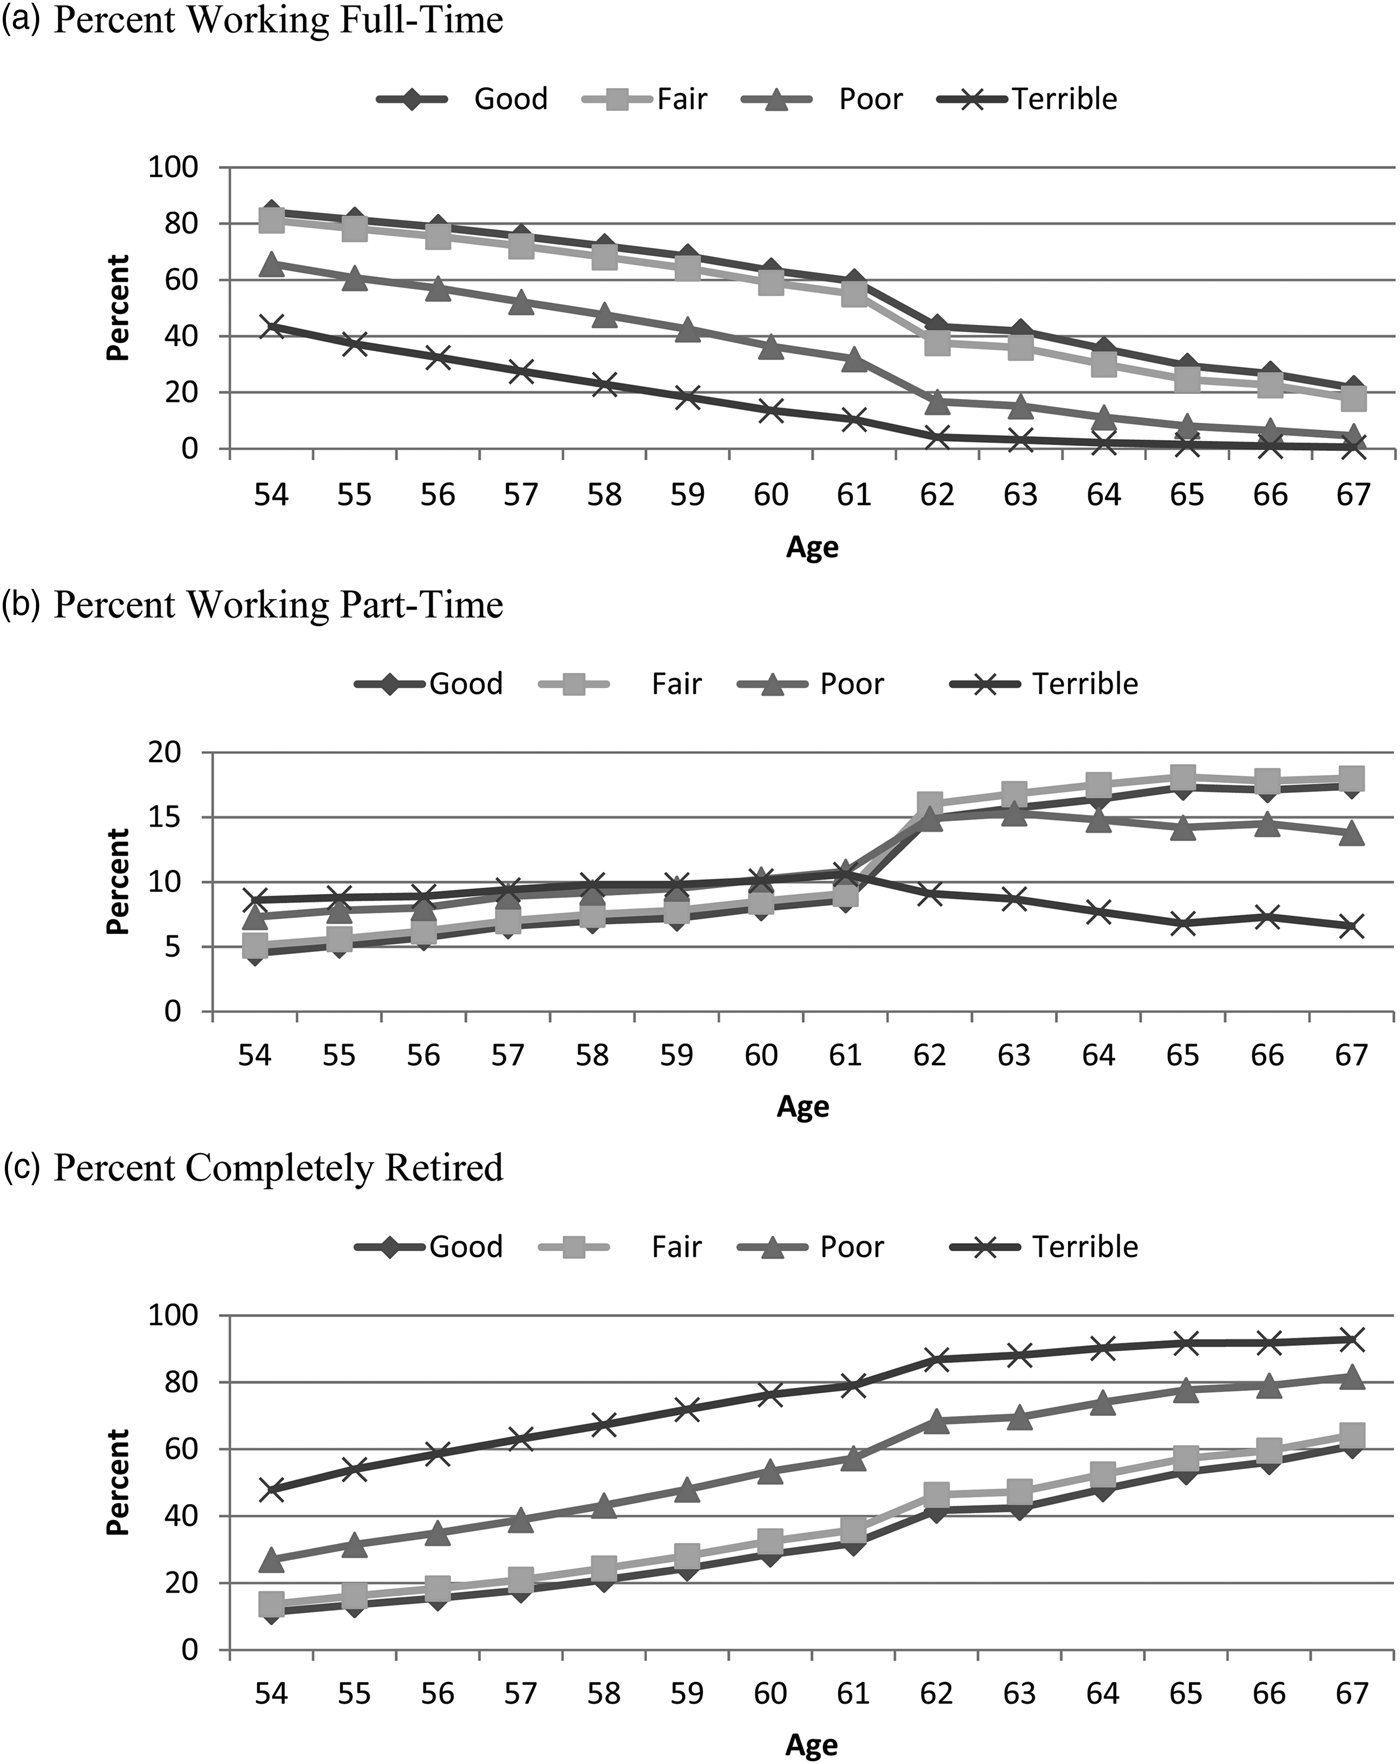
Figure 2 is similar to Figure 1, except that here the breakdown is by current health status rather than lifetime income group. Health status is derived from a combination of mobility limitations, pain levels, activity of daily living (ADL) limitations, and self-assessed overall health. Fair health is generally associated with one or two mobility limitations, while poor health is associated with several mobility limitations but zero or one ADL limitation. ‘Terrible’ health is associated with multiple ADL limitations. As expected, the worse the health status, the lower is the percentage of full-time work and the higher is the percentage of full retirement. The difference between the good and fair health states is not as dramatic as the difference between fair and poor health, or between poor and terrible health.
Percentage in each retirement status by health group in the base simulation health status.

Figure 3 begins the exploration of the effects of introducing the ACA. As discussed in the descriptive analysis, there are basically three groups that are relevant to the ACA. The first group is those who have no insurance on their current job and therefore no insurance in retirement. This group is simulated to have insurance after the ACA is introduced, and in the model, this means that their medical costs are largely eliminated relative to the base simulation. The second group is those who have insurance on the job but no retiree health coverage. This is the group that is subject to the situation frequently called ‘job lock’, where they feel that they have to keep on working in order to keep their insurance. As noted previously, one would expect to find the largest effect of the ACA on this group, since after the introduction of the ACA, this group will no longer feel that they have to continue working in order to keep health insurance. The third group is those who have health insurance in their job, and this insurance will continue when they are retired up to the Medicare eligibility age. The ACA will have only a small if any effect on the retirement behavior of this group.
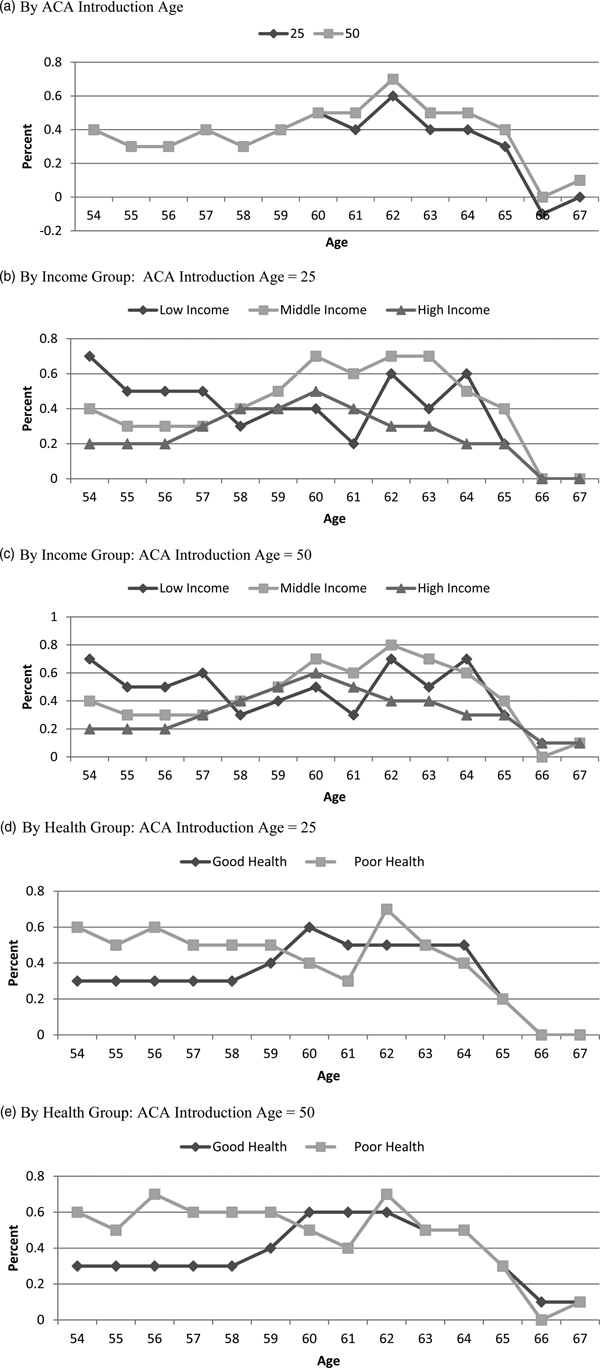
Percentage point increase in retirement from full-time work due to introduction of ACA for sample originally with insurance while working but no retiree coverage. By ACA introduction age.

Figure 3 relates to full-time work by individuals who have insurance in their job but no retiree insurance, that is, the individuals subject to job lock. The first panel pertains to two scenarios in which the ACA is introduced at different ages. In one scenario, the ACA is introduced at age 25. Since the simulations start at age 25, this simulation corresponds to the effects of a fully anticipated ACA over the full lifetime. The second scenario supposes that the individual is aged 50 at the time the ACA is introduced. Prior to those ages, the individuals had not anticipated the ACA and had made savings decisions as though there would be no ACA. This means that wealth at age 50 is the same as under the base simulation. After age 50, however, the labor force and consumption decisions are made with consideration of the ACA, and these decisions will in general deviate from the decisions in the base simulation.
The numbers underlying Figure 3 are the percentages of individuals retired from full-time work in the relevant simulation with ACA minus the percentage of individuals retired from full-time work in the base simulation, in which there was no ACA. In general, these percentages are relatively low, but even more interesting for the present research is that these percentages do not move much with the age that ACA is introduced. That finding holds not only for the comparison of retirements where ACA is introduced at ages 25 and 50, but also holds for simulations where ACA is introduced at age 55 or 60 (not shown).
This last result is perhaps a bit surprising, so it may be useful to ask what might be generating it. The answer appears to be in the response of saving to the relatively small probability of encountering high health costs before age 65, when Medicare kicks in. Another way to ask the question is to think about how much of saving is attributable to the prospect of having high medical expenses before age 65. Since the probability of these expenses is fairly small, the answer is probably not much. In response to the possibility of realizing these expenses, there are two possible outcomes. One is to accumulate resources before the expenses, and the other is to adjust consumption after the expenses. These results seem to indicate the latter, that is, cumulative saving is probably not that much different, especially relative to retirement saving, whether or not ACA has been around for a long time.
This does not imply that ACA had no effect on retirement. The ACA had some wealth effect because it offsets some potential future expenses, and it also reduces the value of current employment somewhat for individuals currently covered in their jobs but not as retirees, since with ACA they would be covered anyway even if retired. Both of these effects reduce incentives for full-time work, which is what the table suggests. But if the effect is coming from these considerations and not from accumulated savings, then the magnitude of the effect will not depend very much on the length of time since the ACA was introduced.
Panel A of the figure deals with the overall sample of those with insurance while working but without retiree health insurance. Panels B and C deal with the three income groups within this overall sample. One might expect individuals in the lowest income group to have the largest effect, but this does not seem to be the case. One explanation is that individuals with low incomes are more likely to have little savings, and if high medical expenses arise, they fall back on the safety net (Hubbard et al., Reference Hubbard, Skinner and Zeldes1995), which for the purposes of these simulations takes the form of a minimum consumption standard. The middle-income group is less likely to follow this route, so their response to the ACA is a bit more pronounced. For the high-income group, on the other hand, medical expenses (which are assumed to be dependent on health status but not on income) are a smaller percentage of income, and hence the responses will be more muted.
Panels D and E of Figure 3 deal with the responses of those in good health and those in poor health. One might expect the group in poor health to be more responsive to the introduction of the ACA, and that does indeed seem to be the case. Individuals in poor health face higher medical expenses and would be more reluctant to give up full-time jobs and expose themselves to these expenses without the ACA. With the ACA, however, this disincentive to retire disappears, and they are therefore more likely to increase their retirement rates relative to those with lower medical expenses. Even here, though, the effect is not large.
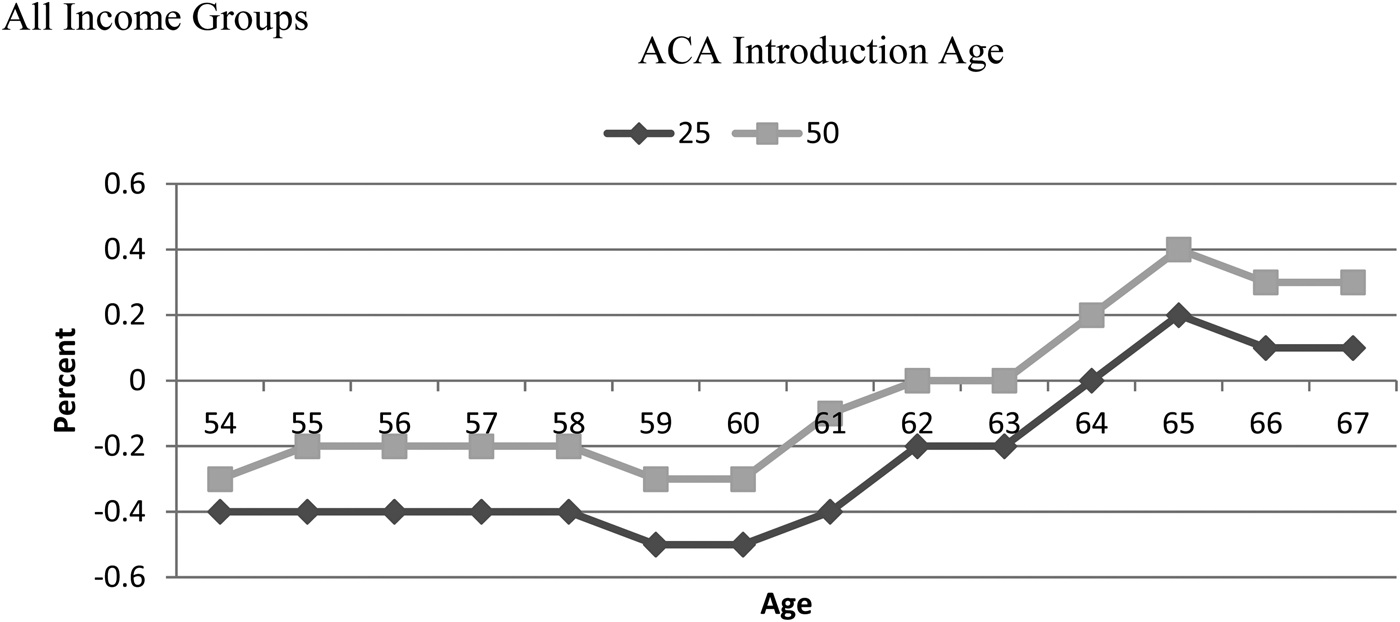
Figure 4 looks at increases in retirement from full-time work for the sample whose individuals are not covered by health insurance either in their job or in retirement, that is, for those who are not covered at all in the absence of the ACA. In these simulations, a rather unexpected pattern emerges: with the ACA, these individuals are simulated to reduce retirement from full-time work before about age 62, but increase it thereafter. That is, before age 62, they actually increase full-time work in the presence of the ACA.
Percentage point increase in retirement from full-time work for sample with no insurance coverage.

One explanation for this pattern relies on the fact that the bulk of individuals with no insurance on their full-time jobs are relatively low-wage workers with relatively little, if any, savings. If they leave work before age 62, the Social Security early entitlement age, their alternative may be to rely on the minimum consumption standard, in which case their medical expenses are effectively covered. If they work, however, they must pay their medical expenses out of their earnings, which effectively reduces their compensation from which they can purchase other consumption goods. In essence, for this group, they are insured if they leave their full-time jobs but not if they remain in their jobs. Introducing the ACA reduces the medical expenses they incur if they remain in their jobs and hence effectively increases their compensation, which in turn induces them to increase their full-time work.
At age 62, however, they are eligible for Social Security, and the medical expenses do in fact reduce the amount available for consumption regardless of whether or not they are working. At this point, the ACA no longer alters the relative incentives between work and retirement, and the remaining incentives have to do with the income effect of the ACA. These incentives work in the direction of inducing earlier retirement, so the signs of the effects of the ACA tend to change around the time of the Social Security early entitlement age.
When we examined the three income groups separately, it is evident that the middle-income group of the sample with no insurance exhibits the greatest effect of the introduction of the ACA. In the face of high medical expenses, low-income workers are more likely to be driven to the minimum consumption standard than are middle-income workers, and at that point they become effectively insured. High-income workers, on the other hand, are proportionately less affected by medical expenses and hence have a relatively low response to the introduction of the ACA.
We also repeated the exercises looking at full retirement rather than retirement from full-time work. The effects of the ACA on full retirement seem to follow the same general patterns as for retirement from full-time work. For individuals with retiree health insurance, the introduction of the ACA has no effect in the model, since they are covered in any case. Hence we do not present figures comparable to Figures 3 and 4 for this group.
6 Conclusions
Simulations based on a structural model of retirement and saving suggest that the group subject to the largest marginal effect on their retirement incentives from ACA – those who initially had health insurance at work but not in retirement – would eventually have increased their retirement as a result of passage of ACA. But the reduction in work effort for this group, at 0.4 percentage points would be quite modest. The reduction in work effort for all three groups together – those with health insurance on the job but not in retirement, those with health insurance both on the job and in retirement, and those with no health insurance either on the job or in retirement – would be even smaller. For those aged 50 at the time ACA was introduced, the overall reduction in full-time work over the age span 54–65 is simulated to be only a little over 0.1 percentage points. These simulations also suggest that the period of adjustment to a change in the law will be relatively short.
Empirical data indicating the actual changes in retirement and retirement intentions observed to date are consistent with the simulations based on the structural model estimated with pre-ACA data. There is no statistically significant evidence in HRS panel data that respondents who initially had health insurance at work, but not in retirement, have begun to retire early as a result of ACA. Nor is there evidence of changes in expected retirement dates and dates of claiming Social Security as a result of adoption of ACA.
The simulations based on the structural model lead us to expect only small changes in retirement as a result of ACA, even in the long term. It is, however, possible that if ACA had been in place for a while, changes might be found in actual and expected retirements. The strong penalties for not conforming to ACA had only just come on line at the time of the HRS survey of Mid Boomers in 2014. Consequently, people may not yet have focused on the implications of the law for their looming retirement, and therefore may not have changed either their retirement behavior or their retirement intensions in response.
In sum, we did not uncover any evidence to suggest that ACA will have large effects on retirement. Thus, the effects of ACA on retirement would, at most, have only a minor influence on any evaluations of ACA.
This suggests that any redesign or replacement of ACA in the Trump Administration need not treat retirement effects as a major concern affecting decisions on how best to proceed. Whatever major concerns there are shaping the legislation, potential impact on retirement may be taken as a second-order effect.
Appendix
Appendix 1: Description of the estimation of the structural modelFootnote 19
The solution to the model follows the usual backwards induction method commonly applied to such models. At the oldest possible age in the life cycle (99 in this model), utility is calculated for each combination of the state variables; state variables that are continuous (asset levels, defined contribution balances, Social Security and defined pension benefits, and the weight on leisure) are discretized for this purpose. Since everyone is assumed to be retired at this age, the utility simply depends on consuming the available assets plus income. The calculations then shift to the next to the last age. The expected value of assets left at the end of this period is calculated, taking into account the transition probabilities into the following period. Values of utility in the following period are interpolated for the continuous variables if necessary. Then the individual decides on current period consumption and leisure, taking into account current utility and the value of the resulting state variables which arise as a result of the consumption and leisure decisions. This process is repeated each year back to the beginning of the individual's economic life. The model, in short, is an extended table showing how the individual will choose consumption and leisure at each age, given the state variables available to him at that time. The state variables, in turn, evolve according to the decisions and the stochastic processes in the model.
Number of respondents by the source of insurance for Early Boomers in 2004 and 2008 – same sample1

Expected ages of social security benefit claiming and retirement, weighted1

The first step in estimating the retirement model is to specify which parameters are to be estimated and to provide a framework for estimating them. Parameters having to do with the budget set have been discussed previously. This leaves the parameters of the utility function, which include α, β, γ, ε, and ρ. α is a scalar parameter reflecting the marginal utility of consumption, and β is a vector whose values give the weight of leisure in the utility function. In this work, β includes terms for a constant, age, and three categories of the health status (fair, poor, and terrible). The omitted health status is good. The remaining parameters are considered to be individual effects, treated either as fixed effects or random effects.
γ governs the marginal utility of leisure. We take γ as a random effect, so that the values of (½)γ, which must logically lie between ½ and 1 in order to satisfy diminishing marginal utility, come from an exponential distribution with an exponential coefficient given by γ o + γ a age. The age term is included to account for the fact that as individuals become older, partial retirement work appears to become more attractive relative to full-time work.
ε reflects the value of leisure relative to consumption and is also taken as an individual effect. Econometrically, it is treated as a random effect with mean zero and variance σ ε. High values of ε are associated with an increased valuation of leisure and a relatively early retirement age. Lower values are associated with a reduced valuation of leisure and a relatively late retirement age. It is assumed that the individual knows the value of ε, which stays fixed until the individual actually leaves full-time work. After retirement, the values of ε are stochastic with a year-to-year correlation of ρ ε.
ρ, the time preference rate, which is a central parameter in this model, is taken as a fixed effect. Given the values of the other parameters of the model, ρ is taken as that value for which the model yields an asset value equal the observed value of assets as of a specific date. The treatment of ρ as heterogeneous among the population permits the model to reflect realistically the fact that even among groups with similar lifetime incomes, there is a wide variation among the level of assets they have accumulated at any given point in their life cycles.
In the end, then, there are ten parameters to be estimated for the model: the consumption exponent α, five parameters in the vector β (a constant, the coefficient of age, and three coefficients of health status), two values of γ determining the distribution of partial retirement preferences and its evolution as the individual ages, the variance σ ε of the preference for leisure, and the correlation parameter ρ ε which governs how the preference for leisure evolves after retirement. The model also estimates a separate value of ρ for each individual, and the distribution of this parameter over the population is also of interest.
There are stochastic processes governing mortality, medical condition transitions, health status transitions, returns to assets and defined contribution balances, layoffs, changes in the value of leisure after retirement, health care expenditures, and end-of-life nursing home expenses. In addition, there are random effects whose value is known to the individual but not to the researcher, including the initial value of leisure (ε) and the relative value of partial retirement (γ).
The state variables, which specify how the decisions and stochastic events at one age affect the possibilities at later ages, include the mortality experience of the family (whether one or both spouses have survived), any medical conditions which have arisen, the health state, the amount of assets, whether the individual is still in the main job, and the value of leisure. If the individual is still in the main job and that job has a defined contribution pension, a state variable specifying the defined contribution balance comes into play. When the individual leaves the main job, any defined contribution balance is combined with the other assets, but additional state variables are added specifying the level of defined benefit pension benefits, if any, and the level of Social Security benefits. Before the individual leaves the main job, state variables for pension and Social Security benefits are unnecessary because these amounts are implied by the fact that the individual is still in the main job.
The decision variables are the level of work effort and consumption. If the individual was in the main job the previous period, the work choices are to continue in the main job or to enter partial or full retirement. The individual may also leave the main job for other full-time work, at a lower wage which reflects the loss of tenure, if the parameters of his pension plan make it advantageous to do so. If the individual has previously left the main job, the choices are to return to full-time work or to partially or fully retire. To limit the computational burden, individuals are assumed to work full-time before age 50 and to retire completely by age 70. Given the work decision, the consumption decision is also effectively the savings decision.
The ten parameters of the model are estimated using the method of simulated moments (MSM). There are 10,000 simulations which result in a distribution of the retirement probabilities very close to the theoretical probabilities. The moments for that individual are simply the difference between the observed retirement states and the theoretical probabilities, gathered into a vector mi. These are summed over the sample to be  ${\bf m} = \sum _{{\rm i} = \,{\rm 1}}^{\rm n} {\bf m}_{\rm i}$. The estimation procedure seeks to minimize.
q = m′W−1m, where 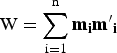 ${\rm W} = \sum _{{\rm i} = {\rm 1}}^{\rm n} {\bf m}_{\bf i}{\bf {m}^{\prime}}_{\bf i}$. Variances of the estimates are calculated from
var(Θ) = [G′W−1G]−1, where Θ is the vector of parameters and G is the derivative of the moments with respect to the parameters. If the model is correctly specified, m is distributed around zero, and q should have a χ 2 distribution with λ – k degrees of freedom, where λ is the number of moments and k is the number of parameters estimated.
The estimates use 63 moments related to retirement in various circumstances. Thirteen of the moments relate to full-time work between the ages of 54 and 66. There are a number of sets of moments that look at work at five relatively critical ages: 55, 58, 60, 62, and 65. These include moments for any work (full-time or partial retirement), full-time work by individuals in the lower third of the lifetime income distribution, full-time work by individuals in the upper third of the lifetime income distribution, full-time work by those in fair health, in poor health, and in terrible health, and any work (full-time or partial retirement) by those in fair health, in poor health, and in terrible health. Finally, there are five moments indicating whether the individual moved from a state of less work to a state of more work between successive surveys, such as returning to full-time work after partial retirement or moving from full retirement to partial retirement. For each of these moments, only observations for which the respondent was observed at the specified age and, if appropriate for the moment, at the specified level of lifetime income or the specified health status, are included.
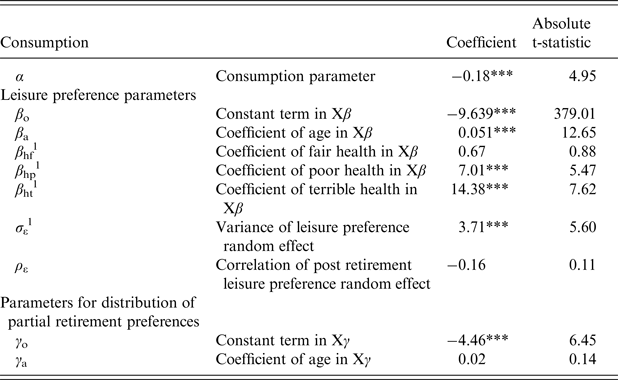
Table A3 presents the estimated parameters from applying the MSM to the sample of HRS individuals. Most of the estimated coefficients are significantly different from zero, and all of the critical parameters of the model appear to be fairly precisely estimated. From the standpoint of the effectiveness of economic incentives, the critical parameter is β a, the coefficient of age. A high value of this parameter means that leisure preferences are shifting rapidly around retirement and leaves relatively little room for economic incentives to have an effect; a low value suggests the reverse. The estimated value is in fact fairly low, which means that things like pension and Social Security incentives may have a substantial effect. The other set of parameters which is particularly important in this work is the group of health parameters β hf, β hp, and β ht. The progression of these parameters is as expected, and the values indicate that being in poor or terrible health is likely to have a great impact on the value of leisure, or alternatively, on the disutility of work. Being in fair health as opposed to good health, however, has a relatively minor effect of the value of leisure.
Estimates of the retirement model
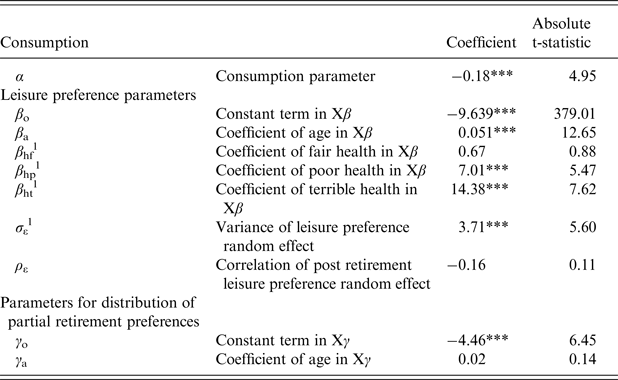
There are 63 moments and 10 parameters, yielding 53 degrees of freedom. For a χ 2 distribution with 53 degrees of freedom, the critical values are approximately 71 at the 5% significance level and 80 at the 1% significance level. The calculated value from the model is about 95, which is about 19% higher than the 1% significance level, indicating that the model is not reproducing at least one of the moments accurately. In examining the individual moments, the problem appears to be an overestimate of retirement, especially partial retirement, at age 60. The overestimate appears to be about 2–3 percentage points. Overall, however, the deviations of the moments from zero do not appear to be too severe, and the results of the base simulation appear to be reasonable.
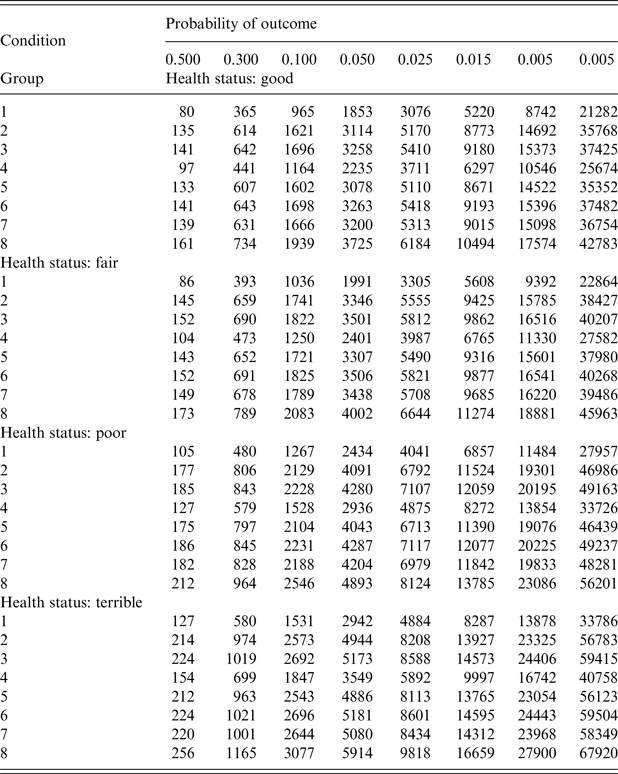
Table A4 gives the distribution of medical expenses by health status and condition group. Health status has four categories which can be thought of as roughly corresponding to good, fair, poor, and terrible. Condition groups are based on medical conditions such as ever having had cancer, a stroke, and so on, with increasing condition numbers corresponding to more severe conditions. The first condition group has none of the medical conditions, while those in condition group 8 have experienced both cancer and stroke. The row for a particular health status and condition group gives the distribution of medical expenses for that group. The first column is the average expense for the lower 50% of the medical expense distribution for the group. The next column is the average expense for the next 30% of the distribution, and so on until the last column, which is the average expense for the highest 0.5% of the distribution. This table pertains only to those who did not have insurance; the model assumes that medical expenses for individuals with insurance are negligible.
Medical expense distributions by health status and condition group for those without insurance (1992 dollars)