INTRODUCTION
A number of benthic estuarine and marine species, which are known to accumulate trace metals in their tissues, have been used to provide a measure of the bioavailability of those metals in the sediments of their habitats and to demonstrate how their bioavailability varies spatially and temporally (Rainbow, Reference Rainbow1995). Such an approach to biomonitoring needs to take into account the fact that the ability of organisms to take up, regulate, store in a detoxified state and/or bioaccumulate trace metals varies markedly according to the metal and the physiology of the species (Wang & Rainbow, Reference Wang and Rainbow2005; Amiard et al., Reference Amiard, Geffard, Amiard-Triquet and Crouzet2007; Bird et al., Reference Bird, Rotchell, Hesp, Newton, Hall and Potter2008). The bioavailability of metals can also be influenced by such factors as habitat type (e.g. sand versus mud) and salinity (Engel & Fowler, Reference Engel and Fowler1979; Bryan et al., Reference Bryan, Langston and Hummerstone1980; Culshaw et al., Reference Culshaw, Newton, Weir and Bird2002). Among benthic macroinvertebrates, biomonitors have typically included certain species of bivalve mollusc, polychaete annelid and a range of crustaceans (Depledge & Rainbow, Reference Depledge and Rainbow1990; Rainbow, Reference Rainbow1995; Matozzo et al., Reference Matozzo, Ballarin, Pampanin and Marin2001; Culshaw et al., Reference Culshaw, Newton, Weir and Bird2002; Scaps, Reference Scaps2002; Bresler et al., Reference Bresler, Abelson, Feldstein, Mokady, Fishelson and Rosenfeld2003; Frangipane et al., Reference Frangipane, Ghirardini, Collavini, Zaggia, Pesce and Tagliapietra2005; Poirier et al., Reference Poirier, Berthet, Amiard, Jeantet and Amiard-Triquet2006).
The Severn Estuary contains habitat types and/or faunal species that are rare or threatened in Europe and has thus been recognized as a Special Protection Area (SPA) and recommended as a candidate Special Area of Conservation (cSAC) (Langston et al., Reference Langston, Chesman, Burt, Hawkins, Readman and Worsfold2003). The region has now been accepted by the European Commission as a Site of Community Importance, but formal notices have not yet been issued. It also plays a key role in the life cycle of a number of important fish species in the region (Claridge et al., Reference Claridge, Potter and Hardisty1986; Potter et al., Reference Potter, Claridge and Warwick1986, Reference Potter, Claridge, Hyndes and Clarke1997, Reference Potter, Bird, Claridge, Clarke, Hyndes and Newton2001; Henderson & Bird, Reference Henderson and Bird2010) and provides crucial habitats for wading birds (Ferns, Reference Ferns1984). This estuary, which is the second largest in the United Kingdom, covers an area of 557 km2, of which 100 km2 is intertidal (Langston et al., Reference Langston, Chesman, Burt, Hawkins, Readman and Worsfold2003; Sustainable Development Commission, 2007a, b). However, when its seaward extension (Bristol Channel) is included, the intertidal area, which comprises mud flats, sand banks, rocky platforms and salt marshes, increases to 2000 km2, thus making it one of the largest and most important of such areas in Europe (Langston et al., Reference Langston, Chesman, Burt, Hawkins, Readman and Worsfold2003). This very large intertidal area reflects the presence of one of the greatest tidal ranges in the world, a characteristic that has led to tidal power in the Severn Estuary being considered seriously as a source for generating energy (Sustainable Development Commission, 2007a, b; Langston et al., Reference Langston, Jonas and Millward2010a). The extreme tides and currents in the Severn Estuary lead to redistribution of sediments during the year and thus account for the marked differences that have been found between the concentrations of different metals in the sediments at a given site at different times of the year (Duquesne et al., Reference Duquesne, Newton, Giusti, Marriott, Stark and Bird2006).
During the 1970s, scientists became aware that the water and sediments of the Severn Estuary and Bristol Channel had become contaminated with very high levels of various trace metals, of which cadmium (Cd), chromium (Cr), copper (Cu), nickel (Ni), lead (Pb) and zinc (Zn) were the most important from an ecotoxicological perspective (Owens, Reference Owens1984). Furthermore, substantial amounts of some of these metals had been accumulated by certain plants and animals (Butterworth et al., Reference Butterworth, Lester and Nickless1972; Badsha & Sainsbury, Reference Badsha and Sainsbury1977, Reference Badsha and Sainsbury1978; Noël-Lambot et al., Reference Noël-Lambot, Bouquegneau, Frankenne and Disteche1980; Martin et al., Reference Martin, Nickless and Stenner1997). Subsequently, more rigorous environmental legislation was introduced and the amount of industrial and mining activities declined. This accounts for the decline that has occurred in the Severn Estuary since the 1970s, both in the amount of trace metal contamination of the sediments and in the concentrations of Cd and Zn in biota such as seaweed (Fucus serratus) (Martin et al., Reference Martin, Nickless and Stenner1997; Langston et al., Reference Langston, Chesman, Burt, Hawkins, Readman and Worsfold2003; Duquesne et al., Reference Duquesne, Newton, Giusti, Marriott, Stark and Bird2006). Even so, two of the largest dischargers of Cd in estuaries in the United Kingdom during the 1990s, one from sewage and one from industry, were still located at Avonmouth in the industrialized region of the lower Severn Estuary and several other substantial domestic and industrial discharges add to this load (Langston et al., Reference Langston, Chesman, Burt, Hawkins, Readman and Worsfold2003).
The bivalve mollusc Macoma balthica (L.) and the polychaete annelids Hediste (previously Nereis) diversicolor (Müller) and Arenicola marina (L.) are each abundant in certain intertidal regions of the Severn Estuary and/or Bristol Channel (Bassindale, Reference Bassindale1943; Boyden et al., Reference Boyden, Crothers, Little and Mettam1977; Warwick, Reference Warwick1984; Harper, Reference Harper1991; Mettam et al., Reference Mettam, Conneely and White1994; Morrisey et al., Reference Morrisey, Sait, Little and Wilson1994; Environment Agency, 1997; Culshaw et al., Reference Culshaw, Newton, Weir and Bird2002; Ellis, Reference Ellis2002; Warwick & Somerfield, Reference Warwick and Somerfield2010). During the present study, these three species were chosen to act as biomonitors of trace metals in this estuary/channel, a role they have played in many systems (Frangipane et al., Reference Frangipane, Ghirardini, Collavini, Zaggia, Pesce and Tagliapietra2005). Although these species exhibit variable degrees of opportunism in their feeding behaviour, they are each capable of functioning as a deposit feeder, i.e. they ingest sediment (Riisgard et al., Reference Riisgard, Kiorboe, Mohlenberg, Drabaek and Madsen1985; Griscom et al., Reference Griscom, Fisher, Aller and Lee2002), and, since they are in direct contact with sediments for most of their life, have been widely considered to be good indicators of the bioavailability of metals in sediments (e.g. Bryan et al., Reference Bryan, Langston and Hummerstone1980; Amiard et al., Reference Amiard, Amiard-Triquet, Berthet and Metayer1987, Reference Amiard, Geffard, Amiard-Triquet and Crouzet2007; Rainbow, Reference Rainbow1995).
In the present study, the concentrations of Cd, Cr, Cu, Ni, Pb and Zn in the relatively sedentary M. balthica, H. diversicolor and A. marina were determined at various intertidal sites located throughout the Severn Estuary/Bristol Channel. These data were used to test the hypothesis that the concentrations of trace metals in these three biomonitor species would be greatest at those sites at which particularly large amounts of such metals were known to have been discharged over several years. They were also used to explore whether variations in the metal concentrations in those species among sites paralleled those recorded for metal concentrations in the sediments at the same sites at the time of sampling (Duquesne et al., Reference Duquesne, Newton, Giusti, Marriott, Stark and Bird2006). These latter comparisons were aimed at establishing whether such faunal/sediment relationships could still be detected when the metal concentrations were measured only at the time of sampling the Severn Estuary in which the sediments are subjected to the disruptive influence of extreme tides and currents (Langston et al., Reference Langston, Pope, Jonas, Nikitic, Field, Dowell, Shilloabeer, Swarbrick and Brown2010b). Our data were also used to test the hypotheses that the marked seasonal differences in sediment metal concentrations are reflected in those of the fauna and that, due to interspecific variations in the ability to regulate certain metals, the metal concentrations in co-occurring species differ. Finally, the data on metal concentrations in M. balthica, H. diversicolor and A. marina have been subjected to non-metric multidimensional scaling ordination and associated tests to determine the extent to which the compositions of the trace metals vary among those species and between sites and seasons and which metals contribute most to any interspecific differences.
MATERIALS AND METHODS
Sampling
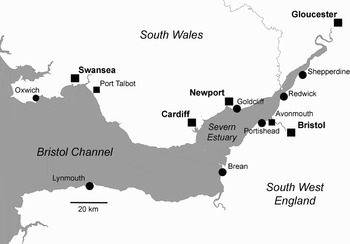
Sediments at sites in the Severn Estuary and Bristol Channel were sampled for Macoma balthica, Hediste diversicolor and Arenicola marina in winter 2000 and summer 2001 (Figure 1). The sediments at Shepperdine, Redwick and Portishead consisted of mud, i.e. grain size mainly <63 μm, while those at Brean and Oxwich comprised predominantly sand, i.e. grain size mainly >63 μm (see Duquesne et al., Reference Duquesne, Newton, Giusti, Marriott, Stark and Bird2006 for quantitative data on grain sizes at these sites) and those at Goldcliff consisted of either mud or sand, both of which were sampled. Ordnance Survey British National Grid References for these six sites are Brean: ST 295560; Goldcliff: ST 363823; Oxwich: SS 507866; Portishead: ST 463774; Redwick: ST 544865 and Shepperdine: ST 612961. As none of the above three species was found at Oxwich in summer 2001, sampling in that season was undertaken at Lynmouth (SS 720498), which likewise contained sandy sediments and is located in a similar region on the opposite side of the Bristol Channel and was thus considered an appropriate surrogate for Oxwich. Note that, despite extensive sampling, two species were found at the same sites in the same seasons on only three sampling occasions, i.e. M. balthica and H. diversicolor at Shepperdine in summer and M. balthica and A. marina at Brean in both winter and summer.
Map showing the locations of the sampling sites (circles), important sources of industrial discharge (small squares) and cities (large squares) in the Severn Estuary and Bristol Channel.

Sampling for M. balthica and H. diversicolor concentrated on searching through sediment removed from areas in the intertidal region where extensive preliminary studies had demonstrated that these species were likely to be found, whereas that for A. marina focused on exploring the sediment in areas where the faecal casts of this species were observed. Sample sizes for each species from each site in each season ranged from 6 to 18 individuals with particularly small or large individuals being excluded so that the individuals of a species from the various sites were of comparable size. Samples were transported to the laboratory, where they were left for 24 hours in water from their collection site to ensure complete evacuation of sediment from their guts. They were then frozen at –80°C, with their shells removed in the case of M. balthica.
Determination of trace metal concentrations
After drying each sample individually at 60°C, about 0.5 g of the resultant dry material was digested overnight at room temperature in 3 ml of 70% nitric acid (HNO3, Spectrosol grade, BDH) in polyethylene-capped tubes (Duquesne & Riddle, Reference Duquesne and Riddle2002). These samples were then heated at 90oC for 3 hours in a water bath and diluted to 30 ml with distilled water. Blanks and certified reference standard materials (DOLT2—dogfish liver tissue; and DORM-1—dogfish muscle; from the Canadian National Research Council) were included in each series of analyses and processed in the same way in order to adjust for variations in recoveries between batches of samples. Recoveries ranged between 85 and 100% for all metals. The concentrations of Cd were determined by ICP-MS (Perkin Elmer, ELAN 5000), while those of Cr, Cu, Ni, Pb and Zn were measured by axial ICP-OES (Varian Visa-Pro CCD simultaneous). Separate standard solutions of each element (Sigma) were used to calibrate the instruments. While concentrations of each of the six metals could be determined for virtually all individuals of M. balthica and H. diversicolor, technical difficulties with some of the tissue digests of A. marina meant that concentrations of the full suite of trace metals in all individuals of this species could not always be determined.
Statistical analyses
One-way or two-way analysis of variance (ANOVA) tests were used to determine whether the concentrations of each trace metal (Cd, Cr, Cu, Ni, Pb or Zn) in each of M. balthica, H. diversicolor and A. marina differed significantly between the sites and seasons for which samples of that species had been obtained. Both of the independent variables, i.e. site and season, were considered fixed factors. Prior to subjecting the concentrations of trace metals to ANOVA, they were log10(n + 1) transformed, which, in each case, was shown to be appropriate from the relationship between the log10 of the standard deviation (SD) and the log10 of the mean of the replicate concentrations of each trace metal. When there were significant interactions (P < 0.05), Scheffé's multiple comparison tests were used to determine whether the differences in the means were significant. One-way or two-way ANOVAs were also used to explore whether trace metal concentrations of species differed significantly when those species were sampled at the same site and in the same season. In the interaction plots shown in the results, the means are plotted as back-transformed data after applying the appropriate correction factor (Rothery, Reference Rothery1988). The concentrations of each trace metal in samples of M. balthica, H. diversicolor and A. marina at the various sites during winter 2000 and summer 2001 were loge (n +1) transformed and normalized so that the concentrations of all six trace metals were on a comparable scale. These data were employed to construct a Euclidean distance resemblance matrix using the PRIMER v6 multivariate statistics package (Clarke & Gorley, Reference Clarke and Gorley2006). The resemblance matrix was then subjected to non-metric multidimensional scaling (MDS) ordination and one-way or two-way crossed analysis of similarity (ANOSIM) (Clarke, Reference Clarke1993), the latter being used to test whether the compositions of the trace metals differed significantly between species, sites and/or seasons. The R-statistic values determined by ANOSIM for those comparisons that were significant were used to ascertain the degree to which a priori groups of samples were dissimilar (Clarke, Reference Clarke1993). R-statistic values approaching unity demonstrate that the compositions of trace metals in the samples of each group are very different, while those close to zero demonstrate that they are very similar. Similarity percentages (SIMPER) was then used to determine which trace metals contributed most to any significant dissimilarities between groups (Clarke, Reference Clarke1993). The same approach was adopted to explore whether the compositions of the trace metals differed among species that were collected at the same site and in the same season, and if so, how.
RESULTS
Intraspecific spatial and temporal comparisons of trace metal concentrations
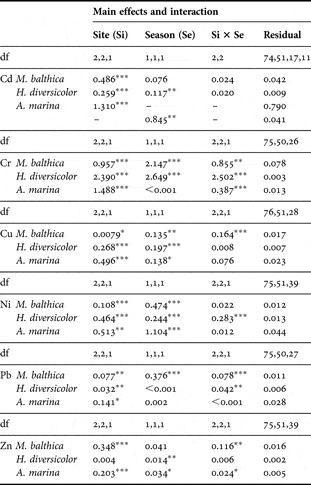
Analyses of variation demonstrated that Cd, Cr and Cu concentrations in Macoma balthica, Hediste diversicolor and Arenicola marina all differed significantly between sites and seasons, except with season for Cd in M. balthica (Table 1). The values for the mean squares demonstrated that Cd and Cu concentrations in each species were related more to site than season, except for Cu in M. balthica, noting also that the interaction between site and season was strong in this case. Although Cr concentrations tended to be related more to season than site, it should be recognized that there were strong interactions between these two variables.
Mean squares, significance levels and degrees of freedom for separate two-way analyses of variance (ANOVAs) of the concentrations of six trace metals in each of Macoma balthica, Hediste diversicolor and Arenicola marina at various sites in the Severn Estuary/Bristol Channel in winter 2000 and summer 2001. NB: one-way ANOVAs were employed for Cd in A. marina because of technical difficulties in determining concentrations of this metal in this organism at one site in one season. *P < 0.05, **P < 0.01, ***P < 0.001.

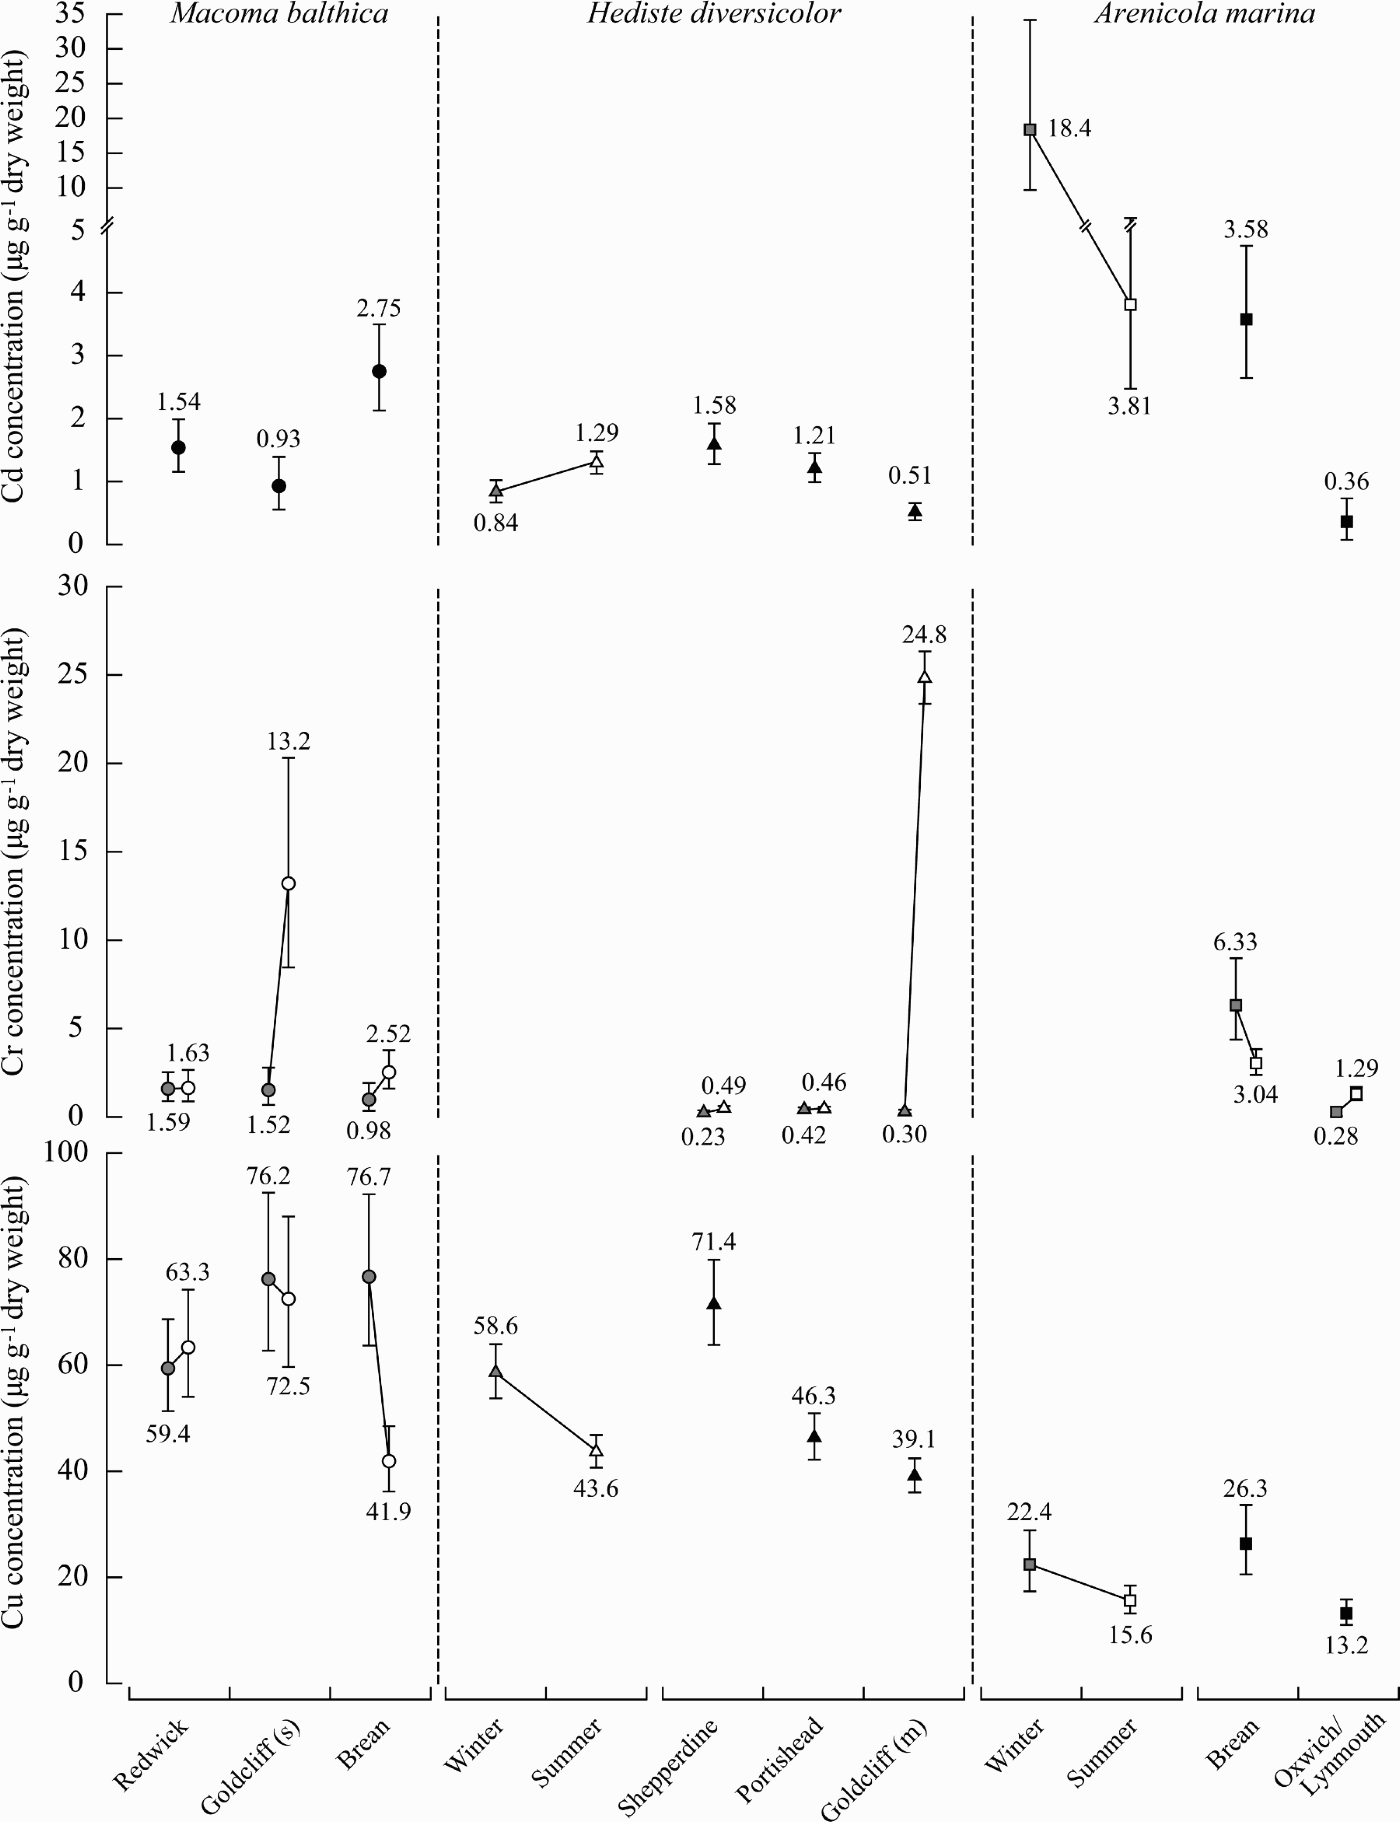
The mean Cd concentration in M. balthica was significantly greater at Brean than Redwick, which in turn was greater than in sand at Goldcliff (Figure 2). With H. diversicolor, the mean Cd was significantly greater at Shepperdine than at Portishead, which in turn was significantly greater than in mud at Goldcliff, and it was significantly greater in summer than winter (Figure 2). The mean concentration of Cd in A. marina was significantly greater at Brean than at Oxwich and was substantially greater in winter than summer (Figure 2).
Back-transformed mean concentrations ± 95% CI of Cd, Cr and Cu in samples of Macoma balthica (•) from Redwick, Goldcliff and Brean, of Hediste diversicolor (▴) from Shepperdine, Portishead and Goldcliff (mud) and of Arenicola marina (■) from Brean and Oxwich/Lynmouth in winter 2000 and summer 2001. In seasonal comparisons, grey refers to winter 2000 and white to summer 2001.
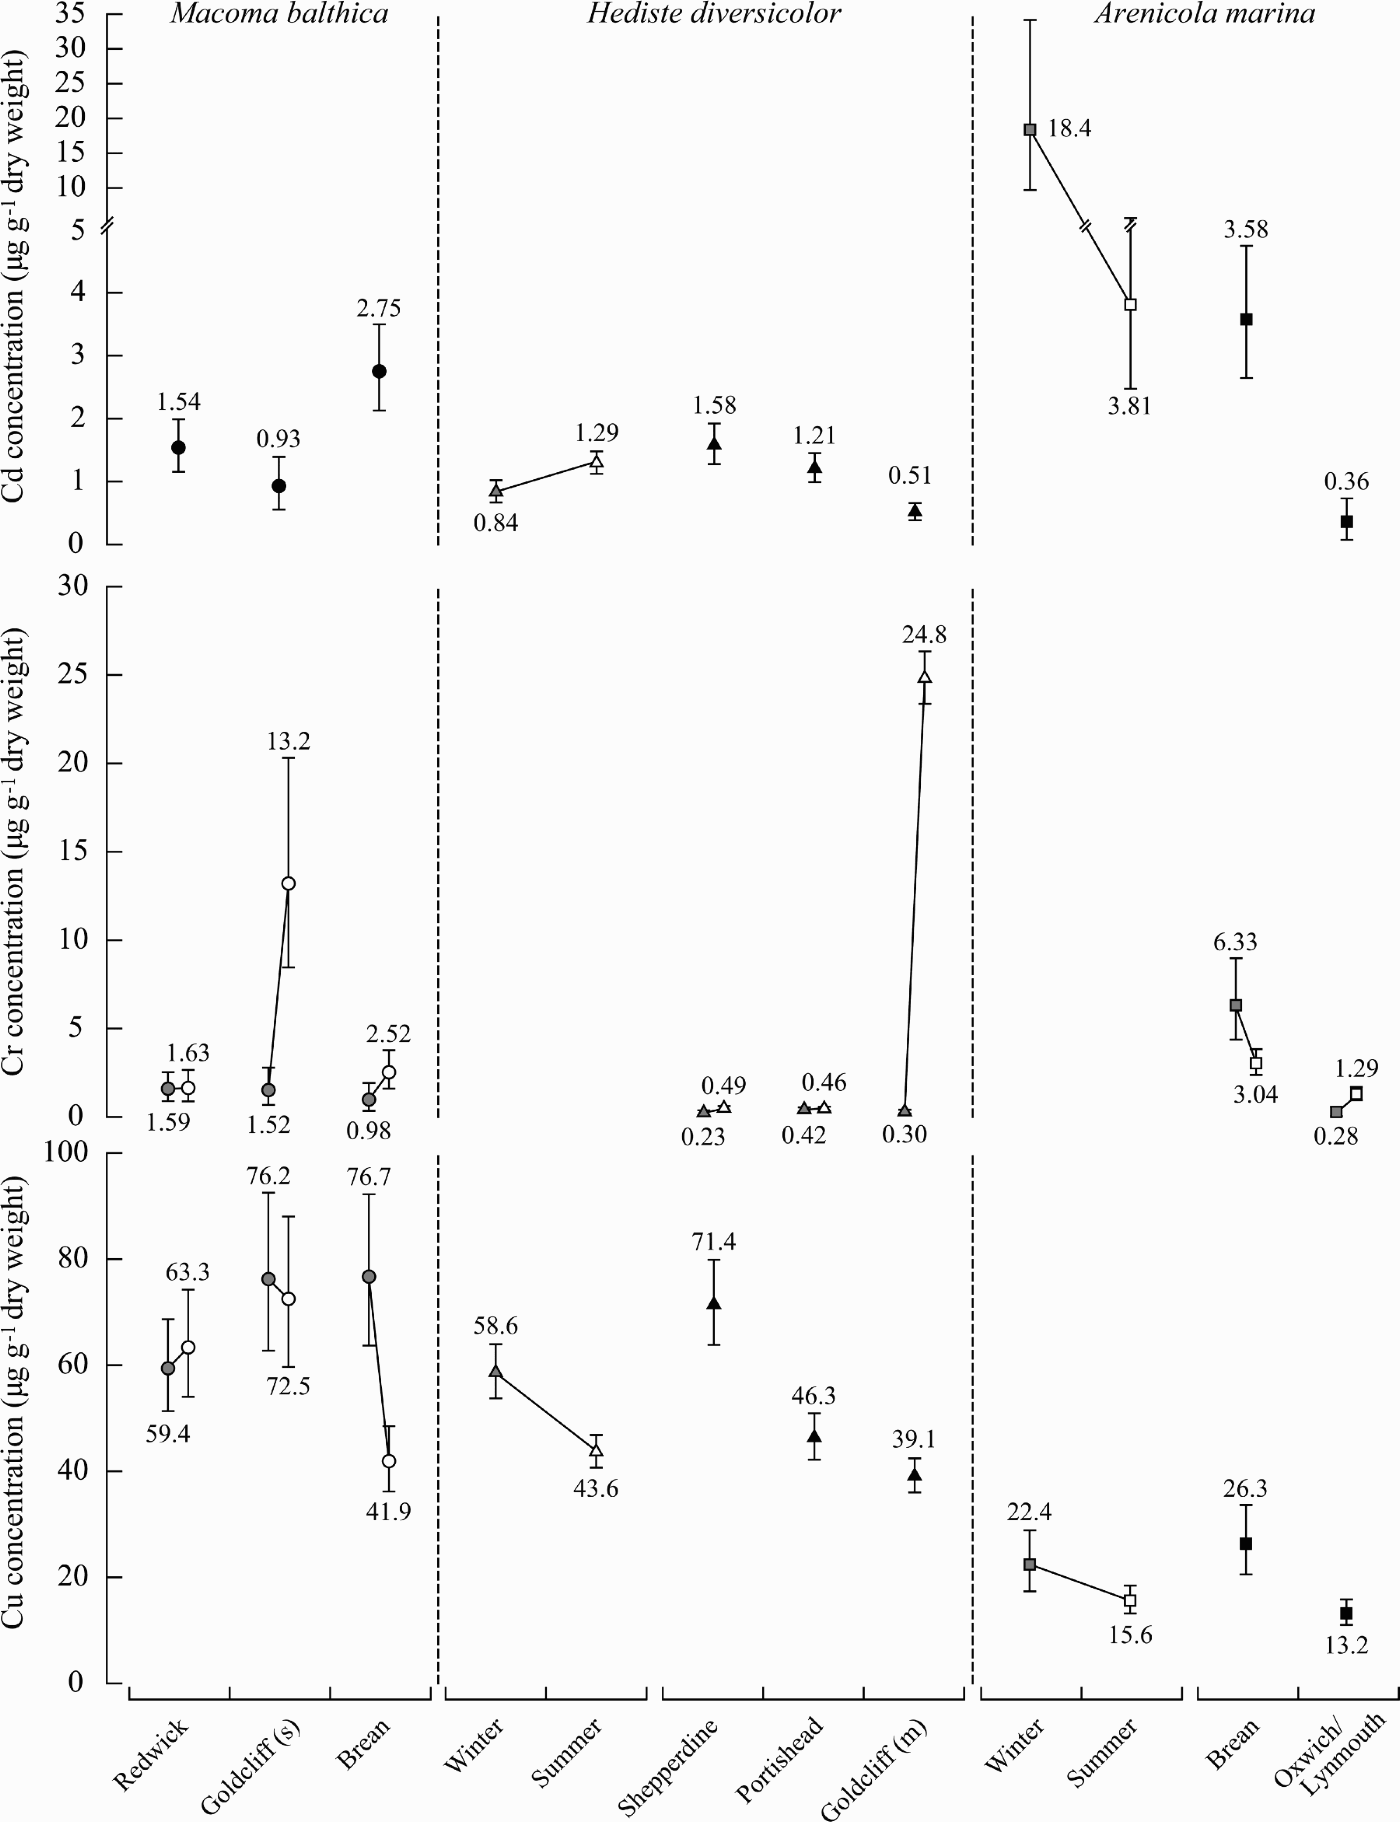
The mean seasonal concentration of Cr in M. balthica and H. diversicolor at each site was always higher in summer than winter, with this difference being significant and greatest at Goldcliff (sand) for the first species and at Goldcliff (mud) for the latter species (Figure 2). For A. marina in both seasons, the mean concentration of Cr was significantly higher at Brean than at Oxwich/Lynmouth (Figure 2).
The mean concentrations of Cu in M. balthica differed significantly between seasons only at Brean, where it was greater in winter than summer (Figure 2). The mean concentration of Cu in H. diversicolor was also greater in winter than summer and was significantly greater at Shepperdine than at Portishead, which in turn was significantly greater than in mud at Goldcliff (Figure 2). In A. marina, Cu concentration was significantly greater in winter than summer and at Brean than at Lynmouth (Figure 2).
The concentrations of Ni, Pb and Zn in M. balthica, H. diversicolor and A. marina all differed significantly among sites, except with Zn in H. diversicolor, and also between seasons, apart from Pb in A. marina (Table 1). The mean squares were greatest for site in five cases and for season in four cases and the main effects were always greater than the interaction term (Table 1).
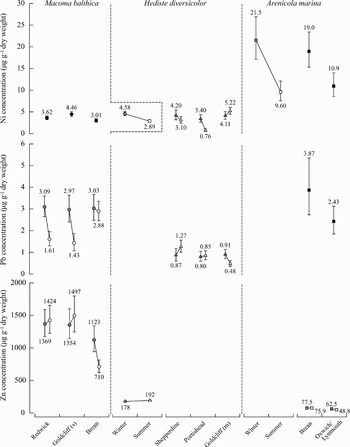
The mean Ni concentration in M. balthica was significantly greater in individuals from Redwick and Goldcliff (sand) than in those from Brean, whereas that for A. marina at Brean was conspicuously greater than that at Oxwich (Figure 3). Ni concentrations were greater in winter than summer in both M. balthica and particularly A. marina. Concentrations of Ni in H. diversicolor in summer were significantly greater in mud at Goldcliff than at Shepperdine, which, in turn, were significantly greater than at Portishead, whereas those for winter varied little between sites (Figure 3).
Back-transformed mean concentrations ± 95% CI of Ni, Pb and Zn in samples of Macoma balthica (•) from Redwick, Goldcliff and Brean, of Hediste diversicolor (▴) from Shepperdine, Portishead and Goldcliff (mud) and of Arenicola marina (■) from Brean and Oxwich/Lynmouth in winter 2000 and summer 2001. In seasonal comparisons, grey refers to winter 2000 and white to summer 2001.

Although the concentrations of Pb in both M. balthica and H. diversicolor in winter varied little between sites, they were significantly greater in winter than summer at Redwick and Goldcliff (sand) with M. balthica and also in the case of H. diversicolor at Goldcliff (mud) (Figure 3). The mean concentration of Pb in A. marina was significantly greater at Brean than at Oxwich, where individual concentrations did not vary as markedly (Figure 3).
In M. balthica, the mean Zn concentrations at Redwick and Goldcliff (sand) were similar in winter and summer, whereas at Brean they were significantly greater in winter (Figure 3). Although the mean concentrations of Zn in H. diversicolor in summer were only slightly greater than in winter, those seasonal means were still significantly different. The mean seasonal concentrations of Zn in A. marina did not differ markedly between seasons at either Brean or Oxwich/Lynmouth (Figure 3).
Interspecific comparisons of trace metal concentrations
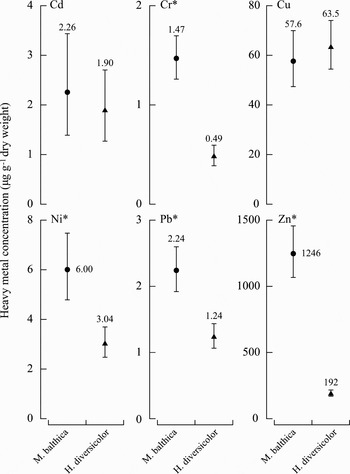
At Shepperdine in summer, the concentrations of Cr, Ni, Pb and Zn were each greater in M. balthica than in H. diversicolor (P <0.001), whereas those of neither Cd nor Cu differed significantly between these two species (P >0.05) (Figure 4).
Back-transformed mean concentrations ± 95% CI of Cd, Cr, Cu, Ni, Pb and Zn in samples of Macoma balthica (•) and Hediste diversicolor (▴) collected from Shepperdine in summer 2001. Asterisks denote values for species are significantly different.

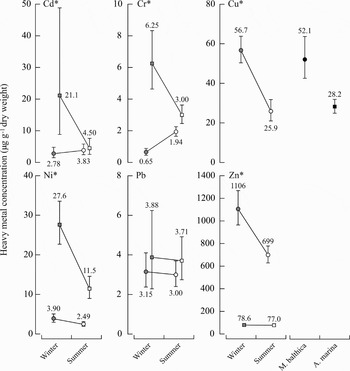
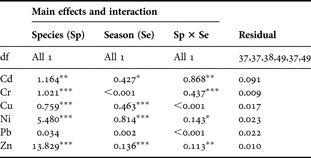
At Brean, the concentrations of all trace metals except Pb differed significantly between M. balthica and A. marina and also between seasons, and there were significant interactions for all metals except Cu and Pb (Table 2). The mean squares were always greatest for species and often markedly so. Although Pb concentrations did not differ significantly between M. balthica and A. marina in either season, the concentrations of Cr, Cu, Ni and Zn in the two species in both seasons were significantly different and the same was true for Cd in winter (Figure 5). However, whereas the concentrations of Cu and Zn were greater in M. balthica than A. marina, the reverse pertained with Cd, Cr and Ni (Figure 5).
Back-transformed mean concentrations ± 95% CI of Cd, Cr, Cu, Ni, Pb and Zn in samples of Macoma balthica (•) and Arenicola marina (■) collected from Brean in winter 2000 and summer 2001. In seasonal comparisons, grey refers to winter 2000 and white to summer 2001. Asterisks denote values for species are significantly different.

Mean squares, significance levels and degrees of freedom for separate two-way analyses of variance of the concentrations of six trace metals in Macoma balthica and Arenicola marina at Brean in winter 2000 and summer 2001. *P < 0.05, **P < 0.01, ***P < 0.001.

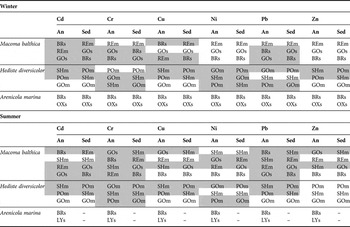
The concentration of each metal in A. marina was greater at Brean in the lower Severn Estuary than in Oxwich/Lynmouth in the less contaminated outer Bristol Channel, which reflected the differences in the concentrations of the corresponding metals in the sediments at those sites (Table 3). However, the rank order of concentrations of metals in M. balthica and H. diversicolor in the confines of the Severn Estuary, did not always match the rank order of the concentrations of the corresponding metals in the sediments at which those species were collected (Table 3).
Rank orders for metal concentrations in Macoma balthica, Hediste diversicolor and Arenicola marina at the various sampling sites, in winter 2000 and summer 2001, together with the rank orders for the concentrations of the same metals in sediments at the same sites, derived from data in Duquesne et al. (Reference Duquesne, Newton, Giusti, Marriott, Stark and Bird2006). NB: sediment data were not recorded at Lynmouth in the latter study. Shaded areas denote where the rankings of the sediment concentrations (Sed) do not match those of the animal concentrations (An). BRs, Brean (sand); GOs, Goldcliff (sand); GOm, Goldcliff (mud); LYs, Lynmouth (sand); OXs, Oxwich (sand); POm, Portishead (mud); REm, Redwick (mud); SHm, Shepperdine (mud).

Interspecific differences in compositions of trace metal concentrations
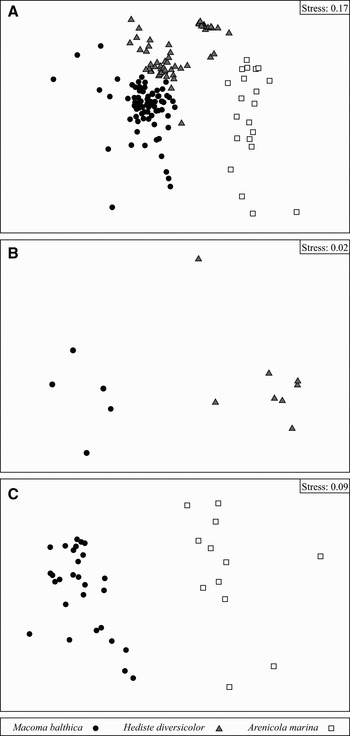
The samples for M. balthica, H. diversicolor and A. marina on the MDS ordination plot, derived from the matrix constructed from the concentrations of the six trace metals in each species at the various sites in winter 2000 and summer 2001, exhibited virtually no overlap (Figure 6A). One-way ANOSIM demonstrated that, overall, the compositions of the various trace metals, in terms of their concentrations, differed significantly among the three species (P = 0.001) and between sites (P = 0.001), but not between seasons (P = 0.055). The Global R-statistic was far greater for species (0.644) than for site (0.374). SIMPER demonstrated that, overall, the interspecific differences were due mainly to consistently greater concentrations of: (1) Zn in M. balthica than H. diversicolor and A. marina; (2) Cu in M. balthica than A. marina and in H. diversicolor than A. marina; and (3) Cr in A. marina than H. diversicolor.
Non-metric multidimensional scaling ordination of the matrix derived from the concentration of each trace metal in replicate samples of (A) Macoma balthica, Hediste diversicolor and Arenicola marina from all sites in winter 2000 and summer 2001; (B) M. balthica and H. diversicolor from Shepperdine in summer 2001; (C) M. balthica and A. marina from Brean in winter 2000 and summer 2001.

Following ordination of the matrices for metal concentrations for those sites where two species were collected, i.e. M. balthica and H. diversicolor at Shepperdine in summer and M. balthica and A. marina at Brean in both seasons, the samples for each species formed very discrete groups on the resultant plots (Figure 6B, C). One-way and two-way crossed ANOSIM, respectively, confirmed that the composition of trace metals in M. balthica differed significantly from that of both H. diversicolor (P = 0.002) and A. marina (P = 0.001), with the Global R-statistics for these differences being very high, i.e. 0.933 and 0.913, respectively. SIMPER demonstrated that the samples of M. balthica were distinguished from those of H. diversicolor at Shepperdine and from those of A. marina at Brean by consistently greater concentrations of Zn. At Shepperdine, M. balthica was also distinguished from H. diversicolor by consistently greater concentrations of Ni and Pb, whereas at Brean, that bivalve was also distinguished from A. marina by consistently lower concentrations of Ni.
Intraspecific variations in composition of trace metal concentrations
MACOMA BALTHICA
Two-way crossed ANOSIM, employing the matrix constructed using the data for samples of M. balthica collected from Shepperdine, Redwick, Goldcliff (sand) and Brean in both seasons, demonstrated that the compositions of the trace metal concentrations in individuals were significantly related to both season and site (both P = 0.001), with the Global R-statistic being greater for season (0.322) than site (0.275).
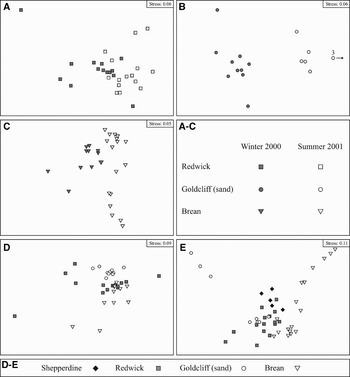
When the compositions of trace metal concentrations in samples of M. balthica from each of Redwick, Goldcliff (sand) and Brean were subjected to ordination, the samples from winter showed very little or no overlap with those from summer (Figure 7A–C). In each case, the difference between seasons was significant (P = 0.001–0.002), with Global R-statistics ranging from 0.246 to 0.643. Seasonal differences at all sites were attributable to higher concentrations of Cr in summer and also to greater concentrations of Ni at Redwick and Pb at Goldcliff (sand) in winter.
Non-metric multidimensional scaling ordination of the matrix derived from the concentration of each trace metal in replicate samples of Macoma balthica from (A) Redwick; (B) Goldcliff (sand); (C) Brean in winter 2000 (grey) and summer 2001 (white); (D) Redwick, Goldcliff (sand) and Brean in winter 2000; (E) Shepperdine, Redwick, Goldcliff (sand) and Brean in summer 2001. Note that the key to the symbols for A–C is given in the centre right panel and that the key for D and E is provided at the bottom of the figure.

When the matrix for M. balthica in winter was subjected to MDS ordination to explore the influence of site, the samples from Goldcliff (sand) formed a discrete and tight group towards the upper right side of the plot (Figure 7D). While five of the samples from Brean lay below all of those for Redwick, the other four samples from these two localities intermingled. Pairwise comparisons confirmed that the metal composition of the samples of M. balthica from Goldcliff (sand) differed significantly from those at Brean (P = 0.001) and Redwick (P = 0.006), with R-statistic values of 0.435 and 0.224, respectively, and demonstrated that those from the latter two sites did not differ (P = 0.221). The composition of the concentration of trace metals in M. balthica at Goldcliff (sand) was distinguished from that at both Brean and Redwick by consistently lower Cd concentrations.
Following ordination of the data for summer, the samples for Brean on the right of the plot did not overlap those for Goldcliff (sand) on the left of the plot (Figure 7E). However, a few samples from these two sites overlapped those of Redwick in the lower centre of the plot, which tended to lie below those of Shepperdine (Figure 7E). One-way ANOSIM demonstrated that the compositions of the trace metals differed significantly among sites (P = 0.001, Global R-statistic = 0.325). Furthermore, all pairwise comparisons between the samples for the four sites were significantly different (P = 0.001–0.043), with the differences being greatest for Goldcliff (sand) versus Brean and Shepperdine, and for Redwick versus Brean and Shepperdine (R-statistics = 0.327–0.445). The trace metal composition of M. balthica at both Goldcliff (sand) and Redwick differed from those at both Brean and Shepperdine by consistently lower concentrations of Pb. Samples from Goldcliff (sand) were further distinguished by the presence of lower concentrations of Cd than at Shepperdine and by higher concentrations of Cu than at Brean. Samples from Redwick were also distinguished by higher concentrations of Zn than at Brean and lower concentrations of Ni than at Shepperdine.
HEDISTE DIVERSICOLOR
Two-way crossed ANOSIM, employing the matrix derived from the data for H. diversicolor at Shepperdine, Portishead and Goldcliff (mud), demonstrated that the composition of trace metals in this species was significantly related to season and site (both P = 0.001) and that the corresponding Global R-statistics were very high, i.e. 0.855 and 0.824, respectively.
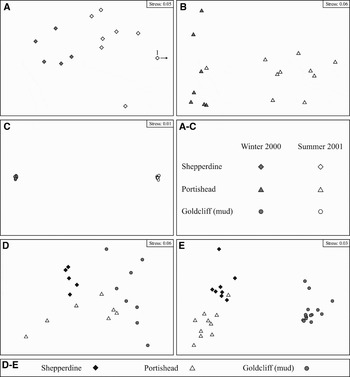
On the ordination plots, derived from the data for H. diversicolor at each of Shepperdine, Portishead and Goldcliff (mud), the samples for winter and summer were well separated (Figure 8A–C). One-way ANOSIM demonstrated that the seasonal difference at each site was significant and large, i.e. P = 0.001–0.005 and Global R-statistic = 0.424–1.000, and could be attributed to consistently higher concentrations of Ni in winter at Shepperdine and Portishead and also of Cd in summer at Portishead. Seasonal differences at Goldcliff (mud) were largely attributable to consistently higher concentrations of Cr in summer and of Pb in winter.
Non-metric multidimensional scaling ordination of the matrix derived from the concentration of each trace metal in replicate samples of Hediste diversicolor from (A) Shepperdine; (B) Portishead; (C) Goldcliff (mud) in winter 2000 (grey) and summer 2001 (white), and from all sites, i.e. Shepperdine, Portishead and Goldcliff (mud); (D) winter 2000; (E) summer 2001. Note that the key to the symbols for A–C is given in the centre right panel and that the key for D and E is provided at the bottom of the figure.

Following ordination of the matrix for winter to explore the influence of site on metal composition in H. diversicolor, the samples for Goldcliff (mud) lay to the right of those from Portishead, which lay below those from Shepperdine (Figure 8D). One-way ANSOIM demonstrated that, in winter, the compositions of the trace metal concentrations differed significantly among sites (P = 0.001, Global R-statistic = 0.432). Pairwise comparisons showed that the difference was greater between samples from Shepperdine and Goldcliff (mud) (P = 0.001; R-statistic = 0.730) than that between Shepperdine and Portishead (P = 0.010; R-statistic = 0.399), which in turn was greater than between Portishead and Goldcliff (mud) (P = 0.006; R-statistic = 0.255). The samples from Shepperdine were distinguished from those at both Portishead and Goldcliff (mud) by consistently higher concentrations of Cu and Cd and from those at Portishead by consistently higher concentrations of Ni. Higher concentrations of Cd also often distinguished the samples from Goldcliff (mud) from those of Portishead.
On the ordination plot for summer (Figure 8E), the samples of H. diversicolor from Goldcliff (mud) formed a discrete group well to the right of those for Shepperdine, which almost exclusively lay above those for Portishead. Pairwise comparisons confirmed that the differences between the samples from Goldcliff (mud) and those from Shepperdine and Portishead (both P = 0.001 and R-statistic = 1.000) were greater than between the latter two sites (P = 0.003 and R-statistic = 0.665). The samples of H. diversicolor from Goldcliff (mud) were distinguished from those at Shepperdine and Portishead by consistently higher concentrations of Cr and also from those at Portishead by higher concentrations of Ni. Furthermore, consistently greater concentrations of Cu and Pb distinguished the samples from Shepperdine from those at Goldcliff (mud), while consistently higher concentrations of Ni and Cu distinguished the samples at Shepperdine from those at Portishead.
ARENICOLA MARINA
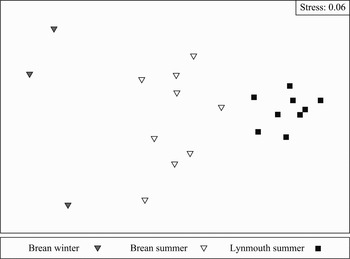
Following ordination of the matrix constructed for A. marina at the two sites at which this annelid was found, the samples for Brean in summer, Brean in winter and Lynmouth in summer each formed discrete groups (Figure 9). One-way ANOSIMs, employing firstly the data for samples of A. marina from Brean and Lynmouth in summer and then from Brean in both winter and summer, demonstrated that season and site were both significant (P = 0.005 and 0.001, respectively), with the Global R-statistics for these variables being very high, i.e. 0.854 and 0.826, respectively.
Non-metric multidimensional scaling ordination of the matrix derived from the concentration of each trace metal in replicate samples of Arenicola marina from Brean in winter 2000 and summer 2001 and from Lynmouth in summer 2001.

The difference in the compositions of the trace metals in samples collected in winter and summer at Brean was due to consistently higher concentrations of Cd, Ni and Cu in winter, while that between Brean and Lynmouth in summer was attributable to consistently higher concentrations of Cd and Ni at Brean.
DISCUSSION
Broad relationships between metal concentrations in biomonitor species and proximity to sources of discharge
Historically, there was considerable concern that the concentrations of Cd, a highly toxic metal, were at a level in the Severn Estuary that could potentially have major adverse effects on the biota of this large system (Radford et al., Reference Radford, Uncles and Morris1981; Harper, Reference Harper1991; Langston et al., Reference Langston, Chesman, Burt, Hawkins, Readman and Worsfold2003, Reference Langston, Pope, Jonas, Nikitic, Field, Dowell, Shilloabeer, Swarbrick and Brown2010b). The concentrations of Cd recorded for A. marina in the present study provide an excellent example of the ways in which the concentrations of a metal in an organism in a region can vary according to the extent to which that region is subjected to the input of large amounts of that metal. Thus, the mean concentration in this polychaete at Brean in the lower Severn Estuary, and thus just downstream of major discharge points of Cd and some other metals in the past (Langston et al., Reference Langston, Chesman, Burt, Hawkins, Readman and Worsfold2003), was approximately 10 fold greater than that at Oxwich/Lynmouth (Figure 2), which are near the mouth of the Bristol Channel and thus a considerable distance from the lower Severn Estuary and in an area far less contaminated with trace metals. Furthermore, the above differences between the Cd concentrations in A. marina in the lower Severn Estuary and outer Bristol Channel are paralleled by those for Cr, Cu, Ni, Pb and, to a lesser extent Zn.
In the context of the broad distribution of trace metals in our biomonitor species, it is also relevant that Cd concentrations in M. balthica were greater at Brean than in Goldcliff (sand), on the opposite side of the estuary to that where Cd has been mainly discharged, and from Redwick, much further upstream and therefore above the main sites of discharge. Furthermore, the relatively very high concentrations of Cr in both M. balthica and H. diversicolor at Goldcliff (mud) in summer imply that there is a strong point source of discharge of this metal at this site. The broad relationship between the concentration of Cd in A. marina and M. balthica and the proximity to major discharge sources of Cd largely parallels the situation recorded in other areas, such as with two species of bivalve (Mytilus edulis and Crassostrea gigas) over sites ranging widely from the English Channel to the Mediterranean (Amiard et al., Reference Amiard, Geffard, Amiard-Triquet and Crouzet2007).
Comparisons between metal concentrations in biomonitor species and sediments
Although the above cases demonstrate that there is a broad relationship between the body burdens of certain metals in benthic macroinvertebrates from the Severn Estuary and Bristol Channel and the proximity to the industrial discharge of those metals, the rank order (of sites) for the body burden of each metal at the various sites in the estuary often did not match those recorded for the concentration of those metals in the sediments at those sites at the same time (Table 3). There are several possible reasons for this lack of correspondence. For example, as bioavailability is influenced by such factors as salinity and sediment type, the concentrations of a metal in the sediments at the various sites do not always necessarily reflect the relative bioavailability of those metals to the biomonitor organisms across those sites. In this context, it was noteworthy that Cd and Cu concentrations in H. diversicolor declined sequentially between Shepperdine upstream, Portishead and then Goldcliff (mud) downstream and therefore along a salinity gradient. This trend may reflect the tendency for the bioavailability of many dissolved trace metals to decline with increasing salinity (Engel & Fowler, Reference Engel and Fowler1979; Bryan et al., Reference Bryan, Langston and Hummerstone1980). On the other hand, the low Cd concentrations at Goldcliff may reflect, at least in part, the influence of substrate type on the bioavailability of trace metals to organisms. This suggestion is based on the observation that the concentration of Cd in M. balthica in Goldcliff (mud) is less than in this bivalve mollusc at Brean, even though the sediment levels of Cd at this latter sandy site were lower. Such a conclusion is consistent with the fact that Cd binds far more tightly with fine organic sediments than with organic-poor sandier substrates (Langston et al., Reference Langston, Bebianno, Burt, Langston and Bebianno1998) and would consequently be less bioavailable in Goldcliff (mud).
It is also relevant that the sediments in the Severn Estuary undergo very extensive resuspension and redistribution as a result of the action of the very strong tidal currents that characterize this system (Langston et al., Reference Langston, Pope, Jonas, Nikitic, Field, Dowell, Shilloabeer, Swarbrick and Brown2010b). Thus, the metals in the sediment at any one point in the estuary will also be subjected to transportation and redistribution, which would tend to lead to their concentrations at that point varying over even relatively short time scales. This suggests that such single time measurements of metal concentrations in the environment may not provide a reliable reflection of the overall metal concentrations to which the organisms were subjected during the preceding weeks/months.
The transport and redistribution of sediments due to strong tidal action, together with elevated freshwater discharge in winter, has also been invoked to explain the pronounced differences recorded between the concentrations of trace metals at various sites in the sediments of the Severn Estuary in winter and summer (Duquesne et al., Reference Duquesne, Newton, Giusti, Marriott, Stark and Bird2006). This, in turn, would account for the pronounced seasonal differences that were frequently detected in the trace metal concentrations in our biomonitor organisms at a given site. A particularly striking example of seasonal variation is provided by the Cr concentrations in both M. balthica and H. diversicolor at Goldcliff (mud), which were about 9 and 86 times greater in summer than winter, respectively. However, the seasonal trends exhibited by the concentrations of a metal in a particular species across sites were not always entirely consistent. Thus, for example, whereas Pb concentrations in M. balthica were far greater in winter than summer at both Redwick and Goldcliff (sand), they were virtually identical in both seasons at Brean. These seasonal trends followed those exhibited by the concentrations of Pb in the sediment at Goldcliff (sand) and Brean but not those at Redwick.
Attempts to unravel the factors influencing the accumulation of a trace metal by biomonitor organisms in the Severn Estuary are occasionally made even more difficult as a result of large variations in the concentration of that metal at a given site and time. The most extreme example of this phenomenon is provided by the concentrations of Cr in M. balthica and H. diversicolor at Goldcliff in summer, with the values for the former ranging from 1.3 to 90.0 µg g−1 dry weight. As the substrate at the Goldcliff site at which H. diversicolor was sampled comprised mud, to which trace metals bind strongly, the concentrations of Cr in the sediment at this site must have been particularly high. Such a conclusion is consistent with the Cr concentrations in M. balthica and H. diversicolor at Goldcliff in summer being the highest recorded at any site in either season. It is thus relevant that the level of dissolved Cr recorded by Ellis (Reference Ellis2002) in the Severn Estuary was highest in this region and that Cr was the only one of 12 metals whose concentration in H. diversicolor within the Severn Estuary was found to have increased between 1978 and 2005 (Jonas & Millward, Reference Jonas and Millward2010; Langston et al., Reference Langston, Pope, Jonas, Nikitic, Field, Dowell, Shilloabeer, Swarbrick and Brown2010b). The data for the above two biomonitor species therefore provide strong evidence that a new or increased source of Cr discharge is now present at Goldcliff and, although sediments are transported and redistributed within the Severn Estuary, this trace metal still tends to accumulate in restricted areas at this site.
Comparisons of trace metal concentrations in co-occurring species
Comparisons between the data for M. balthica and H. diversicolor, when these species co-occurred at Shepperdine in summer 2001 (Figure 4), demonstrated that the concentrations of trace metals showed a very pronounced tendency to be greater in the bivalve mollusc than in the polychaete annelid. Thus, although the concentrations of neither Cd nor Cu differed significantly between the two species, those of Cr, Pb, Zn and Ni were all significantly greater in M. balthica than in H. diversicolor. The magnitude of the interspecific difference was greatest in the case of Zn, i.e. 6 times. This indication that H. diversicolor may be a particularly effective regulator of certain metals is consistent with the results of studies on trace metal regulation in this polychaete species (Bryan & Hummerstone, Reference Bryan and Hummerstone1973; Amiard et al., Reference Amiard, Amiard-Triquet, Berthet and Metayer1987). The similarity in the mean concentrations of Cu in co-occurring M. balthica and H. diversicolor presumably reflects the inability of both of these species to regulate this trace metal (Bryan et al., Reference Bryan, Langston and Hummerstone1980; Sokolowski et al., Reference Sokolowski, Wolowicz and Hummel2007).
The contrast between the very low concentrations of Zn in A. marina and the very much greater concentration in M. balthica at the same locality (Brean) parallel the trends exhibited by H. diversicolor and M. balthica at Shepperdine and may again reflect the greater ability of polychaetes to regulate this metal than bivalve molluscs. However, the data in Figure 5 emphasize that the relationship between the trace metal concentrations in M. balthica and A. marina differ markedly in some respects from those for M. balthica and H. diversicolor. Thus, while the concentration of Cu in M. balthica also exceeded that in A. marina, the opposite trend was exhibited by Cd and Cr in winter and Cu and Ni in both seasons, while the concentrations of Pb in the two species were not significantly different. The responses by the above two polychaete species to particular trace metals therefore often differ.
Trace metal compositions in Macoma balthica, Hediste diversicolor and Arenicola marina
The use of MDS ordination and ANOSIM tests demonstrated that, even when ignoring the possible influence of site or season, the compositions of the trace metal concentrations of Cd, Cr, Pb, Zn, Cu and Ni in M. balthica, H. diversicolor and A. marina in the Severn Estuary and Bristol Channel differed markedly. These analyses emphasized that interspecific differences in metal composition were particularly conspicuous when species co-occurred, i.e. for M. balthica and H. diversicolor at Shepperdine and for M. balthica and A. marina at Brean. SIMPER then enabled the metals that contributed most to any interspecific differences in metal composition to be identified. Thus, for example, far greater concentrations of Zn and Cr in M. balthica than H. diversicolor were most important in distinguishing the trace metal compositions of the former from latter species at Brean. Such information is highly desirable when developing biomonitoring strategies. For example, it implies that M. balthica would be preferable to H. diversicolor if the objective was to evaluate Zn and Cr contamination.
CONCLUSIONS
Although the concentration of each trace metal in M. balthica, H. diversicolor and A. marina almost invariably differed significantly among sites in the Severn Estuary and Bristol Channel and also frequently between winter and summer, there were sometimes strong interactions between site and season. The concentrations of individual metals also often differed markedly between species when they co-occurred. This emphasizes that, when using metal concentrations of the three benthic invertebrate species for biomonitoring purposes, it is important to bear in mind the influence of season, the possible confounding influence of such factors as salinity and the binding properties of the sediment particles on the bioavailability of the various metals and differences in the trends for the various species to accumulate metals.
Our use of multivariate statistics emphasized that the compositions of the trace metals in the three biomonitor species differ greatly and that, within a species, they vary conspicuously between summer and winter. The latter differences may reflect shifts in the relative responses to the various trace metals in the environment as a result of seasonal changes in the metabolism and/or other aspects of the physiology of the animal (Wang & Fisher, Reference Wang and Fisher1999; Luoma & Rainbow, Reference Luoma and Rainbow2005; Amiard et al., Reference Amiard, Geffard, Amiard-Triquet and Crouzet2007), as well as differences in the concentrations of those metals in the environment.
This study has shown that multivariate statistics provide a valuable additional approach to the use of traditional univariate techniques for analysing trace metal concentrations in biota in that it allows the compositions of the trace metals in different species or in the same species at different sites and/or in different seasons to be compared statistically in an integrated manner. The ability then to identify which metals are most important for distinguishing between a priori groups can then be used as an aid when developing biomonitoring strategies and to pose relevant physiological questions.
The baseline data provided in this paper will be invaluable for assessing the extent to which the bioavailability of trace metals in the Severn Estuary is altered if the proposed plans for harnessing tidal power are implemented. The implications of such conclusions will also be of value for predicting the changes likely to occur in other macro-tidal estuaries in which comparable types of extreme intervention are proposed.
ACKNOWLEDGEMENTS
Our gratitude is expressed to Professor K.R. Clarke and Dr F.J. Valesini for their helpful comments on aspects of the multivariate analyses. This work was supported by a postdoctoral fellowship to S. Duquesne from the University of the West of England.