INTRODUCTION
Lianas play important roles in tropical forest functioning (Schnitzer & Bongers Reference SCHNITZER and BONGERS2011) and reestablishment of tropical forest ecosystem processes (DeWalt et al. Reference DEWALT, SCHNITZER and DENSLOW2000). Several factors have been suggested to influence liana assemblages, but little is known about the edaphic and topographic factors (hereinafter referred to as environmental factors) that associate with liana diversity, composition and community structure in tropical forests. To date, there is lack of consensus about how soil properties relate with liana assemblages in tropical forests. Studies conducted by Putz & Chai (Reference PUTZ and CHAI1987) and Phillips et al. (Reference PHILLIPS, MARTINEZ, MENDOZA, BAKER and VARGAS2005) concluded that soil properties had only a minor influence on liana assemblages. In a more extreme case, van der Heijden & Phillips (Reference VAN DER HEIJDEN and PHILLIPS2008) observed that liana density and basal area were not related to soil nutrients in some Neotropical forests. However, in other studies, soil nutrients were identified as significant correlates of liana abundance and biomass (Chettri et al. Reference CHETTRI, BARIK, PANDEY and LYNGDOH2010, Gentry Reference GENTRY, Putz and Mooney1991, Laurance et al. Reference LAURANCE, PÉREZ-SALICRUP, DELAMÔNICA, FEARNSIDE, D’ANGELO, JEROZOLINSKI, POHL and LOVEJOY2001, Malizia et al. Reference MALIZIA, GRAU and LICHSTEIN2010) and distribution (Nurfazliza et al. Reference NURFAZLIZA, NIZAM and SUPARDI2012).
Topographic features greatly influence local conditions such as edaphic and climatic factors, which may in turn influence plant species assemblages in an area (Chuyong et al. Reference CHUYONG, KENFACK, HARMS, THOMAS, CONDIT and COMITA2011). For example, topographic variation may cause variation in soil properties that can affect some important aspects of liana community assemblages including diversity, composition and community structure. Proper knowledge of this phenomenon is important in understanding how topographic variation contributes to liana species diversity in tropical forests. Nevertheless, our current understanding of topographic factors associated with liana assemblages in tropical forests is limited, and also complicated due to the inconclusive nature of the findings of some studies. For instance, some authors reported inverse correlations between altitude, and liana species diversity and abundance (Addo-Fordjour et al. Reference ADDO-FORDJOUR, RAHMAD and SHAHRUL2013a, Lertpanich & Brockelman Reference LERTPANICH and BROCKELMAN2003, Parthasarathy et al. Reference PARTHASARATHY, MUTHURAMKUMAR and REDDY2004, Putz & Chai Reference PUTZ and CHAI1987) while others did not find a significant relationship between altitude and liana abundance (Homeier et al. Reference HOMEIER, ENGLERT, LEUSCHNER, WEIGELT and UNGER2010).
This paper was aimed at contributing to understanding the environmental factors that relate with liana diversity, composition and community structure in topographically defined habitats. The objective of the current study was therefore to determine liana diversity, composition and community structure as well as the environmental factors associated with them within topographically defined habitats in the Atewa Range Forest Reserve, Ghana. In this perspective, the following hypotheses were tested by the current study: (1) Environmental factors are important determinants of liana diversity, composition and community structure; (2) Liana diversity and abundance decrease with altitude.
METHODS
Study area
The Atewa Range Forest Reserve is one of the most important and largest forests in Ghana (0°36.00′W, 6°10.00′N). The forest reserve which spans different towns and villages covers a total area of about 23 663 ha. Over the past 90 y, the Atewa Range Forest Reserve has been recognized as an important reservoir of biodiversity (McCullough et al. Reference MCCULLOUGH, ALONSO, NASKRECKI, WRIGHT and OSEI-OWUSU2007, Naskrecki & Alonso Reference NASKRECKI and ALONSO2007). It is a unique forest reserve in Ghana because it contains a distinct upland forest vegetation. However, a number of human activities such as illegal logging, hunting and farming threaten the high diversity of the forest reserve (McCullough et al. Reference MCCULLOUGH, ALONSO, NASKRECKI, WRIGHT and OSEI-OWUSU2007, Naskrecki & Alonso Reference NASKRECKI and ALONSO2007). As one of the greatest burdens in the forest reserve, illegal logging and high bushfire frequencies have resulted in unsustainable deforestation and loss of important timber trees including Khaya ivorensis, Milicia excelsa and Terminalia ivorensis (McCullough et al. Reference MCCULLOUGH, ALONSO, NASKRECKI, WRIGHT and OSEI-OWUSU2007). Despite the presence of human-induced disturbance in the Atewa Range Forest Reserve, there are large areas of the forest reserve which have experienced only a moderate form of human disturbance as a result of selective logging. These areas have relatively high canopy cover (> 70%), and an average canopy height of 40 m. The topography of the area is dominated by a series of dissected forest plateau (McCullough et al. Reference MCCULLOUGH, ALONSO, NASKRECKI, WRIGHT and OSEI-OWUSU2007). The topography of the plateau is normally undulating, and occurs at altitudes that range from 300–800 m asl. The area has underlying Birimian rock formations and Voltarian metamorphosed sediments (McCullough et al. Reference MCCULLOUGH, ALONSO, NASKRECKI, WRIGHT and OSEI-OWUSU2007). The area represents the last remains of an ancient peneplain covered by ancient soils. The summit plateau has undergone extreme weathering that has removed the majority of silica, leaving sesquioxides of iron and aluminium (Ahn Reference AHN1970). Furthermore, there is reduced decomposition at the plateau resulting in a clay-rich soil that is aggregated by organic matter. The forest reserve experiences rainy and dry seasons during a single year. The rainy season has a double-maximum rainfall regime: May–July and September–November. The mean monthly temperature of the forest reserve is in the range of 24–29 °C. The area receives mean annual rainfall up to 2000 mm.
Habitat selection and vegetation sampling
Three topographically defined habitats, namely hill bottom, hill slope and plateau were identified within logged-over forests and used for the current study. The plateau habitat was located in the hill top. The slope angle and altitudinal ranges of this habitat were > 10° < 20° and 589–757 m asl, respectively. The hill-bottom habitat was made up of adjacent flat lands located just at the bottom of the hill range. The slope angle of this habitat was < 10° and the altitude range was 33–131 m asl. The hill-slope habitat had slope angle of > 30° and altitude of 305–468 m asl.
Two sampling sites were randomly selected within each topographic habitat. The topographic habitats in the Atewa Range Forest Reserve were separated by a minimum distance of about 6 km, and a minimum separation distance of 1.5 km existed between the sampling sites in each topographic habitat. Five 40 × 40-m plots were randomly demarcated in each sampling site, resulting in 10 plots per topographic habitat (30 plots in the study). The minimum distance separating one plot from another in a given site was 250 m. Topographic habitats of comparable forest structure were chosen for the study so as to nullify or reduce the possible effects of forest structure in the study (hill-bottom: canopy cover – 71.5%, density of trees with dbh ≥ 10 cm – 381 individuals ha−1; hill-slope: canopy cover – 70.8%, density of trees with dbh ≥ 10 cm – 379 individuals ha−1; plateau: canopy cover – 73.3%, density of trees with dbh ≥ 10 cm – 374 individuals ha−1). The slope angle of each plot was measured with a clinometer (Suunto SPUME-5/360PC), and the altitude of the plots was determined by the use of a Global Positioning System (GPS) (Garmin GPSMAP 62). In each plot, trees of diameter (at breast height) ≥ 10 cm were inspected for the presence and identification of lianas of diameter (at 1.3 m) ≥ 2 cm. Thus, liana enumeration was limited to only individuals that were located on trees so as to avoid the possible inclusion of shrubs as lianas. Diameter of plant species was measured with a diameter tape. To avoid counting the same liana stem or individual more than once, each liana stem was traced to the ground to establish if it was attached to other stems already counted.
Lianas were identified with the support of a plant taxonomist, and also with reference to the following manuals and floras: Arbonnier (Reference ARBONNIER2004), Hawthorne & Jongkind (Reference HAWTHORNE and JONGKIND2006) and Poorter et al. (Reference POORTER, BONGERS, KOUAMÉ and HAWTHORNE2004). Nomenclature in this study was in accordance with Jongkind (Reference JONGKIND, Bongers, Parren and Traoré2005) and Hawthorne & Jongkind (Reference HAWTHORNE and JONGKIND2006). Voucher specimens were kept in the herbarium of the Department of Theoretical and Applied Biology, Kwame Nkrumah University of Science and Technology, Kumasi, Ghana.
Collection and analysis of soil samples
The concentrations and/or values of the following soil properties were determined from topsoils (0–10 cm) taken from four areas in each plot: potassium (K), sodium (Na), magnesium (Mg), available phosphorus (P), total nitrogen (N), calcium (Ca), moisture and pH. A composite mixture was formed out of the four samples for each plot. The soil samples were air-dried, ground and then passed through 1-mm and 2-mm sieves (for nitrogen and the rest of the soil nutrient soil samples, respectively). Nonetheless, soil pH and moisture content were determined using fresh soil samples. Soil moisture was determined at three different periods, namely middle of rainy season, end of rainy season and middle of dry season. The average value of the three sampling periods was used to represent soil moisture content for each plot.
Total cation concentrations (Ca, K, Mg, Na) were determined by weighing 2 g of the air-dried and ground soil into a digestion flask, and then digesting (block digestion) with 15 ml of concentrated HNO3. The resulting solution of the digestion was subjected to flame atomic absorption spectrophotometry (Perkin Elmer Analyst 100) for the determination of concentrations of the above-mentioned cations. Soil available P was extracted by Bray 1 extraction (Bray & Kurtz Reference BRAY and KURTZ1945), and its concentration was subsequently determined by spectrophotometry. The Kjeldahl method (Jones Reference JONES1991) was employed for the determination of total N concentration of soil samples. Using a pH meter with a glass electrode (Jenway 3305) soil pH was measured in a 1 : 1 soil : water ratio. To determine moisture content of soils, an oven drying method was used. It involved oven drying of fresh soil samples to a constant weight at 105 °C.
Data analyses
Two measures of diversity were determined and used to represent diversity of liana community in this study. These were species richness and Shannon diversity index which were computed at both habitat and plot levels. Species richness is often dependent on sampling effort applied. Inadequate sampling effort may lead to under-detection of some species. Since the sampling efforts needed to obtain total species richness are excessive, and therefore unfeasible in most cases, it is important to estimate total species richness from possible incomplete samples so as to account for the likely inadequate detectability (Kéry et al. Reference KÉRY, ROYLE, PLATTNER and DORAZIO2009, Walther & Morand Reference WALTHER and MORAND1998). For this reason a non-parametric species richness estimator, Chao1, was used to estimate liana species richness per topographic habitat and plot. Observed liana species richness was also determined for the plots by counting the number of species identified in each plot. The liana species richness (observed and estimated) determined at the plot level was used in regression analysis described later in this section. Chao1 estimator was selected for this study because it is valid under all types of species abundance distribution, and therefore considered as a universal species richness estimator (Chao et al. Reference CHAO, COLWELL, LIN and GOTELLI2009). Furthermore, the proportion of singletons in the data was below 50%, which made the data suitable for Chao1 estimation. Estimated liana species richness was determined by the SPADE version 2.0 using the following Chao1 estimator equation:
 \begin{equation*}
S_{{\rm Chao1}} \; = \;S_{{\rm ob}} \; + \;(F_1 )^2 /2(F_2 ),
\end{equation*}
Where, F 1 = number of singleton species, and F 2 = number of doubleton species, S Chao1 = estimated number of species, and S ob = total number of species observed in a sample. Shannon diversity index was quantified for the topographic habitats using PAST version 2.17c (Hammer et al. Reference HAMMER, HARPER and RYAN2001). Significant differences in the diversity values between the topographic habitats were tested using pairwise permutation test in the PAST programme. Additionally, Shannon diversity index was computed for the individual plots and later used in the regression analysis.
Non-metric multidimensional scaling analysis (NMDS) was conducted to determine the patterns of liana species composition among the topographic habitats as well as the environmental factors that associated with the observed patterns in the study area. Bray–Curtis distance measure was employed as the dissimilarity measure of liana species composition in the NMDS analysis. Initial NMDS analysis involving all the environmental factors revealed that many of the variables were self-redundant (i.e. had very low correlation with the first two axes: r < 0.30), and others were highly correlated with each other (r > 0.90). Consequently, the redundant variables were excluded from the final NMDS analysis. Subsequently, a total of four environmental variables (soil P, Mg and moisture, and altitude) were retained in the final NMDS analysis. Appropriate dimensionality of ordination was selected as the one that provided a lower stress. Liana species abundance in the plots was used for the NMDS analysis. Rare species (species which accounted for less than five individuals and occurred in less than 10% of the plots) were excluded from the NMDS analysis so as to reduce noise effect (Kennen Reference KENNEN2005, Vonlanthen et al. Reference VONLANTHEN, BÜHLER, VEIT, KAMMER and EUGSTER2006). One-way analysis of similarity (ANOSIM) was performed among the habitat pairs to test for significant differences in the patterns of liana species composition revealed in the NMDS ordination.
Importance value index (IVI) was calculated for the liana species in each habitat using the following equation (Cottam & Curtis Reference COTTAM and CURTIS1956):
 \begin{eqnarray*}
{\rm IVI} & = & {\rm relative\; density}\;{\rm + }\;{\rm relative\; frequency}\\
&&+ \, {\rm relative\; basal\; area}{\rm .}
\end{eqnarray*}
Liana abundance and basal area were computed for each plot by summing the values for all the species in the plot (i.e. total liana abundance and basal area). Liana community structure was represented by liana abundance and basal area in this study. To determine differences in liana abundance and basal area among the topographic habitats, one-way nested ANOVA in which sites were nested within the habitats was conducted on these liana community structural attributes. Additionally, one-way nested ANOVA was run on the environmental variables to determine the effects of topographic habitat and site on their variation. The data used in the nested ANOVA were tested to ensure that they complied with the assumptions of nested ANOVA (normality, homogeneity of variance). Appropriate data transformation was applied where particular data violated the assumptions. Liana basal area, and soil pH and Na data were log-transformed (log10) to meet normality and homogeneity of variance assumptions of ANOVA. Normality and homogeneity of variance tests were conducted by probability plot and Bartlett's test, respectively. Tukey HSD test was used to determine significant differences among habitat pairs. The Minitab 15 Software (Minitab Inc.) was used for the one-way nested ANOVA.
In order to identify the environmental factors that associated with liana diversity and community structure, stepwise multiple regression analysis (using forward selection) was conducted between the measured environmental variables, and the various attributes of liana diversity (species richness, Shannon diversity index) and community structure (total abundance and basal area) of the plots. The environmental and liana variables were log10-transformed so as to fulfil linearity assumption of regression analysis. All other assumptions of regression were also fulfilled. Both observed and estimated species richness per plot were initially used in this analysis but the results of the two types of species richness were similar due to high correlation between them. Consequently, only the observed liana species richness was retained in the final regression analysis. The regression analysis was run by Minitab 15 Software (Minitab Inc.) at a significance level of 5%.
RESULTS
Patterns of liana diversity, composition and community structure
Liana diversity
There were 83 liana species identified across the three topographic habitats, representing 48 genera and 28 families (Appendix 1). The estimated species richness of lianas was highest in the hill-bottom habitat (≈ 70 species) and least in the hill-slope habitat (≈ 46 species) (Table 1). Shannon diversity index in the hill-bottom habitat was significantly higher than that in the hill-slope and plateau habitats (Table 1; P = 0.001). However, Shannon diversity index in the hill-slope and plateau habitats did not differ significantly. The most species-rich families in all the habitats were Apocynaceae, Fabaceae and Celastraceae (Appendix 1).
Liana diversity and structural variables (diameter ≥ 2 cm) determined in thirty 40 × 40-m plots of three topographic habitats in the Atewa Range Forest Reserve, Ghana. Mean values (± SE) with different superscripts that occur in the same row are significantly different (P < 0.05). All group mean separations were determined by Tukey pairwise HSD test (one-way nested ANOVA) except for Shannon diversity index which was determined by pairwise permutation test.

Liana species composition
The NMDS analysis provided a lower stress of 0.198 for a two-dimensional ordination. The NMDS ordination diagram revealed that the plots in the hill-bottom habitat were separated from the plots in the hill-slope and plateau habitats (Figure 1). However, there was no appreciable separation of the plots in the hill-slope and plateau habitats. This pattern was corroborated by the one-way ANOSIM which revealed that liana species composition in the hill-bottom habitat was significantly different from the composition in the hill-slope and plateau habitats (P = 0.0049 and 0.0044, respectively). Nevertheless, there was no significant difference in liana species composition between the hill-slope and plateau habitats (P = 0.4868).
Non-metric multidimensional scaling (NMDS) of liana species composition in the sampling plots of the hill-bottom (squares), hill-slope (circles) and plateau (crosses) habitats in the Atewa Range Forest Reserve, Ghana. The ordination also shows correlations between environmental factors (lines) and liana species composition of the plots.

Liana community structure
A total of 1118 liana individuals was enumerated in the three topographic habitats. Mean liana abundance per plot differed significantly among all the topographic habitats (Table 1; F = 25.1; df = 2; P = 0.001). Similarly, mean liana basal area per plot was significantly different among all the topographic habitats (F = 17.9; df = 2; P = 0.001). Conversely, mean liana abundance and basal area per plot were comparable among the sites (P > 0.05).
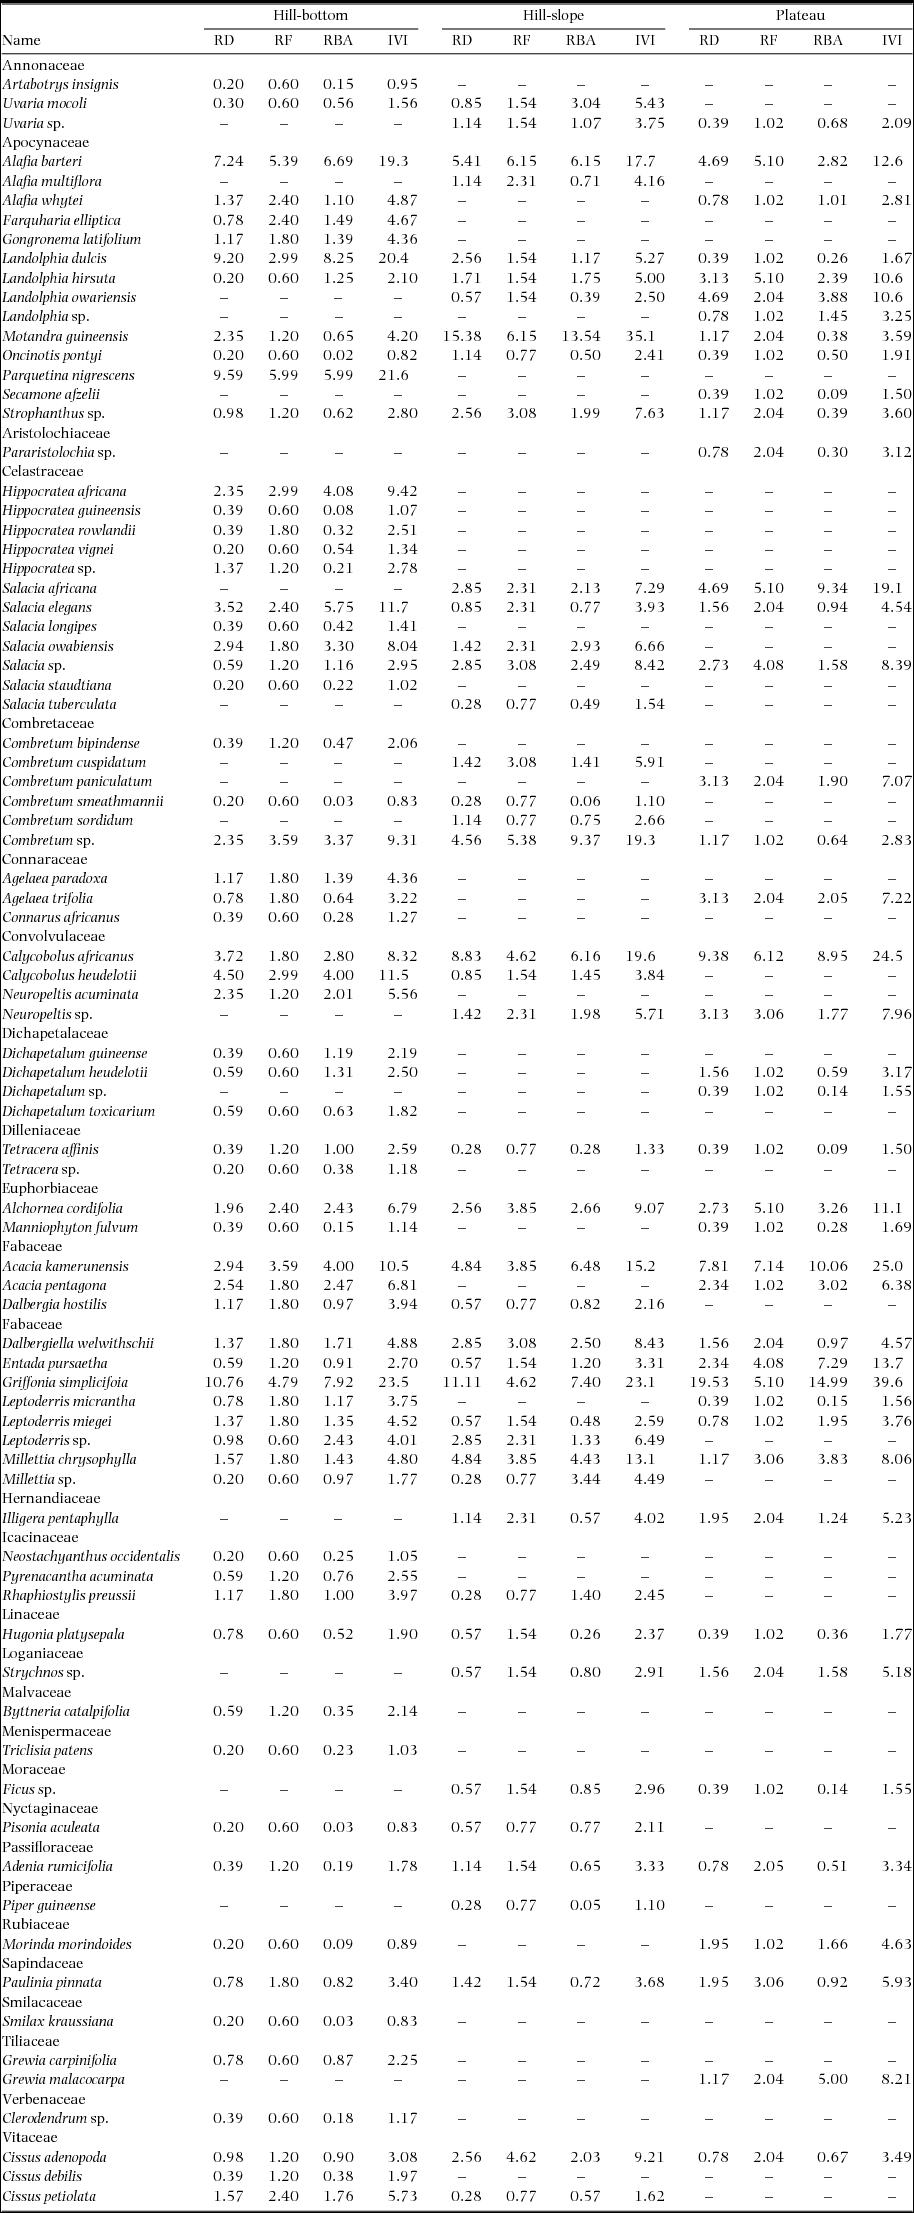
The most dominant liana species in the hill-bottom habitat were Griffonia simplicifolia, Parquetina nigrescens, Landolphia dulcis and Alafia barteri (IVI = 23.5, 21.6, 20.4 and 19.3, respectively) (Appendix 1). The most dominant liana species within the hill-slope habitat were Motandra guineensis (IVI = 35.1), G. simplicifolia (IVI = 23.1), Calycobolus africanus (IVI = 19.6) and Combretum sp. (IVI = 19.3). In the plateau habitat, G. simplicifolia (IVI = 39.6), Acacia kamerunensis (IVI = 25.1), C. africanus (IVI = 24.5) and Salacia africana (IVI = 19.1) constituted the most dominant liana species. The 10 most dominant liana species in the plateau and hill-slope habitats contributed more than half of the IVI in those habitats (plateau habitat: IVI = 175; hill-slope habitat: IVI = 170). On the other hand, the 10 most dominant liana species in the hill-bottom habitat accounted for less than half of the IVI in that habitat (IVI = 146).
Environmental factors associated with liana diversity, composition and community structure
Variation in environmental factors among the habitats
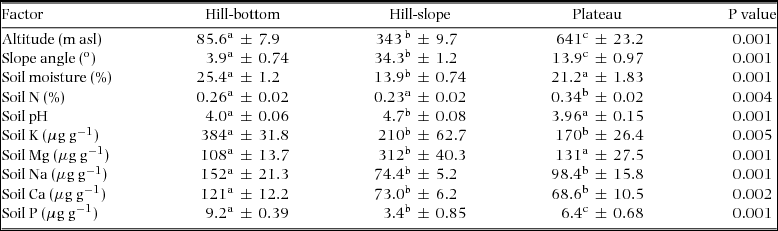
There were significant effects of topographic habitat on the values of the environmental variables measured in this study (P < 0.05) (Table 2). In most cases, the variation existed between the hill-bottom habitat on one hand and the hill-slope and plateau habitats on the other hand. Soil Na concentration and altitude varied significantly among the sites (P < 0.05). However, there was no significant effect of site on the rest of the environmental variables (P > 0.05).
Topographic and edaphic factors showing their mean values (±SE) in the three topographic habitats of the Atewa Range Forest Reserve, Ghana. Values with different superscripts that occur in the same row are significantly different (P < 0.05). All group mean separations were determined by Tukey pairwise HSD test (one-way nested ANOVA).
Liana diversity and community structure
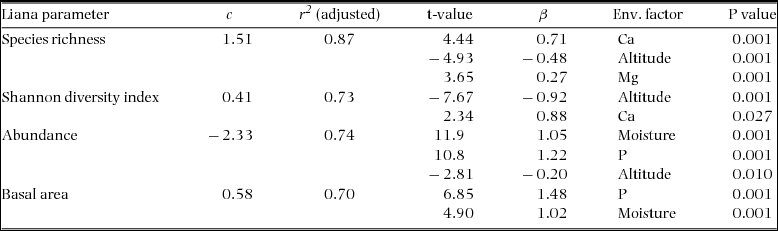
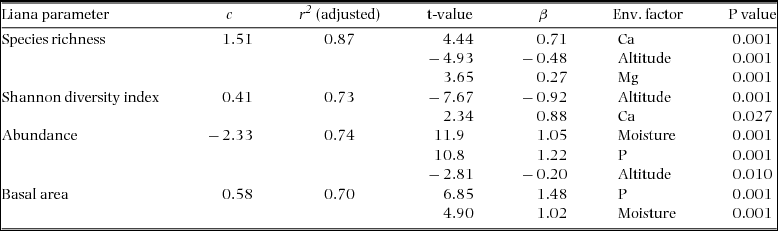
The environmental factors which were selected in the multiple regression explained high proportions of the variation in liana diversity and community structure (r2 = 0.70–0.87). Soil Ca and Mg concentrations had significant positive relationships with liana species richness (Table 3; P < 0.05). In addition, altitude had a significant negative relationship with liana species richness. Shannon diversity index of lianas depended significantly on soil Ca concentration and altitude, although the direction of influence differed (Ca: positive correlation; altitude: negative correlation). Liana abundance and basal area increased significantly with soil P concentration and soil moisture. Furthermore, liana abundance decreased significantly with altitude.
Multiple regression analysis of the effects of environmental (env.) factors on liana diversity (species richness, Shannon diversity index) and community structure (abundance, basal area) in the Atewa Range Forest Reserve, Ghana. Only environmental factors that related significantly (P < 0.05) with the liana parameters were included in the final models. Both the dependent and independent variables were log10-transformed. The terms, c and β denote constant term and parameter estimate, respectively.
Liana species composition
Four environmental factors namely, soil P, moisture and Mg, and altitude correlated best with liana species composition in the study area (Figure 1). Altitude was positively associated with the composition of liana communities in the hill-slope and plateau habitats, while it correlated negatively with liana community composition in the hill-bottom habitat. An opposite trend was observed for soil Mg and P which associated positively with liana community composition in the hill-bottom habitat, but negatively correlated with the composition of liana communities in the hill-slope and plateau habitats. Soil moisture related positively with liana community composition in the plateau habitat to a lager extent. Conversely, soil moisture correlated negatively with hill-bottom-habitat liana community composition.
DISCUSSION
Liana diversity and community structure
A comparison between the current study and a previous one conducted in the same study area (Addo-Fordjour et al. Reference ADDO-FORDJOUR, RAHMAD, AMUI, PINTO and DWOMOH2013b) revealed that liana species richness and abundance were much higher in the present study even when a lower stem diameter threshold (≥ 1 cm) was used in the previous study. A considerable part of the area of the forest reserve used for the previous study had a history of liana harvesting, and this most likely had adverse effects on the number of liana species and individuals in that study. On the other hand, the present study was conducted in areas with moderate human disturbance, devoid of liana removal, which might have enhanced liana assemblages.
Some of the environmental factors measured in this study showed significant relationships with the various measures of liana community assemblages, accounting for large amounts of variation in liana diversity and community structure in the study area. Specifically, concentrations of soil Mg and Ca were identified as significant correlates of liana species richness and Shannon diversity in the current study. This result suggests that these soil macronutrients were possibly important determinants of liana diversity in the study area. This finding supports a previous study which reported a significant correlation of soil Ca and Mg concentrations with liana species richness in a tropical forest in Ghana (Addo-Fordjour et al. Reference ADDO-FORDJOUR, DUAH and AGBESI2013c). The current study revealed that liana abundance increased significantly with soil P concentration in the study area. This phenomenon is consistent with that reported in a subtropical montane forest in Argentina (Malizia et al. Reference MALIZIA, GRAU and LICHSTEIN2010). Soil P has been identified as an essential nutrient involved in basal area increment of some plants in some tropical forests (Baribault et al. Reference BARIBAULT, KOBE and FINLEY2012, Vandecar et al. Reference VANDECAR, LAWRENCE and CLARK2011). In this study, soil P concentration related significantly with liana basal area, indicating that this soil nutrient possibly influenced liana basal area in the study area. Laurance et al. (Reference LAURANCE, PÉREZ-SALICRUP, DELAMÔNICA, FEARNSIDE, D’ANGELO, JEROZOLINSKI, POHL and LOVEJOY2001) observed that liana biomass was positively related with soil P concentration in some central Amazonian rain forests in Brazil. This finding suggests that soil P concentration possibly affected liana basal area in the forests, as biomass of lianas (Putz Reference PUTZ1983) and other plants (Cunningham Reference CUNNINGHAM2001) has been found to relate positively with basal area. This deduction is supported by the finding of the present study, which indicated that soil P concentration also related positively with liana basal area. The significant positive relationships between soil P concentration and the various liana assemblage attributes in the present study as well as previous studies (Laurance et al. Reference LAURANCE, PÉREZ-SALICRUP, DELAMÔNICA, FEARNSIDE, D’ANGELO, JEROZOLINSKI, POHL and LOVEJOY2001, Malizia et al. Reference MALIZIA, GRAU and LICHSTEIN2010) indicate that soil P may be a limiting factor in the growth of lianas. Liana abundance and basal area increased significantly with increasing soil moisture in the current study. A similar trend was reported by some previous studies with regard to liana abundance (Addo-Fordjour et al. Reference ADDO-FORDJOUR, RAHMAD and SHAHRUL2013a, DeWalt et al. Reference DEWALT, ICKES, NILUS, HARMS and BURSLEM2006, Ibarra-Manríquez & Martínez-Ramos Reference IBARRA-MANRÍQUEZ and MARTÍNEZ-RAMOS2002). However, this pattern is not universal since a negative correlation between liana abundance and soil moisture has been reported in some studies (Schnitzer Reference SCHNITZER2005, Swaine & Grace Reference SWAINE and GRACE2007), and even another study did not find any relationship between soil moisture and liana abundance (Malizia et al. Reference MALIZIA, GRAU and LICHSTEIN2010). Generally, the various attributes of liana diversity and community structure in the plateau habitat varied significantly in relation to the other habitats. As indicated earlier, extreme weathering and reduced decomposition at the plateau habitat has resulted in soils which are rich in iron sesquioxides and aluminium, and clay aggregate by organic matter, respectively (Ahn Reference AHN1970). Therefore, the plateau soil is most likely of lower fertility than those in the other habitats. This could have contributed to the lower liana assemblages (diversity, composition, community structure) observed at the plateau habitat compared with the other lower habitats.
The current study revealed the existence of an inverse relationship of liana diversity (species richness and Shannon diversity index) and abundance with altitude, a trend which is consistent with the second hypothesis of this study. The negative correlation between altitude and liana species richness observed in the current study is supported by some previous studies (Addo-Fordjour et al. Reference ADDO-FORDJOUR, RAHMAD and SHAHRUL2013a, Gentry Reference GENTRY, Putz and Mooney1991, Parthasarathy et al. Reference PARTHASARATHY, MUTHURAMKUMAR and REDDY2004). Altitude per se has no direct effects on plant diversity or community structure, and therefore the above-mentioned trends are most likely due to the effects of environmental factors that co-vary with altitude (Körner Reference KÖRNER2007, Lookingbill & Urban Reference LOOKINGBILL and URBAN2005). Altitude and soil Mg, which had considerable effects on liana species richness and community structure in the present study, have been identified as important factors that influence liana ecological amplitude in a south-west Amazonian forest (Macía et al. Reference MACÍA, RUOKOLAINEN, TUOMISTO, QUISBERT and CALA2007). Furthermore, a recent study conducted in Malaysia also identified soil Mg as one of the soil factors that influenced liana species distribution (Nurfazliza et al. Reference NURFAZLIZA, NIZAM and SUPARDI2012). Thus, altitude and soil Mg probably influenced the distribution of individual liana species in addition to their influence on liana diversity and abundance in the study area.
Variation occurred in the patterns of abundance and distribution of liana species in the habitats and plots. Some highly abundant species like G. simplicifolia, A. barteri, A. kamerunensis and C. africanus occurred in all the habitats and were distributed in many plots (≥ 5 plots) within each habitat. However, other species such as Calycobolus heudelotii and Salacia owabiensis were abundant in only one habitat and were distributed in a few plots (< 5 plots) in their respective habitat. The above-mentioned trends may be due to the possession of different traits or physiological properties by different liana species that provide them with varied degrees of ecological amplitudes, or even different degrees of ecological plasticity. The patterns of liana species dominance also varied across the topographic habitats in the current study area. Some of the liana species were highly dominant in all the topographic habitats. Nevertheless, the dominance of other liana species was restricted to only one topographic habitat. Differences in dispersal and vegetative sprouting abilities among liana species as well as differences in lack of specific habitat requirements and seed-predator abundance of liana species have all been hypothesized as possible factors responsible for variations in liana species dominance (Ewango Reference EWANGO2010).
Liana species composition
The current study revealed considerable differences in liana species composition among the topographic habitats, indicating that there was a significant effect of topographic habitat on liana species composition in the study area. The above-mentioned variability in liana species composition, as revealed by the NMDS analysis and backed by ANOSIM, was associated with some environmental factors considered in the current study. Soil P concentration was identified as one of the factors that related to liana species composition in the study area. This finding provides support for a previous study which demonstrated that soil P concentration was positively related to liana species composition in a subtropical montane forest in Argentina (Malizia et al. Reference MALIZIA, GRAU and LICHSTEIN2010). Yuan et al. (Reference YUAN, LIU, TANG and LI2009) reported that soil moisture was an important factor that influenced liana species composition in subtropical hill forests in China. Similarly, soil moisture was identified as an important factor affecting liana species composition within the Atewa Range Forest Reserve of the current study. Interestingly, different environmental factors related with liana species composition of different topographic habitats. Additionally, same environmental factors associated with different topographic habitats but in opposite directions. These trends indicate that environmental heterogeneity observed among the topographic habitats was instrumental in structuring liana species composition in the study area.
CONCLUSION
Liana community composition differed considerably among the topographic habitats, being influenced by soil P, moisture and Mg as well as altitude. Similarly, liana diversity and community structure varied significantly among the topographic habitats. The findings also revealed that liana diversity and community structure significantly depended on some edaphic factors measured in the study area. Finally, liana diversity and abundance decreased significantly with altitude in the study area.
ACKNOWLEDGEMENTS
The authors are grateful to Mr Ntim Gyakari (formerly of Forestry Commission, Ghana) for helping in liana species identification. Financial support for the study was provided by TWAS-USM Postgraduate Fellowship and Research University Grant (RU) (1001/PBIOLOGI/815086).
Liana species dominance within the three topographic habitats in the Atewa Range Forest Reserve, Ghana. Relative density (RD); Relative frequency (RF); Relative basal area (RBA); Importance value index (IVI).