Introduction
In the retinas of birds, a large calyx synapse is formed between the “restricted” type of efferent fiber (rEF) and the soma of an unusual amacrine cell, originally called an “association amacrine cell” by Cajal (Ramón y Cajal, Reference Ramón y Cajal1995; Uchiyama & Stell, Reference Uchiyama and Stell2005). More recently, these amacrine cells have been called efferent target amacrine cells or, simply, target cells (TCs), and it is now known that their presynaptic partners, the rEFs, originate in the isthmo-optic nucleus (ION) of the midbrain (Cowan et al., Reference Cowan, Adamson and Powell1961; Cowan & Powell, Reference Cowan and Powell1963). The ION takes its input largely from the ipsilateral optic tectum and, in ground feeding birds, sends out approximately 8000 myelinated efferent fibers to the contralateral retina where they fan out to make one-to-one synapses with TCs (Cowan & Powell, Reference Cowan and Powell1963; Hayes & Holden, Reference Hayes and Holden1983; Fritzsch et al., Reference Fritzsch, Crapon de Caprona and Clarke1990; Nickla et al., Reference Nickla, Gottlieb, Marin, Rojas, Britto and Wallman1994; Lindstrom et al., Reference Lindstrom, Nacsa, Blankenship, Fitzgerald, Weller, Vaney and Wilson2009). The light responses and receptive field properties of ION neurons have been characterized in a number of studies and, based on these, it seems that the centrifugal, or efferent, system is part of a homotopic loop for rapid feedback of visual signals to the retina (Holden, Reference Holden1968; Holden & Powell, Reference Holden and Powell1972; Miles, Reference Miles1972c). Some direct studies examining the influence of the ION on retinal responses support this view (Miles, Reference Miles1972a; Pearlman & Hughes, Reference Pearlman and Hughes1976b; Uchiyama & Barlow, Reference Uchiyama and Barlow1994; Li et al., Reference Li, Xiao, Fu and Wang1998), but the true function of this efferent system, nevertheless, remains uncertain.
This efferent system, by providing input to a lower processing level, the retina, from a higher level, the ION, constitutes an example of the descending input that forms a common motif within the central nervous system and about which little is understood. It remains to be seen how much the organization and function of this loop within the visual system typifies those seen elsewhere in the brain, but as a model, it has the practical advantages of accessibility and well-defined anatomy.
In this study, we report the first physiological recordings from TCs in retinal slices and combine these with immunohistochemistry to uncover the likely identity of the transmitter used by efferent fibers. Suggested candidates for this role are acetylcholine (Nickla et al., Reference Nickla, Gottlieb, Marin, Rojas, Britto and Wallman1994), glutamate (Miles, Reference Miles1972a; Fischer & Stell, Reference Fischer and Stell1999), or, alternatively, an inhibitory transmitter (Pearlman & Hughes, Reference Pearlman and Hughes1973; Holden, Reference Holden1978). In addition to a conventional transmitter whose presence is indicated by the clouds of vesicles surrounding the numerous active zones of the rEF terminals (Lindstrom et al., Reference Lindstrom, Nacsa, Blankenship, Fitzgerald, Weller, Vaney and Wilson2009), there is evidence that nitric oxide also plays a role at this synapse. Both the rEF and the TC express nitric oxide synthase (Morgan et al., Reference Morgan, Miethke and Li1994; Goureau et al., Reference Goureau, Regnier-Ricard, Jonet, Jeanny, Courtois and Chany-Fournier1997; Fischer & Stell, Reference Fischer and Stell1999; Posada & Clarke, Reference Posada and Clarke1999; Rios et al., Reference Rios, Lopez-Costa, Fosser, Brusco and Saavedra2000; Lindstrom et al., Reference Lindstrom, Nacsa, Blankenship, Fitzgerald, Weller, Vaney and Wilson2009).
The anatomy of TCs is extraordinary. They do not have a typical dendritic tree, instead the large soma gives rise to a compact basketwork of dendrites extending no more than a few micrometers. This diminutive dendritic zone constitutes a private neuropil since it lies in the inner nuclear layer (INL), the cellular layer of the inner retina, rather than the inner plexiform layer (IPL) where neurons characteristically make synapses (Lindstrom et al., Reference Lindstrom, Nacsa, Blankenship, Fitzgerald, Weller, Vaney and Wilson2009). A single axon leaves the soma, which is invariably located in the ventral retina, and typically runs a great distance in the retina before terminating in a small field of synapses with neurons that are probably amacrine cells (Ramón y Cajal, Reference Ramón y Cajal1995; Uchiyama et al., Reference Uchiyama, Aoki, Yonezawa, Arimura and Ohno2004). Cajal classified TCs as amacrine cells, but their uniqueness has prompted others to suggest that they deserve their own class (Uchiyama & Stell, Reference Uchiyama and Stell2005). The function of these neurons is unknown, but they clearly constitute a crucial component of the efferent system. TCs have commonly been thought of as slave or relay neurons, driven exclusively by input from efferent fibers (Uchiyama & Stell, Reference Uchiyama and Stell2005) and in turn passing these signals to their postsynaptic partners in the dorsal retina (Uchiyama et al., Reference Uchiyama, Aoki, Yonezawa, Arimura and Ohno2004). In a recent study, however, we showed ultrastructural evidence for at least one additional type of synaptic input to TCs originating from neurons within the retina (Lindstrom et al., Reference Lindstrom, Nacsa, Blankenship, Fitzgerald, Weller, Vaney and Wilson2009). From the pleomorphic appearance of synaptic vesicles in these other presynaptic structures, we speculated that they might be GABAergic. We show here, using pharmacology, that there is indeed more than one synaptic input to TCs, and at least part of the retinal input is mediated by GABA, even though it is excitatory.
Materials and methods
Ethical approval
A total of one hundred and forty one 2- to 3-week-old White Leghorn chickens (Gallus gallus) were used in this study. Chickens were hatched from eggs obtained from the Avian Sciences Facility of the University of California, Davis. All methods were reviewed and approved by the Institutional Animal Care and Use Committee.
Labeling of efferent fibers and preparation of slices
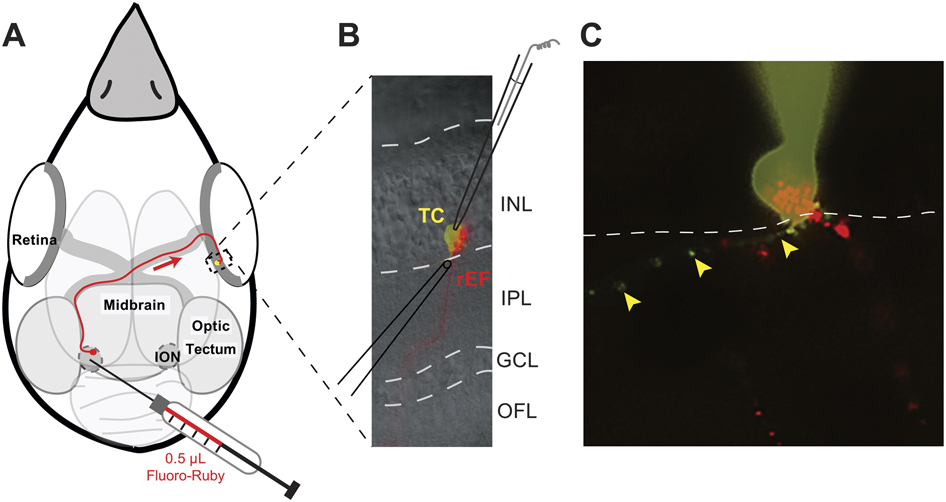
The labeling of efferent fibers by injection of Fluoro-Ruby into the left ION followed the procedure described previously (Lindstrom et al., Reference Lindstrom, Nacsa, Blankenship, Fitzgerald, Weller, Vaney and Wilson2009) and shown diagrammatically in Fig. 1A. Following a minimum survival period of 3 days, the chicken was euthanized by intraperitoneal injection of a lethal dose of pentobarbital (Beuthanasia-D, 047305; Webster Veterinary, Sterling, MA). The right eye was quickly removed and chilled on ice for approximately 30 s, then hemisected just posterior to the ora serata. The anterior chamber and vitreous were removed, and the posterior eyecup was placed in chilled Ca2+-free Hank’s solution (14170; GIBCO/Invitrogen, Carlsbad, CA). Two squares, corresponding to the regions of the retina where rEFs are found in highest density, were cut out of the eyecup using a scalpel. They were created by making a dorsal–ventral cut along each side of the pecten and a temporal–nasal cut 1 mm dorsal to the end of the pecten. The most ventral and peripheral portions of the eyecup were removed, leaving two 5 × 5 mm squares, one from the nasal retina and one from the temporal retina. Each square was further cut into four equal squares, which were stored in oxygenated (5% carbon dioxide and 95% oxygen) normal external solution [(mM): NaCl 100, KCl 6, CaCl2 1, MgSO4 2, NaHCO3 30, and Glucose 50] at room temperature until slicing.
Methods used to label rEFs and record from TCs. (A) Schematic illustration of the labeling method. Under stereotaxic control, 0.5 μl of the anatomical tracer, Fluoro-Ruby, was injected unilaterally into the ION. Isthmo-optic neurons took up Fluoro-Ruby and transported it to their axon terminals (red arrow). After a minimum survival of 3 days, sufficient Fluoro-Ruby accumulated in the rEF terminals to allow their visualization in retinal slices. (B) A retinal slice imaged in IR-DIC and fluorescence optics. A single rEF is shown (red) crossing the IPL and terminating in a pericellular nest in the INL. Identifying the postsynaptic TC from its DIC outline and contact with the rEF terminal, a patch-clamp pipet (shown in cartoon) was used to fill the cell with Lucifer Yellow (LY). This cell could also be stimulated with exogenous neurotransmitters from a puff pipet placed as illustrated. (C) A typical LY-filled TC with attached pipet (yellow), showing the TC axon (arrowheads) and close apposition between the stubby TC dendrites and rEF pericellular nest (red), features that were used to confirm identity of the recorded TC. The boundary between the INL and IPL is indicated with a dashed line.

Immediately prior to slicing, each retinal square was first attached to a piece of Millipore filter (mixed cellulose ester, 0.8 μm pore; AAB02500; Millipore, Bedford, MA), ganglion cell side down. After removing the sclera and retinal-pigmented epithelium, a manual tissue slicer was used to create retinal slices of 100- to 300-μm thickness. Slicing was performed in Ca2+-free Hank’s solution. Slices of the desired thickness were positioned on a coverslip using Apeizon T grease, mounted in a recording chamber (RC26GLP; Warner Instruments, Hamden, CT), and rinsed with oxygenated (5% carbon dioxide and 95% oxygen) normal external solution.
Slice recording
The recording chamber was mounted in an Olympus upright fluorescence microscope (BX51W1) and continuously perfused with warmed (34°C) and oxygenated (5% carbon dioxide and 95% oxygen) external solution, either a normal or a high Mg2+/0 Ca2+ external solution [(mM): NaCl 90, KCl 6, MgCl2 8, MgSO4 2, NaHCO3 30, and Glucose 50] that was used to block synaptic transmission (Masland & Ames, Reference Masland and Ames1976). External solutions could be rapidly changed using a multiwell gravity-fed perfusion system. Drug solutions were prepared as stock solutions in water (except GYKI-53655, which was prepared in DMSO), then diluted in the appropriate external solution. Stock solutions were aliquotted and stored at −20°C until use.
GABA receptor activity was examined using 10–100 μM (-)-Bicuculline methobromide (EA-109; Biomol/Enzo Life Sciences, Plymouth Meeting, PA) or methiodide (B6889; Sigma, St. Louis, MO), a GABAA receptor antagonist; 20 μM GABAzine (SR 95531 hydrobromide), a competitive GABAA receptor antagonist (Fischer, Pittsburgh, PA or Sigma); and 10–50 μM TPMPA ((1,2,5,6-tetrahydropyridin-4-yl)methylphosphinic acid), a competitive GABAC receptor antagonist (1040; Tocris Bioscience, Ellisville, MO). Glutamate receptor activity was examined using 10 μM GYKI-53655 (the generous gift of Dr. Matt Frerking), which, at this concentration, will block >90% of the AMPA current without significantly affecting the kainate or NMDA currents (Paternain et al., Reference Paternain, Morales and Lerma1995; Wilding & Huettner, Reference Wilding and Huettner1995); 10 μM NBQX (1,2,3,4-tetrahydro-6-nitro-2,3-dioxo-benzo[f]quinoxaline-7-sulfonamide; N183; Sigma), an antagonist of AMPA and kainate receptors; and 20 μM APV (D-(-)-2-amino-5-phosphonopentanoic acid; Calbiochem, EMD Chemicals Inc, Gibbstown, NJ), a competitive NMDA receptor antagonist. DNQX (6,7-dinitroquinoxaline-2,3-dione; 2312; Tocris) was also used as an antagonist for AMPA and kainate receptors at a concentration of 20 μM, substantially lower than the IC50 for binding at the glycine site of native NMDA receptors (Randle et al., Reference Randle, Guet, Bobichon, Moreau, Curutchet, Lambolez, de Carvalho, Cordi and Lepagnol1992). In order to examine the APs produced by TCs, Na+ channels were reversibly blocked with 0.1 μM Tetrodotoxin (TTX).
Images of slices were acquired using a cooled infrared sensitive camera (Rolera; Q Imaging, Surrey, BC, Canada) and displayed using QCapture Pro software. Fluoro-Ruby-labeled efferent terminals were detected using illumination from a mercury source (HBO 103W/2; OSRAM, Sylvania, Danvers MA, or Osram, München, Germany) and a rhodamine filter cube (41002a; Chroma Technology Corp., Bellows Falls, VT; 535/50 BP excitation filter, 620/60 BP emission filter). Once an efferent terminal was located, infrared differential interference contrast (IR-DIC) was used to locate the soma of the TC and position the patch electrode and puff pipet as illustrated in Fig. 1B.
Patch electrodes pulled from borosilicate glass tubing (1.5 mm outer diameter, 0.86 mm inner diameter; Sutter Instruments Co., Novato, CA) had a tip resistance of 5–10 MΩ when measured in the bath. Typically, patch electrodes were filled with Cesium methanesulfonate (CsMs) internal solution [(mM): CsCl 9, CsMs 131, EGTA 1.1, HEPES 10, MgCl2 2, and CaCl2 0.1). In a few initial recordings, patch-electrodes were filled with KCl internal solution [(mM): KCl 140, EGTA 1.1, HEPES 10, MgCl2 2, and CaCl2 0.1]. To confirm the identity of recorded cells, all internal solutions also contained Lucifer Yellow (0.02%; Sigma), allowing imaging with a Lucifer Yellow filter cube (31010; Chroma; 425/40 BP excitation filter, 540/50 BP emission filter). The experimentally determined liquid junction potential between normal external and CsMs internal solutions was approximately −8.5 mV. All voltages have been corrected for this junction potential. The measured series resistance for these experiments was 17.1 ± 6.6 MΩ (mean ± s.d.).
Puff pipets were filled with normal external solution containing 100 μM glutamate (Fischer); 150 μM GABA (Fischer); or 100 μM Epibatidine (E1145; Sigma), a nicotinic acetylcholine receptor antagonist. In the high Mg2+ control experiments, the puffed drug was dissolved in high Mg2+/0 Ca2+ external solution.
Data analysis
Except for recordings of the relatively slow responses to puffs of glutamate, GABA, or epibatidine, which were low-pass filtered at 100 Hz, all intracellular recordings were filtered with a 1500 Hz low-pass Gaussian filter implemented in software. Extracellular recordings were typically band-pass filtered at 40–1000 Hz. Event timing and the peak amplitude of postsynaptic currents (PSCs) were determined using Clampfit’s threshold search function.
PSC rise times and decay constants (τ) were determined by first averaging the traces of 10 or more individual PSCs (aligned by their peaks). The decay phase of the resultant trace was fitted with the sum of two exponentials, using SigmaPlot’s fitting function to determine τ 1 and τ 2. The rise time was the time required for the average PSC trace to rise from 10 to 90% of the peak amplitude.
To determine the reversal potentials of the GABA- and glutamate-puff responses, the current–voltage (I–V) relation for each cell was fitted with a linear (GABA) or quadratic polynomial function (glutamate), and the point where the fit crossed the voltage axis was taken as the reversal potential. In the case of GABA, the entire I–V relation was fitted. However, for glutamate, only the portion of the I–V relation from the negative peak produced by the voltage dependence of the Mg2+ block of NMDA receptors (approximately −30 mV to 50 mV) was fitted.
SigmaStat software was used for all statistical analyses. The mean response values (frequency, amplitude, and latency) were calculated for each condition (normal, drugs, and wash) for each cell. Given the large variability in normal frequency and amplitude between cells, these two response values were typically normalized prior to statistical analysis. Unless indicated otherwise, one-way repeated measures analyses of variance (ANOVAs) were performed to compare the mean response values for each condition for the number of cells indicated (n). Where appropriate, data are presented as mean ± s.d. For those experiments in which we examined the effect of glutamate receptor antagonists on PSC frequency, the distribution of frequency values did not pass the normality test, so a Friedman repeated measures ANOVA on ranks was used (results are reported as the median and 25th to 75th percentile range).
Tissue preparation for fluorescence microscopy
Following a minimum survival period of 3 days from the injection of label, animals were euthanized with a lethal dose of pentobarbital (Beuthanasia-D, 047305; Webster Veterinary). Once the animal was deeply anesthetized, as assessed by a lack of the toe-pinch reflex, it was transcardially perfused with phosphate-buffered saline (PBS; Sigma), followed by 4% paraformaldehyde (P6148; Sigma) in PBS. The right eye was removed and hemisected. The anterior chamber and vitreous were discarded, while the retina and sclera were postfixed in chilled 4% paraformaldehyde for 20 min (for GluR1, GluR2/3, or GABAA receptor antibodies) or 1–2 h (for all other antibodies). In cases where Fluoro-Ruby-labeled efferent terminals were not required (e.g., double labeling with parvalbumin antibodies), the left eye was also removed and fixed in the same manner.
The eyecup was rinsed with PBS and cut into the high rEF density squares described in slice preparation, separated from the sclera, and placed in 30% sucrose solution at 4°C until equilibrated (typically overnight). The following day, they were embedded in OCT medium (27050; Ted Pella, Redding, CA), frozen on dry ice, and stored at −20°C until sectioning. Sections of 12–20 μm were cut on a cryostat (CM1900; Leica Microsystems Inc, Bannockburn, IL) and stored at −20°C.
Retinal sections were processed using standard immunohistochemistry techniques. Autofluorescence was quenched using 1% glycine in 0.3% Triton–PBS for 15 min. A blocking solution containing 2–10% normal goat serum, 2–4% bovine serum albumin (BSA), and 0.3% Triton in PBS was applied for 1 h at room temperature. Sections were incubated with primary antibodies diluted in blocking solution for 16–24 h at 4°C, washed 3× in PBS (40, 20, and 20 min), and then incubated with secondary antibodies diluted in PBS or blocking solution for 1–2 h at room temperature. The sections were then washed with PBS and coverslipped with VectaShield hardset mounting medium. There were three cases in which this standard procedure was slightly modified. First, in sections labeled with anti-GABAA-R α1-subunit or anti-vGluT1 antibodies, 0.1% Tween-20 was substituted for Triton. Second, for sections labeled with the anti-ChAT antibody, 8% normal donkey serum was used instead of normal goat serum. Third, sections labeled with the NKCC antibody underwent a 5-min pretreatment with 1% sodium dodecyl sulfate (161-0300; Bio-Rad Laboratories, Hercules, CA) in PBS between the quenching and blocking steps. Sections were blocked for 30 min in a solution containing 10% normal goat serum, 2% BSA, 0.3% Triton, 1% Saponin (16109; Sigma), and 0.2% SDS and were incubated with the NKCC antibody diluted in block for 1 h. All subsequent washes and secondary antibody application followed the standard procedure outlined above. Typically, rabbit anti-tetramethylrhodamine (TMR) or mouse anti-Rhodamine was used to amplify the signal associated with Fluoro-Ruby-labeled rEFs. Secondary controls (in which retinal sections were only incubated with the secondary antibody) were performed with each procedure to provide a measure of background fluorescence.
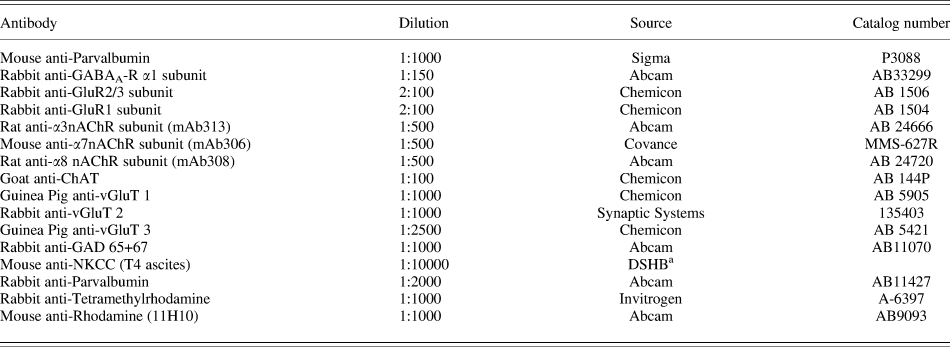
A list of the primary antibodies used, their dilutions, and their source can be found in Table 1. All secondary antibodies (Goat anti-Mouse, Goat anti-Guinea Pig, Goat anti-Rabbit, Donkey anti-Goat, Donkey anti-Mouse, and Donkey anti-Rabbit) were obtained from Invitrogen, Carlsbad, CA and were used at a dilution of 1:500. Alexa 488 or 568 conjugates were used as appropriate.
Primary antibodies

a DSHB is the University of Iowa Developmental Studies Hybridoma Bank.
Immunohistochemistry imaging
Stained sections were examined using an inverted confocal microscope (Olympus FLUOVIEW; Olympus America Inc, Center Valley, PA) with krypton (488 nm) and argon (568 nm) lasers. Images were converted to 24-bit TIF images in Fluoview software and then transferred to Adobe Photoshop for adjustment of brightness, contrast, and sharpness. Images of antibody-labeled tissue were always processed with images of the corresponding secondary control to assure that these adjustments did not produce false results. The images of the secondary controls are not shown, but they typically look black, except for some autofluorescence in the photoreceptor outer segments and oil droplets.
Results
Identification of TCs
To acquire patch-clamp recordings from TCs, we made retinal slices from 141 chickens, using the regions of high rEF density as defined in the density map of Lindstrom et al. (Reference Lindstrom, Nacsa, Blankenship, Fitzgerald, Weller, Vaney and Wilson2009). Three days before retinal slices were made, the contralateral ION was labeled with Fluoro-Ruby (Fig. 1), which allowed sufficient time for the label to be transported to the rEF terminals in the retina. Depending on the fraction of ION neurons labeled, a typical retinal slice contained between 2 and 10 labeled terminals that were accessible to the patch electrode. Since rEF terminals form an encircling pericellular nest around their postsynaptic partner (Lindstrom et al., Reference Lindstrom, Nacsa, Blankenship, Fitzgerald, Weller, Vaney and Wilson2009), we were able to infer the location of the postsynaptic element and image its outline with IR-DIC optics. As we expected from anatomical studies, the postsynaptic element (revealed by Lucifer Yellow filling from the patch pipet) was the soma of a TC. These unusual cells were unambiguously distinguished by their unique morphology, a relatively large prolate soma, a compact basket of short anastomosing dendrites, and an axon that typically ran along the border of the INL and IPL until reaching an edge of the slice (Fig. 1C).
Although IR-DIC optics clearly revealed TCs, a relatively low success rate in patching these cells was largely due to their tight investment by Muller cells, as shown by electron microscopy (Lindstrom et al., Reference Lindstrom, Nacsa, Blankenship, Fitzgerald, Weller, Vaney and Wilson2009). Nevertheless, 181 TCs were patch clamped, of which 89 survived long enough to contribute data to one or more of the experiments described below. Only in one instance did we observe (but did not record from) another cell type as the postsynaptic element to a labeled rEF. From its large, round pale soma, this cell was a displaced ganglion cell (DGC). This finding reveals that DGCs do receive rEF input but only rarely (only 1 in >500 observed rEF terminals), meaning that DGCs are not a principal recipient of rEF input as was claimed in pigeon (Maturana & Frenk, Reference Maturana and Frenk1965).
TCs are spiking neurons
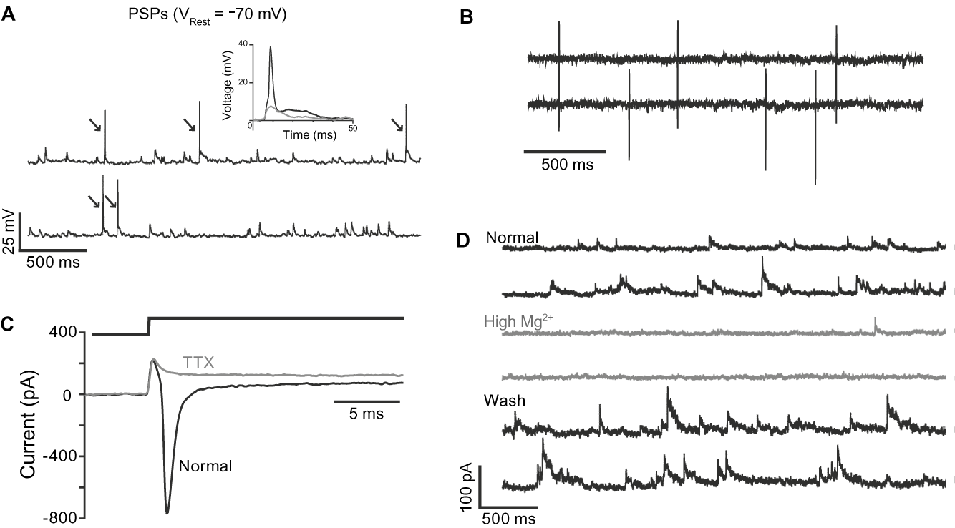
Upon membrane rupture, TCs were seen to have a resting membrane potential (V Rest) of −62 ± 7 mV (n = 7 cells, with KCl internal) and a membrane capacitance of 7.4 ± 2.3 pF (n = 76). A characteristic feature of these cells is that in current clamp, they typically displayed a barrage of spontaneous depolarizing synaptic potentials upon which APs frequently rode (Fig. 2A).
TCs produce APs that can be triggered by spontaneous PSPs. (A) Sample traces from a current-clamp recording of a TC showing many spontaneous PSPs, five are ridden by APs (arrows). Inset shows detail of a single AP (black) superimposed on a single PSP (gray). Recorded using KCl intracellular solution. (B) Extracellular recording of APs obtained during loose-patch recording from a TC. (C) A voltage step from −79.5 to −59.5 mV (top trace) elicited a rapid and transient current in a voltage-clamped TC (lower black trace). Application of 0.1 μM TTX completely suppressed this current (gray trace), implying that TCs have functional voltage-gated Na+ channels. Recorded using CsMs intracellular solution. (D) Voltage-clamp recordings from a TC held at −20 mV show that high Mg2+external blocks most of the spontaneous PSCs recorded in the TC. In normal external (upper black traces), this TC received a steady stream of spontaneous synaptic input. The vast majority of this input was blocked by high Mg2+/0 Ca2+ external (gray traces). This effect was fully reversible by washing with normal external (lower black traces). Recorded using CsMs intracellular solution.

We analyzed the characteristics of spontaneous postsynaptic potentials (PSPs) in seven current-clamped TCs using KCl internal solution (E Cl− = +3.3 mV). The mean PSP amplitude and frequency were 6.2 ± 1.6 mV and 6.6 ± 2.1 Hz, respectively. We also examined the properties of APs, which in four of these cells were readily distinguished from PSPs by their rapid kinetics and larger amplitudes (inset in Fig. 2A). Rise times for each cell were determined by averaging isolated events aligned to their peaks and measuring time from 10–90% of peak. The mean PSP rise time was 2.8 ± 0.9 ms. APs had a significantly larger amplitude (43.2 ± 13.1 mV) and shorter rise time (0.6 ± 0.1 ms) than the PSPs. AP frequency was 2.5 ± 1.7 Hz, approximately one third of the PSP frequency (n = 4 cells). Prior to membrane rupture, APs could be recorded in loose-patch configuration (Fig. 2B) and were seen at a frequency of 2.2 ± 1.4 Hz (n = 6 cells), not significantly different from that seen in the whole-cell current-clamp recordings described above (P = 0.768). We infer from this that membrane rupture, when using the KCl internal solution, did not substantially change the excitability of these cells or their synaptic input.
In voltage-clamp mode, spontaneous PSCs were seen, and some of the larger ones generated action currents, though at a much reduced frequency of 0.4 ± 0.5 Hz (same four cells used to analyze AP frequency in current clamp). A +20 mV step from the holding voltage (V H) of −70 mV (Fig. 2C) typically produced an action current that could be blocked with 0.1 μM TTX (Fig. 2C; n = 4 cells). TTX was also capable of blocking action currents generated by spontaneous PSCs. We infer that a sodium-based AP is initiated in a poorly voltage-clamped region, very likely the narrow tapering initial segment of the axon, and thus it is not blocked by the V H of −70 mV. TTX did not eliminate all synaptic input to the TC (mean PSC frequency in TTX relative to normal: 0.32 ± 0.1, wash: 0.83 ± 0.72).
TCs respond to putative transmitters
For the remainder of this study, we used CsMs internal solution, which had the effect of linearizing the I–V relations for TCs by suppressing a large outward current elicited by depolarization. Cesium also caused the zero current potential (resting membrane potential) to shift from approximately −60 mV (reported above) to about −20 mV, presumably by suppressing K+ current activated at rest. Spontaneous inward PSCs were visible at −70 mV with CsMs internal solution. An important attribute of the CsMs internal solution was that by having low internal Cl− (E Cl− = −56 mV), it allowed the separation of cation and anion carried currents, although, as we show, the undisturbed value for E Cl− is likely to be significantly more positive than this.
The external solution for many of the following experiments contained high Mg2+/0 Ca2+ so that we could be assured that drug effects represented direct effects on TCs. This external solution reversibly eliminated virtually all spontaneous PSCs in our cells (Fig. 2D). PSC frequency, 9.3 ± 7.7 Hz in normal, was reduced to 0.34 ± 0.42 Hz in high Mg2+external solution (P < 0.01; n = 11 cells). PSC frequency returned to 6.0 ± 7.3 Hz in wash.
To determine which neurotransmitter receptors are expressed by TCs, voltage-clamp recordings were obtained from a TC while puffs of neurotransmitter agonists (glutamate, GABA, or epibatidine) were applied to the soma at a minimum interval of 1 s. Peak currents were calculated from the average of 2–10 responses in each cell, and in order to determine whether these drug responses were direct or indirect effects, we compared the responses obtained in normal external to those obtained in high Mg2+external solutions in which synaptic transmission was suppressed.
TCs have functional glutamate receptors
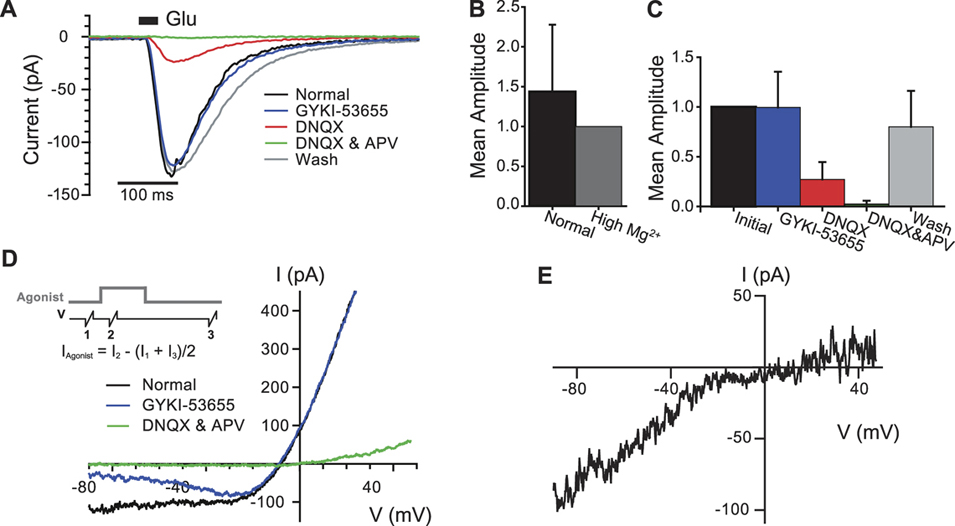
Brief (20 ms) puffs of glutamate were applied to the soma. In normal external solution, puffs of 100 μM glutamate reliably evoked inward currents (−90 ± 78 pA) at the holding potential of −20 mV (n = 12 cells). A typical puff response is shown in Fig. 3A. Since some of the recorded TCs were on the surface of the slice, while others were as many as three cell layers deep, some of the variability in puff response amplitude is attributable to differences in the concentration of glutamate reaching the TC soma. Fig. 3B shows that the peak amplitude of the glutamate-puff response was not significantly reduced in high Mg2+/0 Ca2+ external solution (P = 0.309, n = 5 cells, data normalized to the response in high Mg2+). Thus, the glutamate-puff response, at least the slow component illustrated in Fig. 3A, is due to activation of glutamate receptors on the TC itself, not through an indirect interaction with a neighboring cell.
Pharmacological characterization of glutamate receptors on TCs. (A) Voltage-clamp recordings from a TC showing the typical response (black trace) to a 20 ms puff of glutamate (V H = −20 mV). 100 μM glutamate (Glu, black bar) elicited a large inward current in normal external (black trace). The glutamate-puff response was significantly decreased by DNQX (red trace) and completely eliminated by DNQX and APV (green trace), but GYKI-53655 (blue trace) had little effect at this voltage. Full recovery was achieved in wash (gray trace). (B) Comparison of the amplitude of the glutamate-puff response in normal and high Mg2+/0 Ca2+ external. Prior to grouping, the mean amplitude of the glutamate-puff response in each cell was normalized to the mean amplitude of the response in high Mg2+. No significant difference was detected (n = 5 cells). (C) Summary of the effects of glutamate antagonists on the glutamate-puff responses of eight TCs. Data have been pooled from cells recorded in normal and high Mg2+/0 Ca2+ external (see text); thus, the term “initial” has been used to signify the response prior to application of any glutamate antagonist. (D) I–V relations of the glutamate-puff response. The protocol used to determine the I–V relation of the puff response is illustrated in the inset; gray trace shows the timing of the puff of agonist (glutamate), black trace shows the timing of the voltage ramps. In normal external (black), the I–V relation of the glutamate-puff response showed strong outward rectification and reversed at −8.4 mV. Evidence for the presence of Ca2+-permeable AMPA receptors is provided by the ability of GYKI-53655 (blue) to reduce current at more negative voltages but not at positive voltages. The isolated AMPA-mediated component of the I–V relation (i.e., the difference between normal and GYKI-53655) is shown in (E). The negative slope between −80 and −30 mV is indicative of a significant NMDA-mediated component. The combined application of DNQX and APV blocked the glutamate-puff response at all voltages (bright green trace). The wash trace is omitted.

We evaluated the contribution of AMPA, kainate, and NMDA receptors to the glutamate-puff response using antagonists alone and in combination. For the cell shown in Fig. 3A, 10 μM GYKI-53655, an AMPA receptor selective antagonist (Paternain et al., Reference Paternain, Morales and Lerma1995; Wilding & Huettner, Reference Wilding and Huettner1995), had little effect on the amplitude of the glutamate-puff response at −20 mV, but 20 μM DNQX (an antagonist of both AMPA and kainate receptors) significantly reduced the response amplitude when applied alone. When 20 μM APV (an NMDA receptor selective antagonist) was subsequently applied in the presence of DNQX, the glutamate-puff response was completely eliminated. Washing reversed the effects of these antagonists.
Similar results were recorded from seven other TCs in two sets of experiments, one performed in normal external and another in high Mg2+/0 Ca2+ external. Two-way repeated measures ANOVA applied to the results obtained in normal and high Mg2+/0 Ca2+ external showed that all significant differences were attributable to the drug condition (i.e., the presence or absence of one or more of the glutamate antagonists mentioned; P < 0.001). No significant differences were associated with the type of external solution used (i.e., normal or high Mg2+; P = 0.245) nor was there an interaction between the type of external solution and the drug condition (P = 0.378). For this reason, the effects of these glutamate antagonists on the glutamate-puff response were evaluated using data pooled from both normal and high Mg2+/0 Ca2+ experiments and are summarized in Fig. 3C. These results would seem to indicate that although kainate and NMDA receptors are present on TCs, AMPA receptors are absent. However, we will show that AMPA receptors are in fact present but are not apparent at all voltages.
Current–voltage (I–V) relations for the glutamate-evoked current were obtained using voltage ramps (−90 to +50 mV in 200 ms) before, during (250 ms after the start), and approximately 3 s after a puff of glutamate (inset Fig. 3D), when the evoked current had returned to baseline. This protocol was typically repeated twice and averaged for each condition (normal, antagonist, and wash). Prior to each voltage ramp, TCs were held at −20 mV, thereby inactivating the voltage-gated Na+ current. The glutamate-evoked current was determined as a subtraction of averaged ramp currents with and without glutamate-puff.
In normal external, the glutamate I–V showed strong outward rectification (black trace in Fig. 3D) and a reversal potential (E Glu) of −6.3 ± 3.4 mV (n = 10 cells). This was somewhat more negative than the EGlu of 0 mV expected if the glutamate channels present were equally permeable to all cations. This discrepancy is probably due to the somewhat greater permeability of glutamate channels to Cs+ relative to Na+ (Hille, Reference Hille2001). Although in the prior experiments at a fixed V H of −20 mV we saw no evidence for the presence of AMPA receptors, in these voltage ramp measurements, GYKI-53655 clearly reduced the glutamate-puff response at voltages negative to −40 mV (blue trace in Fig. 3D). By appropriate current subtractions, we obtained the I–V relations for the AMPA-mediated current (Fig. 3E), which is strongly inward rectifying. Glutamate receptors, including GluR1, GluR3, and GluR4 subunits, show strong inward rectification and Ca2+ permeability if these subunits are expressed in the absence of GluR2 receptors or if the GluR2 receptors have been edited to have a glutamine (Q) at the Q/R site (Hollmann et al., Reference Hollmann, Hartley and Heinemann1991; Verdoorn et al., Reference Verdoorn, Burnashev, Monyer, Seeburg and Sakmann1991). We infer from the observed strong inward rectification of AMPARs in TCs that they exhibit Ca2+ permeability.
Blocking the AMPA-mediated component revealed a negative slope, between −80 and −30 mV (Fig. 3D, blue trace), indicative of the voltage-dependent relief from Mg2+-block that is typical of NMDA receptors (Mayer et al., Reference Mayer, Westbrook and Guthrie1984). Blocking AMPA, kainate, and NMDA receptors with the combination of DNQX and APV practically eliminated the glutamate-evoked current, except at the most positive voltages (Fig. 3D). In all cells but one, the effect of DNQX and APV was reversed in wash. Based on these results, it appears that TCs express functional AMPA, kainate, and NMDA receptors and that as a consequence of their complementary I–V relations, glutamate produces a current that is largely independent of voltage over most of the TC’s operating range.
TCs fail to respond to a nicotinic agonist
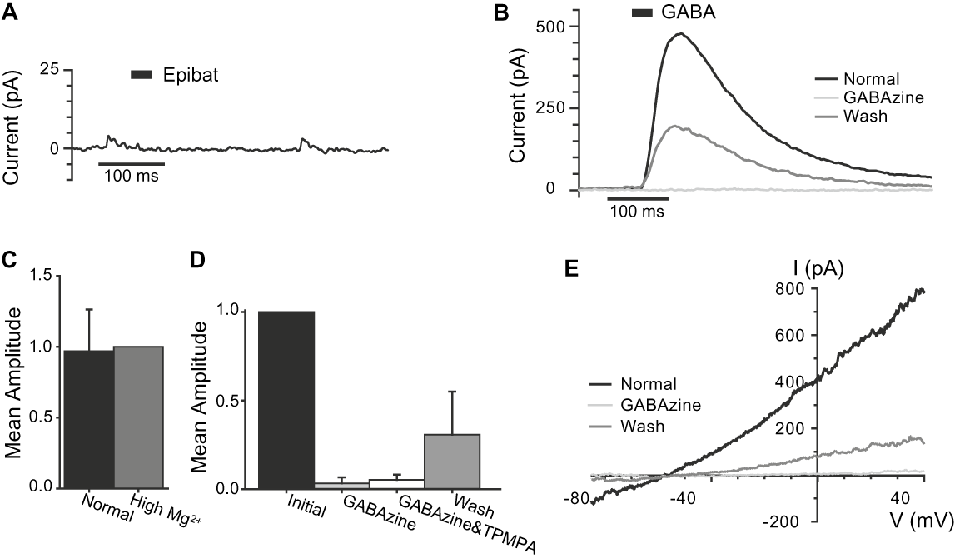
A study by Nickla et al. (Reference Nickla, Gottlieb, Marin, Rojas, Britto and Wallman1994) suggests that TCs and/or rEFs express the α7 subunit of the nicotinic acetylcholine receptor (nAChR). We therefore examined TC responses to puffs of epibatidine, a nicotinic agonist. In four cells with normal rates of spontaneous PSCs recorded in normal external solution, TCs failed to respond to brief (20 ms; Fig. 4A) or long (up to 540 ms) puffs of 100 μM epibatidine. Given that epibatidine is a strong agonist (activation in the nanomolar and low micromolar range) of all nAChRs (Gerzanich et al., Reference Gerzanich, Peng, Wang, Wells, Anand, Fletcher and Lindstrom1995), we conclude that functional nAChRs are not expressed in TCs.
Pharmacological characterization of GABA receptors on TCs. (A) Voltage-clamp recording from a TC during puff application of 100 μM epibatidine (Epibat, black bar). Trace shown is the average of four trials, in none of which was a response elicited. The two small events visible in this trace are the result of spontaneous PSCs that occurred during the third trial. (B) 150 μM GABA (black bar) elicited a large outward current in normal external (black trace), which was completely eliminated by 20 μM GABAzine (light gray trace) and partially recovered after washing (dark gray trace). (C) Comparison of the amplitude of the GABA-puff response in normal and high Mg2+/0 Ca2+ external, as in Fig. 3B. No significant difference was detected (n = 5 cells). (D) Summary of the effect of GABAzine (with or without TPMPA) on the GABA-puff response in 10 TCs. Data have been pooled as in the glutamate experiments (Fig. 3C). The mean amplitude of the GABA-puff response was reduced to practically zero by GABAzine and further addition of TPMPA (n = 3 cells) did not further reduce the amplitude. Partial reversal was seen in wash. (E) I–V relations of the GABA-puff response using the same protocol as illustrated in Fig. 3D. In normal external (black), the I–V relation of the GABA-puff response was weakly outward rectifying, reversing at −59 mV. GABAzine blocked the response at all voltages (light gray). This effect was only partially reversed in wash (dark gray).

TCs have functional GABAA receptors
In normal external solution, brief (20 ms) puffs of 150 μM GABA, applied to the soma at a V H of −20 mV, reliably evoked a large outward current (n = 10 cells, Fig. 4B), whose peak amplitude varied greatly from cell to cell (38–799 pA; mean 285 pA). As with the glutamate-puff experiments, much of the variability in puff response amplitude is attributable to differences in the concentration of GABA reaching the TC soma. As shown in Fig. 4C, the amplitude of the GABA-puff response was not significantly reduced in high Mg2+/0 Ca2+ external solution (P = 0.825; n = 5 cells; data normalized to the response in high Mg2+). Thus, the GABA-puff response is mediated by GABA receptors on the TC itself.
We evaluated the contribution of GABAA receptors to the GABA-puff response using the selective antagonist GABAzine (20 μM) (Ueno et al., Reference Ueno, Bracamontes, Zorumski, Weiss and Steinbach1997). For the typical cell shown in Fig. 4B, GABAzine completely blocked the GABA-puff response, but this effect was only partially reversed in wash. Similar recordings were obtained from nine other TCs in two sets of experiments, one done in normal external and another in high Mg2+external. As with glutamate, we pooled data after showing with two-way repeated measures ANOVA that all significant differences were attributable to the drug condition (i.e., before, during, or after GABAzine; P < 0.001, Fig. 4C). These pooled data confirmed the efficacy of GABAzine in inhibiting the GABA-puff response (normalized amplitude, 0.01 ± 0.004 in GABAzine) and the partial recovery in wash (0.31 ± 0.07).
In three cells, we tested whether the addition of TPMPA to GABAzine could further reduce the already very small amplitude of the GABA-puff response. Since no significant effect was seen (normalized amplitude 0.05 ± 0.04 in GABAzine and 0.05 ± 0.03 in GABAzine and TPMPA; P = 0.927), we conclude that TCs express functional GABAA receptors but not GABAC receptors. The I–V relation of the GABA-evoked response, obtained using the same protocol described for glutamate, was slightly outward rectifying with a reversal potential of −52 ± 5 mV (Fig. 4E, n = 10 cells), near the calculated E Cl− of −56 mV.
GABA is an excitatory neurotransmitter in TCs
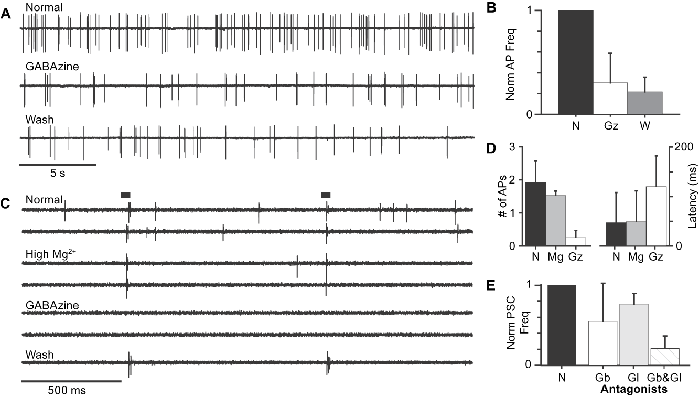
Extracellular recordings of TC APs were occasionally acquired prior to patching a TC. In six cells examined in this way, application of 20 μM GABAzine decreased spontaneous AP frequency (P < 0.01), although the degree of reduction varied greatly from cell to cell. AP frequency in GABAzine ranged from 1 to 66% of AP frequency in normal external (2.16 ± 1.44 Hz), with a mean of 30% (Fig. 5A and 5B). Reversal of this effect in wash was not always seen, however. Consistent with this effect of GABAzine, we found that puffs of GABA ranging in duration from 20 ms to 1.5 s typically evoked one to three APs (mean, 1.8; n = 8 cells), at a mean latency of 40 ± 40 ms. Although the latency measured in any one cell was consistent from trial to trial (Fig. 5C), variability between cells was large, presumably because of differences in accessibility to drug.
GABA input to the TC is excitatory. (A) Extracellularly recorded spontaneous APs from a TC. In this cell, APs were observed at a frequency of 3.1 Hz in normal external (upper trace). GABAzine (middle trace) reduced AP frequency to 1.3 Hz; no significant recovery was observed in wash (lower trace). (B) Summary of the reduction in spontaneous AP frequency following the application of GABAzine (Gz; n = 3). GABAzine significantly decreased AP frequency; however, reversal of this effect was not seen. N = normal; W = wash. (C) Sample traces from a TC showing the burst of APs elicited by short (20 ms) puffs of GABA (bars). In normal external, high Mg2+, and wash, each puff evoked one to two APs. Spontaneous APs, common in normal external, were eliminated by high Mg2+, while GABA-puff-evoked APs were unchanged by high Mg2+/0 Ca2+ but eliminated by GABAzine. (D) Summary of the effect of high Mg2+/0 Ca2+ (Mg) or GABAzine (Gz) on GABA-puff-evoked APs for the cell illustrated in (C) and two others. Neither the number of APs (left) nor the latency (right) of the GABA-puff-evoked burst was significantly altered by high Mg2+. However, GABAzine significantly reduced the number of APs and increased the latency. (E) Spontaneous PSC frequency is reduced, but not eliminated, by GABA and glutamate antagonists. GABA antagonists alone (Gb) suppress approximately half of the spontaneous PSCs recorded in TCs (n = 11), while Glutamate antagonists alone (Gl) only suppress about 25% (n = 9). Combined application of GABA and glutamate antagonists (Gb&Gl) reduced spontaneous PSC by 80% (n = 4), roughly the value expected from additive effects of the individual antagonists.

The clear excitatory effect of GABA described above could be indirect through disinhibition of an excitatory input to the TC, for example, or it could be direct. To resolve this issue, we repeated the extracellular GABA-puff experiment in high Mg2+/0 Ca2+ external solution. As illustrated by the example shown in Fig. 5C, high Mg2+/0 Ca2+ external solution practically eliminated spontaneous APs but did not change the latency or number of APs elicited by the GABA-puff (P = 0.329). GABAzine, on the other hand, completely suppressed the burst (P < 0.01, n = 3 cells). The mean number of evoked APs was 1.9 in normal, 1.5 in high Mg2+, and 0.2 in GABAzine (Fig. 5D). These results show that GABA has a direct excitatory effect on TCs rather than the more typical inhibitory effect. Moreover, the fact that GABA elicits the same number of APs in the presence or absence of high Mg2+ suggests that any indirect effect of GABA, acting via disinhibition, for example, is small relative to its direct effect on TCs. A reasonable interpretation of the reduction in spontaneous AP frequency by GABAzine (Fig. 5A) is that the drug abolishes a continuous stream of GABAergic PSPs in TCs. This view receives support from the following experiments in which we examined the effects of antagonists on PSC frequency.
Spontaneous PSC frequency is reduced by GABA and glutamate antagonists
The GABAA receptor antagonists, Bicuculline (10–100 μM) or GABAzine (20 μM), were used in combination with the GABAC receptor antagonist, TPMPA (10–50 μM), to determine if some of the observed PSCs were caused by GABA. In the 11 cells tested (4 with Bicuculline and TPMPA and 7 with GABAzine and TPMPA), the GABA antagonists significantly reduced spontaneous PSC frequency to 55.1 ± 47.5% of normal (P = 0.005, Fig. 5E), though, as expected, the reduction in PSC frequency was only partially reversed after washing with normal external solution (70.4 ± 52.2% of normal). Clearly, some non-GABA input is also present in TCs. Some fraction of this spontaneous input might be glutamatergic, but this has been difficult to demonstrate since, as we will show in the next section, exogenously applied glutamate, and possibly its antagonists, acts in a way that has a large indirect component.
Applied by themselves, glutamate antagonists produced a small reversible but nonsignificant reduction in PSC frequency. The non-NMDA receptor antagonists, NBQX (10 μM) or DNQX (20 μM), were used in combination with the NMDA receptor antagonist, APV (20 μM), in nine cells (six with NBQX and APV and three with DNQX and APV). The median spontaneous PSC frequency was reduced to 76.9% (68.9–85.0%) of normal by the glutamate antagonists (Fig. 5E) and recovered in wash (100.0%; 82.3–137.6% of normal). When glutamate antagonists were applied together with GABA antagonists, spontaneous PSC frequency was significantly reduced (21.2 ± 15.6% of normal; P = 0.001; n = 4; Fig. 5E), but importantly, we found it was never abolished entirely, implying that another neurotransmitter must be released onto TCs. The fraction of PSCs contributed by glutamate directly is uncertain since glutamate likely modulates the frequency of other PSCs.
Glutamate activates retinal input to the TC
Thus far, our results suggest that TCs receive both a glutamatergic and an excitatory GABAergic input and probably at least one other additional input. Close examination of TC responses to glutamate puffs, recorded both extra- and intracellularly, provides evidence that GABAergic input comes from an intrinsic retinal neuron.
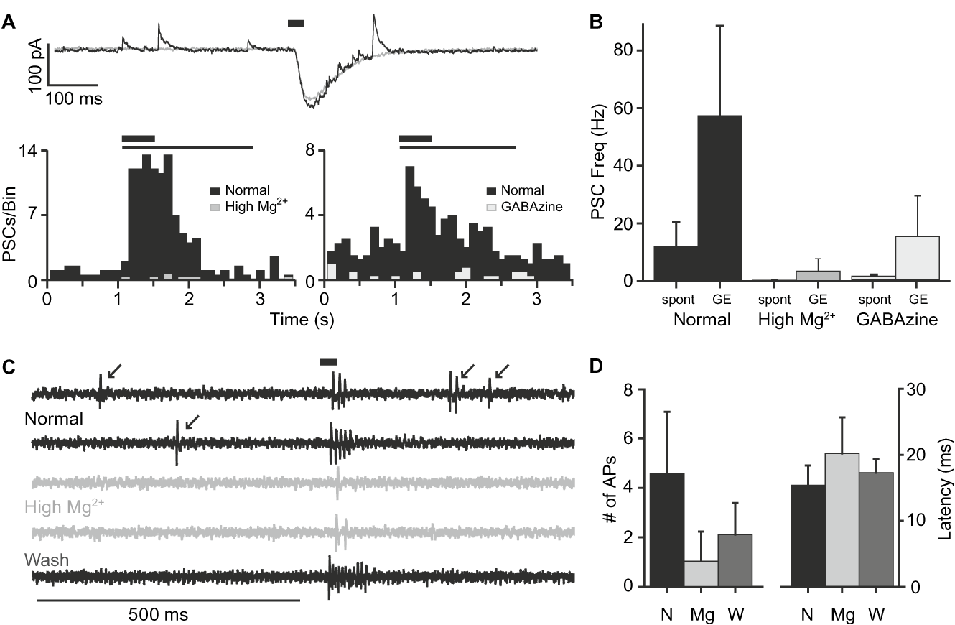
When intracellular recordings from the glutamate-puff experiments were viewed singly at high temporal resolution, rather than averaged and low-pass filtered as they are in Fig. 3A, it was possible to see two distinct responses. In addition to the large inward current, which we have shown is chiefly due to kainate and NMDA receptors at the V H of −20 mV, there are typically brief outward PSCs whose frequency increased following the puff of glutamate (Fig. 6A). In 10 cells recorded in normal external, the glutamate-puff increased outward PSC frequency to 57.2 ± 31.2 Hz, more than 5× the frequency of spontaneous outward PSCs recorded just prior to the puff (11.9 ± 8.45 Hz, P = 0.001; Fig. 6B). These outward PSCs must be generated by an intrinsic retinal neuron, and in support of this, we found that high Mg 2+ abolishes these currents, leaving only the large inward current (Fig. 6A and 6B).
Exogenous glutamate has direct and indirect excitatory effects on the TC. (A) Intracellular recording of the glutamate-puff response revealed that glutamate increased the frequency of the outward PSCs. Given the V H of −20 mV, current through glutamate receptors is expected to be inward, while current through GABA and glycine receptors should be outward. Top, an example of a TCs response to a single glutamate-puff illustrates the relationship between the single large inward current (associated with activation of glutamate receptors on the TC) and the multiple small outward PSCs (associated with GABA or glycinergic input to the TC). The GE-PSCs observed during the decay of the large inward glutamate-puff response (black trace) are likely mediated by synaptic transmission as they are eliminated by high Mg2+/0 Ca2+ (gray trace), whereas the inward current is not eliminated and thus is mediated by glutamate receptors on the TC itself. Bottom, poststimulus time histograms (PSTHs) from two different TCs showing the dramatic increase in outward PSC frequency following a glutamate-puff and the significant reduction of spontaneous (spont)- and GE-PSCs caused by application of high Mg2+/0 Ca2+ (left) or GABAzine (right). Bars above the current traces and PSTHs show the timing of the glutamate-puff (thick bar) and the TCs inward glutamate-puff response (thin bar). (B) Summary of the effects of high Mg2+/0 Ca2+ and GABAzine on spont- and GE-PSCs. Spontaneous frequency was measured during a period preceding each glutamate-puff; GE frequency was measured during the 50–100 ms following each puff. In normal external solution, short puffs of glutamate cause a fivefold increase in the frequency of PSCs (n = 10). High Mg2+/0 Ca2+ external solution was able to virtually eliminate both spont- and GE-PSCs (n = 7). GABAzine was able to suppress most of the spont- and GE-PSCs, but the remaining PSCs suggest that some of these events might be glycinergic (n = 3). (C) Sample traces from a TC showing the burst of APs elicited by short (20 ms) puffs of 100 μM glutamate (thick bar). In normal external (upper black traces), each glutamate-puff–evoked three to five APs; in addition, spontaneous APs were observed (arrows). In high Mg2+/0 Ca2+ external (gray traces), spontaneous APs were eliminated and the number of APs in the glutamate-puff response was decreased to 1–2. In wash (lower black trace), spontaneous APs returned and the number of APs in the glutamate-puff response increased to 10. (D) Summary of the effect of high Mg2+/0 Ca2+ on the glutamate-puff evoked APs. High Mg2+/0 Ca2+ significantly decreased the number of APs but did not alter the latency. This effect was partially reversed in wash (n = 5).

The outward nature of both the spontaneous PSCs and the glutamate-evoked (GE)-PSCs suggests that they are likely GABA/glycinergic because E Cl− in these experiments is negative to the V H. Consistent with this, we found that GABAzine decreased the frequency of GE-PSCs to approximately 40% of normal (36.9 ± 26.4 Hz in normal; 15.2 ± 14.0 Hz in GABAzine; n = 3; Fig. 6B), but in no cells were all PSCs abolished.
Extracellular recordings of the TC response to glutamate-puffs also revealed both direct and indirect effects on AP frequency. Brief (20 ms) glutamate-puffs caused a burst of APs, typically four APs, at a latency of 15 ± 3 ms in normal external solution (n = 7 cells, Fig. 6D). In high Mg2+/0 Ca2+ external solution, the latency to the first AP was not significantly affected (15 ± 3 ms in normal, 20 ± 5 ms in high Mg2+; n = 5 cells; P = 0.189), but the number of APs in the burst was reduced (4.6 ± 2.5 in normal, 1.0 ± 1.2 in high Mg2+; n = 5 cells; P < 0.01; Fig. 6C and 6D). The APs abolished by high Mg2+/0 Ca2+ must be due to the input from intrinsic retinal neurons (i.e., the GE-PSCs discussed in the previous section). In extracellular recordings, where the normal Cl− gradient has not been disturbed, these inputs are excitatory, as we showed in Fig. 5C. Some fraction of this input is contributed by GABA and some is contributed by another transmitter, possibly glycine.
In summary, our physiological recordings show that exogenously applied glutamate stimulates intrinsic retinal neurons to produce excitatory input to TCs. Some, but not all, of this input is GABAergic. While TCs clearly possess glutamate receptors, the evidence for direct glutamatergic input to TCs is weak. We now show that immunohistochemistry supports the idea that GABAergic retinal neurons contribute excitatory input to TCs, and furthermore, we find good evidence that rEFs provide glutamatergic input.
Expression of neurotransmitter receptors
We examined TCs for the presence of receptors for acetylcholine (ACh), GABA, and glutamate using a variety of antibodies (Table 1). While the picture painted by these antibodies is consistent, the relative scarcity of antibodies immunoreactive in chicken necessarily means the picture is incomplete and provides no data on NMDA or kainate receptor expression, for example.
To identify TCs in retinal sections, we double labeled with an antibody against parvalbumin since this has been shown to label TCs strongly (Fischer & Stell, Reference Fischer and Stell1999; Lindstrom et al., Reference Lindstrom, Nacsa, Blankenship, Fitzgerald, Weller, Vaney and Wilson2009). While some other amacrine cell types are also parvalbumin positive, TCs can be readily distinguished based on the location of their somata at the INL–IPL border, larger size, prolate shape, and more intense staining (Lindstrom et al., Reference Lindstrom, Nacsa, Blankenship, Fitzgerald, Weller, Vaney and Wilson2009). The parvalbumin-positive processes found in the IPL (particularly clear in Fig. 8D, a) arise from the other amacrine cell types (Fischer & Stell, Reference Fischer and Stell1999), whereas the dendrites of the TCs are restricted to a small private neuropil at the base of each TC soma lying within the INL (Lindstrom et al., Reference Lindstrom, Nacsa, Blankenship, Fitzgerald, Weller, Vaney and Wilson2009). In those sections in which we wanted to identify the rEF terminals, we employed an antibody to the Fluoro-Ruby (anti-TMR or anti-Rhodamine) injected into the ION and transported to the retina.
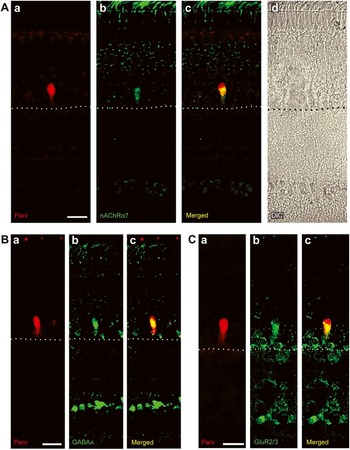
In agreement with Nickla et al. (Reference Nickla, Gottlieb, Marin, Rojas, Britto and Wallman1994), we found that TCs appear weakly immunopositive for the α7 subunit of the nAChR (Fig. 7A). We also found that they are immunonegative for the α3 and α8 subunits of the nAChR (data not shown). The lack of colocalization between α3 and α8 nAChR antibodies was not due to an inability of these antibodies to detect α3 and α8 nAChRs, as we observed positive staining of a number of cells in the amacrine cell layer, consistent with previous reports (Schoepfer et al., Reference Schoepfer, Conroy, Whiting, Gore and Lindstrom1990; Hamassaki-Britto et al., Reference Hamassaki-Britto, Gardino, Hokoc, Keyser, Karten, Lindstrom and Britto1994).
Immunohistochemical characterization of neurotransmitter receptors on TCs. Shown here are TC somata identified by an antibody to parvalbumin (red) together with antibodies to transmitter receptors (green). Images are collapsed confocal stacks showing the entire thickness of the retina with photoreceptors at the top and the ganglion cells or optic fiber layer at the bottom. Dotted lines indicate the INL–IPL border. The intensity and contrast of these images were adjusted to allow clear visualization of antibody labeling on and around the TC somata where all synapses to TCs are known to lie (Lindstrom et al., Reference Lindstrom, Nacsa, Blankenship, Fitzgerald, Weller, Vaney and Wilson2009); TCs make no synapses in the IPL. Scale bars are 20 μm. (A) Soma of a TC (a) stains weakly for the nAChR α7 subunit (b), apparent colocalization can be seen in yellow (c). The faintness of the green channel signal is indicated by the relatively high autofluorescence shown in the outer segments at the top of the images. A DIC image (d) is shown here for orientation but omitted from subsequent figures. (B) GABAA receptors colocalize with TCs. Double-label immunohistochemistry for parvalbumin identifies a TC (a), that is also positive for the α1 subunit of the GABAA receptor (b), merged in (c). (C) Retina double labeled for parvalbumin (red, a) and GluR2/3 (green, b) shows strong colocalization (c).

Evidence that TCs express GABAA receptors was provided by an antibody against the α1 subunit of the GABAA receptor. Fig. 7B shows a typical parvalbumin-positive TC that is also immunoreactive for the α1 subunit of the GABAA receptor. While this result is not unexpected, in view of our physiological findings, it differs from the briefly reported negative result of Fischer and Stell (Reference Fischer and Stell1999) who used an antibody against GABAA β2 and β3 subunits.
We also found that TCs are immunopositive for the AMPA receptor subunit, GluR2 and/or GluR3 (Fig. 7C). The region of colocalization appears to be primarily the dendritic basketwork of the TC, although some expression can be seen in the upper soma. Using the same antibody to GluR1 as Fischer and Stell (Reference Fischer and Stell1999), we found, unlike their report, no evidence of immunoreactivity in TCs or rEFs (data not shown).
Staining patterns for presynaptic markers reveal that rEFs likely release glutamate
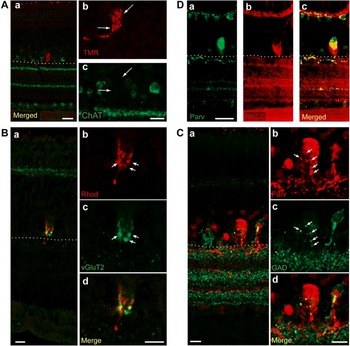
Using an antibody to ChAT, the synthetic enzyme for ACh, we found strong labeling of starburst amacrine cells and their dendrites in strata 2 and 4 of the IPL, as has been widely reported in this retina (Spira et al., Reference Spira, Millar, Ishimoto, Epstein, Johnson, Dahl and Morgan1987; Drenhaus et al., Reference Drenhaus, Morino and Veh2003). TCs and their immediate vicinity were, by contrast, clearly immunonegative (Fig. 8A). This accords well with the lack of TC responses to epibatidine but raises the question of why an apparently inactive α7 subunit would be found on the TC. It is unlikely that the antibody (mAb306) is recognizing an epitope on another protein because a different clone (mAb319), which binds to a neighboring region of the α7-nAChR protein [amino acids (AAs) 365–384 rather than AAs 380–400], exhibits a similar staining pattern (data not shown).
Cellular localization of transmitter-associated molecules. (A) ChAT staining is absent from the region surrounding the rEF terminal. Double labeling for rEF terminals and choline acetyltransferase, the synthetic enzyme for ACh, revealed no colocalization between the two. (a) ChAT staining (green) shows two strongly stained laminae in the IPL and regular arrays of starburst amacrine cells both above and below the IPL. The rEF terminal, labeled with antibodies against TMR (red), used to increase the signal of Fluoro-Ruby in rEF terminals, lies in a region of the INL that lacks ChAT staining. Scale bar is 20 μm. (b and c) Higher magnification images of the region surrounding the rEF shown in the merged image, (a). Scale bar is 10 μm. (B and C) Presynaptic markers for glutamate and GABA have distinct staining patterns. In both (B) and (C), the larger merged image (a) shows the entire thickness of the retina with photoreceptors at the top and the optic fiber layer at the bottom. Dotted lines indicate the INL–IPL border. The three images on the right (b–d) show higher magnification images of the region surrounding the TC so that colocalization between the two antibodies can be more closely examined. All images are compressed confocal stacks. Scale bars are 10 μm. (B) Double labeling with antibodies against rhodamine (red, identifying the rEF terminal) and vGluT2 (a presynaptic marker for glutamatergic synapses, green), shows a matching pattern. In (b, c, and d), individual presynaptic boutons, approximately 2 μm in diameter, can often be seen in both images (arrows). (C) Double labeling with antibodies against parvalbumin (red) and GAD 65/67 (green) reveals that a few small punctate GABAergic terminals contact thin dendritic extensions of the TC (yellow in merged images and arrows in b and c). These GABAergic terminals do not have the same staining pattern as vGluT2 in (B) and do not correspond to the rEF terminals. (D) TCs express high levels of NKCC. A retinal slice double labeled with antibodies against parvalbumin, used to identify the TC (green, a) and NKCC (red, b). In the merged image (c), the soma and dendritic region of the TC is seen to be strongly NKCC positive. Scale bar is 20 μm.

In looking for evidence of presynaptic glutamate, we found an antibody against the vesicular glutamate transporter, vGluT2, to be particularly specific and unambiguous. The distribution of this transporter within the chicken retina has not been previously described, but in the rodent retina, it is found in ganglion cells (Sherry et al., Reference Sherry, Wang, Bates and Frishman2003), including melanopsin-containing cells, and a subset of cones. Within the INL of the chicken, we found the only structure that stains for vGluT2 to be the rEF terminal. vGluT2 immunostaining defines a region closely investing the lower half of the TC soma, as identified by parvalbumin staining (data not shown), corresponding to the rEF terminal as seen in electron microscopic images (Lindstrom et al., Reference Lindstrom, Nacsa, Blankenship, Fitzgerald, Weller, Vaney and Wilson2009). Close inspection of vGluT2 staining shows a lumpy distribution in which it is often possible to see roughly spherical structures of about 2 μm diameter (Fig. 8B, a). These are undoubtedly the presynaptic boutons of the rEF terminal that collectively resemble a bunch of grapes when stained with the NADPH-diaphorase method, and in the electron microscope have been shown to be packed with clear round synaptic vesicles (Lindstrom et al., Reference Lindstrom, Nacsa, Blankenship, Fitzgerald, Weller, Vaney and Wilson2009). When rEF terminals were visualized in Fluoro-Ruby-labeled preparations, it was clear that the vGluT2 immunostaining overlapped with the terminal, and individual boutons were often seen to be coincident in the two color channels (Fig. 8B). These results strongly suggest that glutamate is the neurotransmitter released at the synapse between the rEF and TC.
In contrast to the correspondence of vGluT2 staining with the presynaptic structure of the rEF, an antibody against the GABA synthetic enzymes GAD 65/67 presents a quite different picture. As shown in Fig. 8C, a few very small puncta of strong GAD immunoreactivity colocalize with or are adjacent to the diminutive dendritic processes of the TC (arrows, Fig. 8C). Double labeling for GAD and Fluoro-Ruby revealed that the pattern of these GAD-positive puncta was distinct from that of the large presynaptic boutons of the rEF terminal and generally the GAD-positive puncta were seen in the interstices between rEF terminal boutons (data not shown). We believe that these puncta are not part of the rEF terminal but instead represent the synaptic boutons of a retinal neuron. Two points argue for this interpretation. First, the diameters of the GAD puncta are typically close to, or below, the point spread function of our optics, significantly smaller than the diameter of rEF presynaptic boutons (Lindstrom et al., Reference Lindstrom, Nacsa, Blankenship, Fitzgerald, Weller, Vaney and Wilson2009). In their sparcity and small size, they resemble the putative GABAergic terminals seen in electron microscopy images (Lindstrom et al., Reference Lindstrom, Nacsa, Blankenship, Fitzgerald, Weller, Vaney and Wilson2009). Second, when GAD puncta are compared to Fluoro-Ruby-labeled rEF terminals, there is no close correspondence. Instead, puncta are often seen to correspond to “holes” in the rEF terminal structure (data not shown).
TCs express NKCC
Since our electrophysiological experiments show an excitatory GABAA input to TCs, we looked for the Na-K-Cl cotransporter (NKCC) characteristically associated with such synapses and responsible for an unusually positive Cl− equilibrium potential (Kakazu et al., Reference Kakazu, Akaike, Komiyama and Nabekura1999; Russell, Reference Russell2000; Jang et al., Reference Jang, Jeong and Akaike2001; Marty et al., Reference Marty, Wehrle, Alvarez-Leefmans, Gasnier and Sotelo2002; Marty & Llano, Reference Marty and Llano2005; Reisert et al., Reference Reisert, Lai, Yau and Bradley2005; Zhang et al., Reference Zhang, Delpire and Vardi2007). Using a monoclonal antibody to NKCC (Lytle et al., Reference Lytle, Xu, Biemesderfer and Forbush1995), we have found that TCs express NKCC (Fig. 8D) chiefly in their dendritic processes but, to a lesser extent, also in the upper region of the soma. In these experiments, we used rabbit (rather than mouse) anti-parvalbumin (Fig. 8D, a) to identify the position of TCs.
Discussion
In this study, we have identified rEF terminals in retinal slices by virtue of the fluorescent label transported to them from their somata in the ION. By patching and labeling their postsynaptic partners with Lucifer Yellow, we confirm that these are the atypical amacrine cells referred to as TCs. In only one instance out of more than 500 observations was another cell type seen to be the postsynaptic partner. Interestingly, this was a displaced ganglion cell, which in the pigeon retina has been claimed as a recipient of rEF input (Maturana & Frenk, Reference Maturana and Frenk1965). In a subsequent careful study in pigeon, Hayes and Holden (Reference Hayes and Holden1983) estimated that 2.7% of rEFs may synapse with displaced ganglion cells, and we conclude that in chicken, the percentage is probably even smaller. Our patch-clamp recordings from TCs, the first from this cell type, reveal the likely transmitters to which they respond and carry implications concerning the function of the centrifugal visual system.
Glutamate is the transmitter of the rEF
Several results indicate that glutamate is the likely transmitter of efferent fibers. In the absence of synaptic input, TCs respond to exogenously applied glutamate with inward currents. Consistent with this, we discovered, using antibodies to GluR2/3, that AMPA receptors are found over the basal portion of the TC soma where efferent fiber boutons generally make their synapses (Lindstrom et al., Reference Lindstrom, Nacsa, Blankenship, Fitzgerald, Weller, Vaney and Wilson2009). Particularly significant is our finding that the vesicular glutamate transporter vGluT2, though seemingly as uncommon in the inner retina as it appears to be in other species (Sherry et al., Reference Sherry, Wang, Bates and Frishman2003), is strongly expressed in rEF terminals, where it can be seen in their characteristic large presynaptic boutons. The pharmacology of responses to exogenously applied glutamate shows that, unusually, receptors from all three of the ionotropic families, AMPA, NMDA, and kainate, conduct current, but because of the different rectification shown by these channels, their relative contributions depend on voltage. Since the currents we attribute to AMPARs are inward rectifying, it is probable that these are carried through Ca2+ permeable channels (Hollmann et al., Reference Hollmann, Hartley and Heinemann1991; Verdoorn et al., Reference Verdoorn, Burnashev, Monyer, Seeburg and Sakmann1991). NMDA and potentially kainate receptors (Burnashev et al., Reference Burnashev, Zhou, Neher and Sakmann1995) also conduct Ca2+, which is therefore likely to show a concentration rise in the TC cytosol during synaptic activation. In this context, it is significant that nitric oxide synthase is found in abundance in the somata of TCs as well as in the boutons of efferent terminals. Calcium influx into both these structures is likely to stimulate nitric oxide synthase (Garthwaite & Boulton, Reference Garthwaite and Boulton1995), though it is unclear what nitric oxide does in this system.
Excitatory GABA input comes from an intrinsic retinal neuron
In addition to a glutamate input, we have evidence that GABA is also a transmitter to TCs. Roughly, half of all spontaneous PSCs are abolished by GABAzine, which also completely abolishes the current responses to exogenously applied GABA. The sensitivity of these responses to GABAzine argues that they are mediated entirely by GABAA receptors. GABA is excitatory to TCs, as shown by extracellular recordings in which the natural value of E Cl− is undisturbed. Furthermore, our experiments show that this effect of GABA is a direct one since exogenously applied GABA increases AP frequency, even when synaptic transmission has been blocked with extracellular Mg2+. Though less well known as an excitatory transmitter than as an inhibitory one, there is substantial precedent for this role not just in embryonic central nervous system (Marty et al., Reference Marty, Wehrle, Alvarez-Leefmans, Gasnier and Sotelo2002) but also in the adult nervous system (Marty & Llano, Reference Marty and Llano2005), including the retina (Vardi et al., Reference Vardi, Zhang, Payne and Sterling2000; Dmitriev et al., Reference Dmitriev, Dmitrieva, Keyser and Mangel2007; Li et al., Reference Li, McKernan and Shen2008). Where GABA has been found to be excitatory, this has generally been attributed to an unusually positive E Cl−, achieved through the action of the Cl− transporter, NKCC. We have shown here with immunohistochemistry that this molecule is present on the soma of TCs.
What class of neuron provides GABAergic input to TCs? Quite apart from the arguments presented above that rEFs are glutamatergic, there are several pieces of evidence that indicate these structures are not the source of GABA. A study in pigeon showed GABA to be absent from the output neurons of pigeon ION (Miceli et al., Reference Miceli, Reperant, Rio and Medina1995). Consistent with this, our immunohistochemistry shows the GABA synthesizing enzymes GAD 65 and GAD 67 to be absent from the 2-μm diameter boutons of rEFs and instead restricted to only a few narrow processes present within the private neuropil of the TC. Very likely, these correspond to the relatively scarce processes we have previously described from electron microscopy that contain pleomorphic synaptic vesicles (Lindstrom et al., Reference Lindstrom, Nacsa, Blankenship, Fitzgerald, Weller, Vaney and Wilson2009). These processes probably belong to an amacrine cell since a large fraction of amacrine cells are GABAergic (Mosinger et al., Reference Mosinger, Yazulla and Studholme1986; Wulle & Wagner, Reference Wulle and Wagner1990) and, with the possible exception of interplexiform cells whose presence has not been reported in this retina, are the only cell types present in the inner retina known to use GABA as a transmitter. If this conjecture is correct, being excitatory is a most unusual role for an amacrine cell, but of course, this does not imply that this amacrine cell is anything other than an inhibitory interneuron with respect to its other postsynaptic partners.
Two findings indicate that at least one other transmitter provides input to rEFs. Glutamate antagonists, when applied together with GABA antagonists, fail to suppress all PSCs seen in TCs. Similarly, exogenously applied glutamate puffs elicited PSCs, only some of which were suppressed by GABAzine. We suspect that glycinergic input may also be present but we have no direct evidence for this.
Implications for function
As has been widely assumed, we now confirm that TCs can generate APs, allowing signals to be transmitted from TC somata, located exclusively in the ventral retina (Hayes & Holden, Reference Hayes and Holden1983; Lindstrom et al., Reference Lindstrom, Nacsa, Blankenship, Fitzgerald, Weller, Vaney and Wilson2009), to their axon terminals, often at a considerable distance away in the dorsal retina (Ramón y Cajal, Reference Ramón y Cajal1995; Uchiyama et al., Reference Uchiyama, Aoki, Yonezawa, Arimura and Ohno2004). While this might seem self-evident, it should be remembered that horizontal cells in the mammalian retina comprise dendritic and axonal elaborations connected by a thin axon that effectively keeps these two structures isolated from each other (Nelson et al., Reference Nelson, von Litzow, Kolb and Gouras1975).
It has been argued that TCs are slave neurons driven exclusively by efferent fiber input (Uchiyama & Stell, Reference Uchiyama and Stell2005). Our finding that there are other synaptic inputs from intrinsic retinal neurons, probably amacrine cells, to TCs suggests that TCs are not merely slave neurons but rather they combine their efferent input with local retinal input. It is significant that GABAergic input is excitatory, and we might therefore conclude that this local retinal input to TCs acts synergistically with efferent fiber input to produce spiking. Furthermore, the presence of NMDA receptors might imply that summation of these inputs is nonlinear and perhaps acts, to some extent, as a coincidence detector as argued at other synapses.
Several implications flow from these findings. The first strong implication concerns the receptive fields of some ganglion cells in the dorsal retina. Because, as we have shown here, ventrally located TCs receive excitatory retinal input, this must influence the responses of ganglion cells lying within their, mostly dorsally located, terminal fields. The neurons immediately postsynaptic to TC terminals are probably amacrine cells (Ramón y Cajal, Reference Ramón y Cajal1972; Uchiyama et al., Reference Uchiyama, Aoki, Yonezawa, Arimura and Ohno2004) rather than ganglion cells. Nevertheless, the activity of these amacrine cells will be reflected in ganglion cell spiking, implying that in addition to the classical center–surround organization, these ganglion cells will also possess a field in the ventral retina that influences their responses. Properties like this have not been reported in any of the experimental descriptions of either avian ganglion cells (Holden, Reference Holden1969; Miles, Reference Miles1972b; Pearlman & Hughes, Reference Pearlman and Hughes1976a; Holden, Reference Holden1977; Uchiyama & Barlow, Reference Uchiyama and Barlow1994) or ION cell properties (Holden & Powell, Reference Holden and Powell1972; Miles, Reference Miles1972c), though it is unclear whether these would have been detected using the experimental methods employed. The visual stimuli used in these studies were unlikely to reveal this kind of effect; moreover, it might be the case that the anesthetics employed depressed the proper functioning of the centrifugal visual system.
A second implication is that TCs are genuinely “association” amacrine cells as Cajal must have surmised when he named them (Ramón y Cajal, Reference Ramón y Cajal1995). Specifically, they associate activity in the ventral retina with activity in the dorsal retina. This idea, however, poses a difficult problem since, in contrast to the orderly organization of the rest of the centrifugal visual system (Holden & Powell, Reference Holden and Powell1972), the projection of TC axons, while generally proceeding from the ventral retina to the dorsal retina, is nevertheless apparently chaotic (Catsicas et al., Reference Catsicas, Catsicas and Clarke1987; Uchiyama et al., Reference Uchiyama, Aoki, Yonezawa, Arimura and Ohno2004). What could be achieved by the seemingly haphazard connection of regions of ventral retina with regions of the dorsal retina? It remains possible that a pattern might be revealed by a more systematic mapping of these connections, and this might suggest an answer.
Acknowledgments
This work was supported by NIH awards EY04112 and EY12576.