Introduction
There is growing interest in the study of host–parasite interaction networks, which has stemmed from the importance of considering the community context to understand the ecological and evolutionary implications in host–parasite interactions. Heterogeneity is observed in species interactions among communities that are under different spatial and temporal dynamics (Poisot et al., Reference Poisot, Stouffer and Gravel2015). Besides species abundances and their spatio-temporal co-occurrence (Poisot et al., Reference Poisot, Stouffer and Gravel2015), this heterogeneity is determined by natural history traits, which are usually inherited from a common ancestor (Eklöf et al., Reference Eklöf, Jacob, Kopp, Bosch, Castro-Urgal, Chacoff and Lomáscolo2013; González and INÉS, Reference Gonzalez and INÉS2015).
The relationship between hosts and parasite communities can be influenced by the characteristics of both interacting organisms. Considering host communities, characteristics such as body size, diet, age, habitat and immune system can influence the interaction, richness and abundance of parasites that a host harbours (Krasnov et al., Reference Krasnov, Fortuna, Mouillot, Khokhlova, Shenbrot and Poulin2012; Locke et al., Reference Locke, McLaughlin and Marcogliese2013; Dallas et al., Reference Dallas, Hall and Drake2016), because hosts represent the resources that dictate the feasibility of the association (Araujo et al., Reference Araujo, Braga, Brooks, Agosta, Hoberg, von Hartenthal and Boeger2015; Brooks et al., Reference Brooks, Hoberg and Boeger2019). The interaction between these hosts and parasite communities could also be influenced by the ecological opportunity for interaction that is significantly influenced by the environment (Brooks et al., Reference Brooks, Hoberg and Boeger2019). Identifying the factors underneath the patterns in these communities is challenging because parasite infection dynamics depend on multiple and interdependent factors, such as spatial and temporal fluctuations in the distribution and abundance of species, which determine the probability of encounters with hosts, thereby shaping the structure of host–parasite interactions (Valverde et al., Reference Valverde, Vidiella, Montañez, Fraile, Sacristán and García-Arenal2020).
The hydrological dynamic in wetlands, regulated by seasonal floods (flood pulse), provides an opportunity to test the influence of environmental heterogeneity in species interactions. The seasonal floods have been pointed as a major force determining biotic interactions (Agostinho et al., Reference Agostinho, Thomaz, Minte-Vera, Winemiller, Gopal, Junk and Davis2000), where more homogenous communities are expected during floods than during non-flood periods (Bozelli, Reference Bozelli1992; Thomaz et al., Reference Thomaz, Roberto, Bini, Anna Emília ADeM, Angelo A and Norma1997; Agostinho et al., Reference Agostinho, Thomaz, Minte-Vera, Winemiller, Gopal, Junk and Davis2000; Ramalho et al., Reference Ramalho, Machado and Vieira2018). The increase in water levels represents an expansion event for aquatic and semiaquatic organisms (such as anurans), which provides the ecological opportunity for encounters between some parasites and host species and may also result in new interactions. The structure of communities subjected to cycles/pulses of isolation and expansion may present greater sharing and connectivity of parasites between hosts when compared with environments that do not present such dynamics. Limited ecological opportunity in continuously isolated habitats should exhibit less parasite sharing and lower parasite connectivity among the hosts, changing the structure of the network.
In this article, we investigate the general patterns of organization and structure of interactions in two anuran–parasite networks: one in the Brazilian Pantanal, which is a seasonally flooded environment, and other in the Brazilian Atlantic Forest, which presents no seasonal floods. We propose a theoretical model based on real interactions to test whether the structure of host–parasite networks is influenced by neutral factors and host characteristics (taxonomy and body size) in seasonally flooded and non-flood environments (ecological opportunity).
Materials and methods
We have developed theoretical models based on different filters (neutrality, host taxonomy and host body size, detailed below) and applied them in two environments regarding seasonal floods. Host taxonomy is a potential driver of parasitic diversity since host species vary in their evolutionary time of exposure for parasites acquisition and sharing, therefore, variable co-evolutionary constraints may influence interactions and consequently the structure of their networks (Hadfield et al., Reference Hadfield, Krasnov, Poulin and Nakagawa2014). We also chose the host body size as it is a good predictor of the diversity of parasite species (Kamiya et al., Reference Kamiya, O'Dwyer, Nakagawa and Poulin2014; Campião et al., Reference Campiao, de Aquino Ribas, Morais, da Silva and Tavares2015; Morand, Reference Morand2015). We described all networks using network metrics (nestedness, connectance and modularity). Then we compared the structure of the two networks analysed with the networks generated by theoretical models. See details below.
Three theoretical models were created based on filters to test for neutrality, taxonomy and body size of hosts. Each model is characterized as a specific filter that selects hosts and their parasites from the interaction database that resulted in simulated networks. In contrast to commonly reported analyses of the structure of networks, our random networks considered only real interactions extracted from the interaction database (collected from the literature). Thus, we expect that our random networks better describe the studied environments.
Host–parasite database
We compiled a database (similar to metanetwork González et al., Reference González, Ornelas, Dalsgaard, Márquez-Luna and Lara2018) with reports on the association of interactions between anurans and helminth parasites (endoparasites, belonging to the Acanthocephala, Nematoda and Platyhelminthes, associated with amphibians of the order Anura) from South America (Supplementary material S1). The keywords ‘anura’, ‘amphibians’, ‘helminth’ and ‘parasites’ were used to search for empirical studies on anuran–endoparasite interactions that were conducted in South America from 1 January 1925 to 20 January 2018. These data were collected using online database platforms such as BioOne, Isi JSTOR, PubMed, SciELO, Scopus and Web of Science. We collected a total of 157 articles. We have updated the nomenclature of amphibians according to the American Museum of Natural History (Frost, Reference Frost2020). Leptodactylus latrans was excluded in the analyses due to many changes in the nomenclature of a group of species, which therefore leads to uncertainty in the accuracy of interaction reports. Henceforth, we use ‘host’ to refer to anuran and ‘parasite’ to refer to helminth parasites. We generated a binary matrix with these real interactions in which the rows represent host species and the columns represent parasite species. This matrix was used as an interaction database to generate random networks through the theoretical models (filters).
Selection of environments
From the bibliographical research, we selected two community studies of host–parasite interactions to test our hypothesis. The selection was based on the environment and on the interaction network size (the study should address at least 10 host species). Thus, we assume that the ecological opportunity may be causing the differences between both environments tested. The environments of the selected studies are described below:
(i) The first study was performed in the Brazilian Pantanal (Campião et al., Reference Campião, da Silva, Dalazen, Paiva and Tavares2016), an environment that presents seasonal floods – annual cycles of water expansion and retraction, which could promote environmental homogenization and higher ecological opportunity to create new interactions.
(ii) The second study was performed in the Atlantic Forest (Graça et al., Reference Graça, Oda, Lima, Guerra, Gambale and Takemoto2017), an environment that presents no seasonal floods – no annual cycles of water expansion and retraction, which could promote lower ecological opportunity.
Theoretical models
Our models generate random networks using the real interactions of the database. The following theoretical models were proposed:
(i) Neutral model: This model randomly samples, from the database, the same number of host species in each observed local network [11 hosts in Pantanal and 11 in Atlantic Forest respectively (Supplementary material S2)]. The number of host species is the only filter used in this model.
(ii) Taxonomy model: This model randomly samples, from the database, the same number of host species belonging to the same families in the same proportion of the original network, as reported in each observed network (Supplementary material S2 and S3 – families of the species by network observed).
(iii) Body size model: This model randomly samples, from the database, the same number of host species with the same body size distribution (considering a standard deviation of ± 5%) as reported for host species in each observed network (Supplementary material S2 and S3 – body size of the species by network).
Each random network consists of the sampled hosts and all parasites that interact with them. The interactions of this random network preserve the same interactions recorded in the database. For each environment analysed, the random networks generated by the models maintain the number of host species of each observed network (Pantanal and Atlantic Forest). Therefore, the number of hosts remains constant (according to each environment), while the number of parasites varies among random networks.
We simulated 1.000 networks for each model in each environment (random networks per model in Supplementary material S4). Each random network was always included in the interaction database after each randomization, so that a species could be included in more than one random network. We compared the filters to understand how each one explains the observed network (the comparison methods are detailed below). From here onwards, we refer to any of the two networks in the tested environments as an ‘observed network’, and to any network generated by the filters as a ‘random network’. We identify which model best explains each observed network, as well as which network is best described by the models.
Data analysis
Network metrics
We used the metrics nestedness, connectance and modularity to characterize the structure of the interaction networks. Nestedness was calculated based on Almeida-Neto et al. (Reference Almeida-Neto, Guimaraes, Guimaraes, Loyola and Ulrich2008) to evaluate the presence of overlapping. A high nestedness value indicates a hierarchy of interactions: species that interact with fewer partners interact with a subset of partners from species that have more (Bascompte et al., Reference Bascompte, Jordano, Melián and Olesen2003). Connectance is the proportion of interactions performed among all possible interactions between species in a community (May, Reference May2019). Modularity was calculated based on Dormann and Strauss (Reference Dormann and Strauss2014) to describe the presence of network grouping (commonly called network modules), in which species interact more with species of their own group than with species of other groups (Olesen et al., Reference Olesen, Bascompte, Dupont and Jordano2007). We used the R-package bipartite (Core Team, 2020) to calculate these network metrics (Dormann et al., Reference Dormann, Gruber and Fründ2008).
Standardization for network metrics and comparison of the network structure
Although the host species richness was constant in the different samples, the size of the whole network differed in each sample due to variation in parasite richness. Therefore, we standardized the network metrics using a simple linear regression between the metrics and the number of parasites, as follows:

where Y’ is the value of the standardized metric (equivalent to the regression residue), Y is the value of the non-standardized metric, par is the number of parasites, and α is the linear coefficient and β is the slope coefficient of the regression.
In order to compare the networks, first, we calculated the coefficients of distance (D) for each metric, from each random network of each theoretical model to the observed network in units of standard deviation:

where Y’obs is the standardized value of the network observed, Y’rand is the normalized value of each random network metric, and σ rand is the standard deviation of 1.000 values of Y’rand. This calculation is similar to Z-score (Vanbergen et al., Reference Vanbergen, Woodcock, Heard and Chapman2017), but instead of using each random network, Z-score uses the average metric for all random networks. As a consequence, Z-score results in a single D value, while our method generates 1.000 D value for each analysis.
Subsequently, for a given metric and observed network, a one-way analysis of variance (ANOVA) was applied to compare the coefficient of distance (D) between the models and the Tukey test (Zar, Reference Zar1999) was used to compare the averages and define the smallest significant difference between the models. After measuring the difference, the averages of the distances between the observed networks and each random network of each model were compared to verify which theoretical model best describes the observed networks (model with the lowest average). Subsequently, again for a given metric and observed network, a one-way ANOVA was applied to compare the distances D between the environments tested and then the Tukey test (Zar, Reference Zar1999) was used to compare the averages and define the smallest significant difference between environments. The averages of the distances between the observed networks and each random network of each model, these were compared to verify which environments had the best described network. All statistical analyses were performed using the R stats package (Core Team, 2020). We assumed a significance of P < 0.05 for all tests.
Results
Structure of host–parasite interaction networks
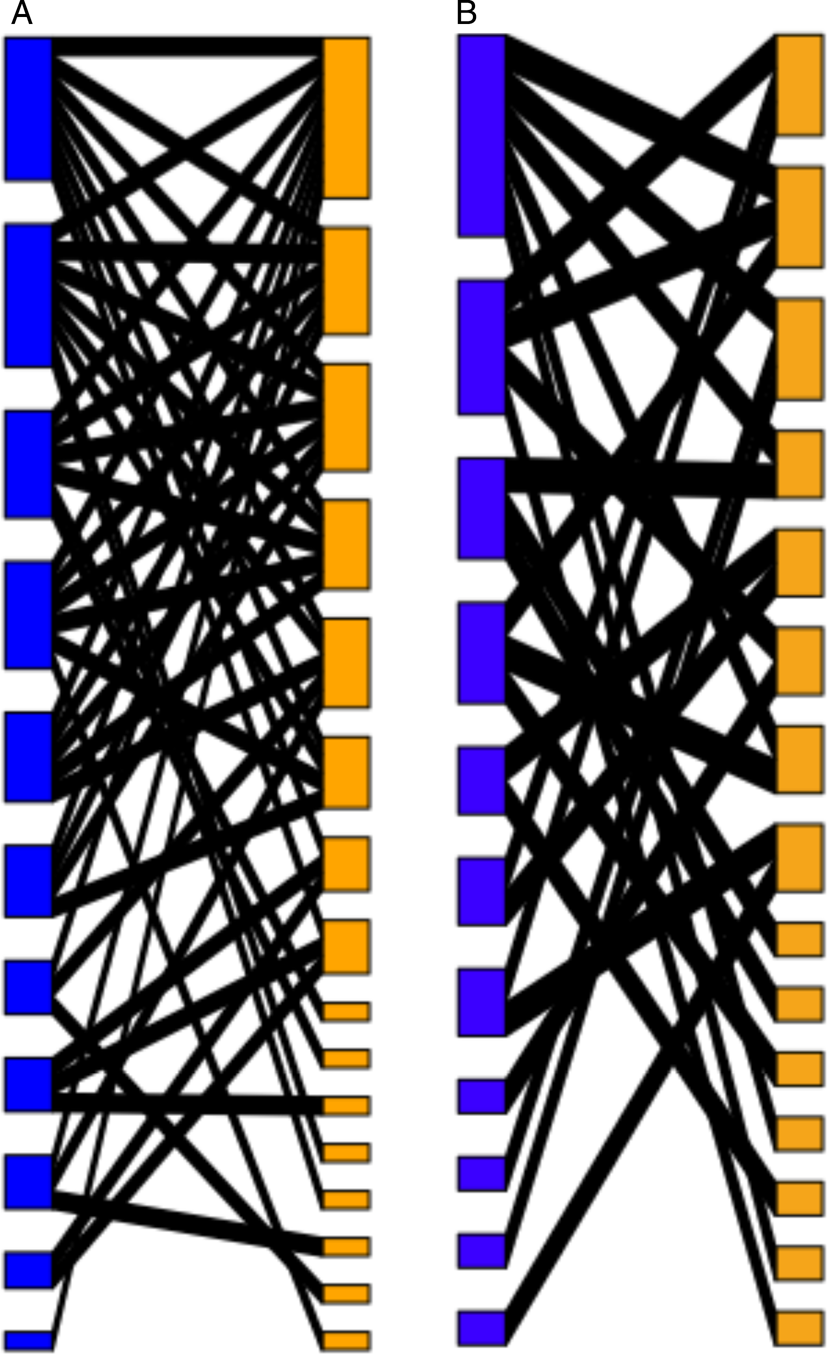
We recorded 686 real interactions between 215 species of parasites and 170 species of hosts in South America. The Pantanal network was composed of 11 hosts and 16 parasites (47 interactions – Fig. 1a, Supplementary material S5), while the Atlantic Forest network was composed of 11 host and 15 parasites (25 interactions – Fig. 1b, Supplementary material S5).
Host–parasite interaction networks observed (occurrence) for (a) Pantanal, (b) Atlantic forest. Blue: host, orange: parasite and black lines represent interactions.

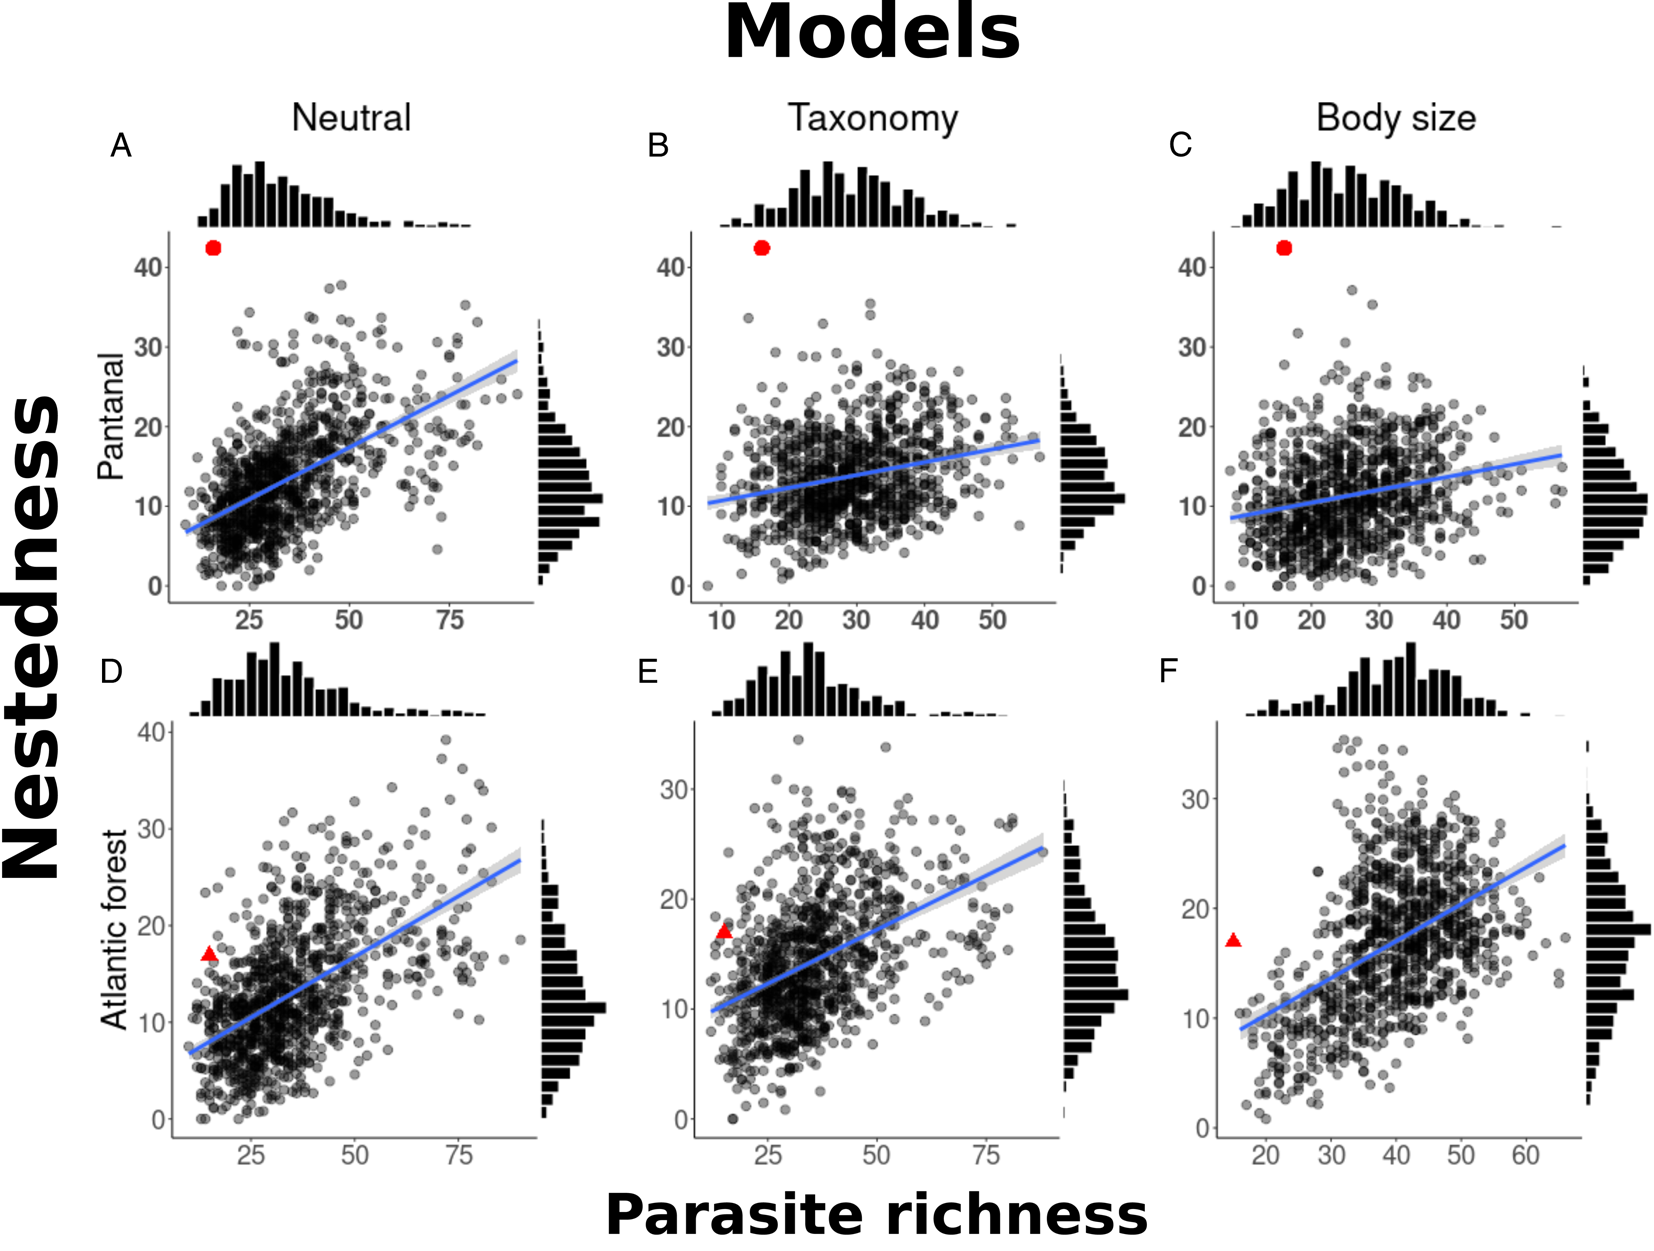
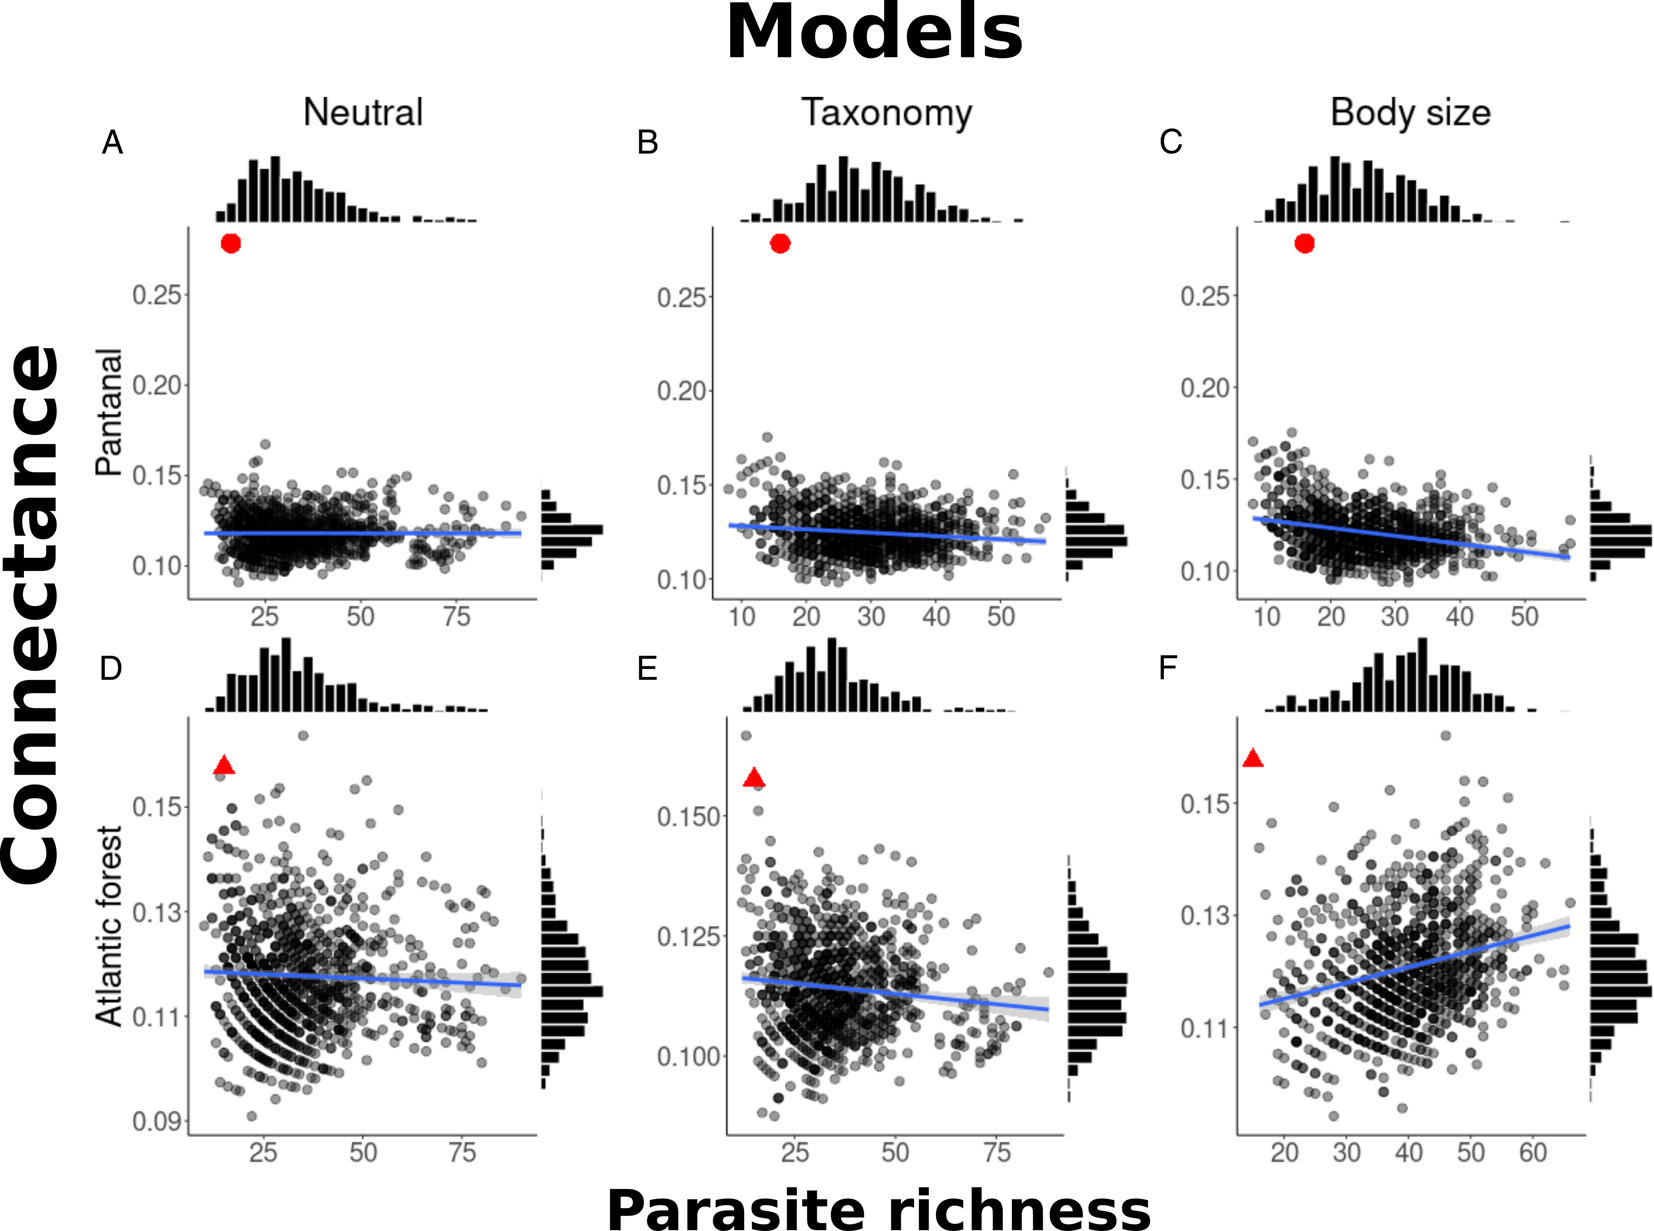
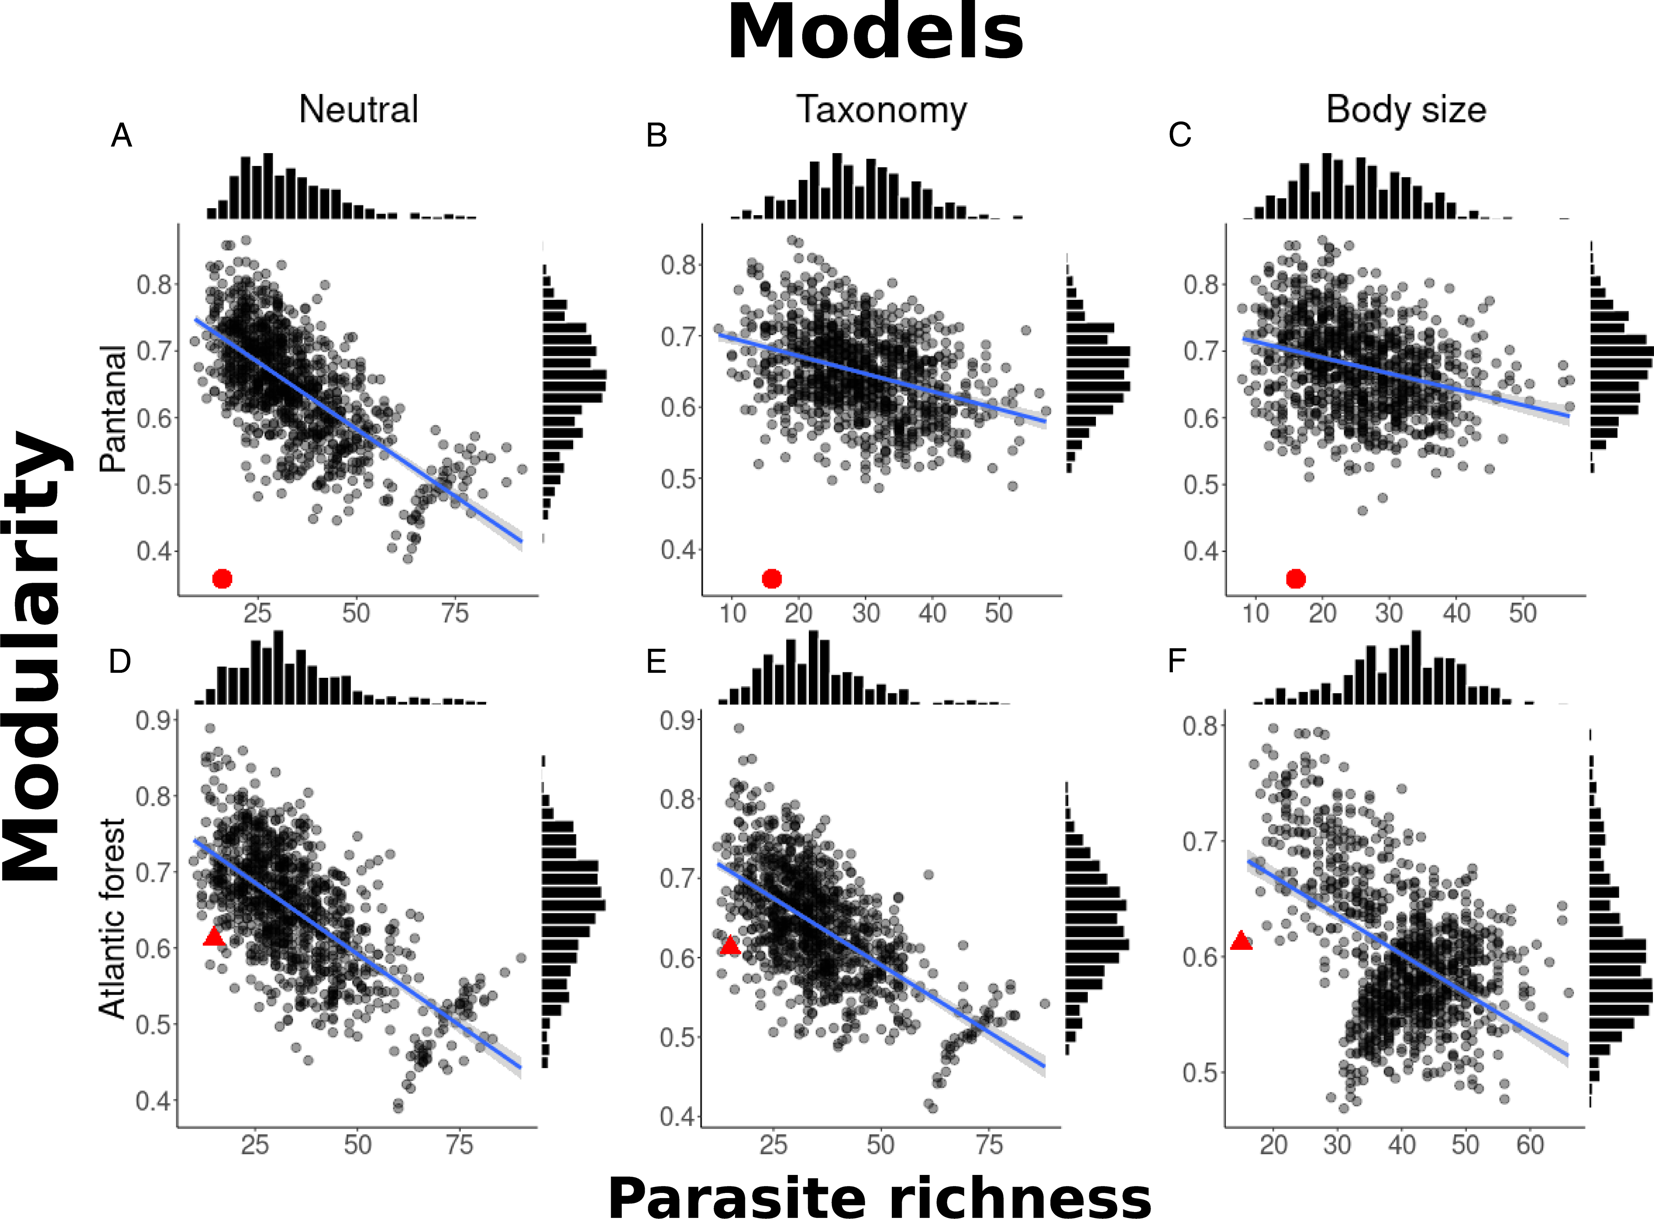
Random networks presented a range from smaller to greater numbers of parasite species than the observed networks (Figs 2–4 – black bars, upper x-axis – frequency of the number of parasites). Nestedness increased with the number of parasites for both environments (Fig. 2). Connectance and modularity were negatively correlated with the number of parasites in most simulated models (Figs 3 and 4).
Nestedness values according to the number of parasite species before standardization. The black dots indicate the nestedness value of random networks for three theoretical models. Networks observed: seasonally flooded environment: red dot – Pantanal (a – R2: 0.30, α: 4.39, β: 0.25; b – R2: 0.06, α: 9.08, β: 0.16; c – R2: 0.05, α: 7.21, β: 0.16) and non-flooded environment: red triangle – Atlantic forest (d – R2: 0.3, α: 4.23, β: 0.25; e – R2: 0.19, α: 7.39, β: 0.19; f – R2: 0.21, α: 3.55, β:0.33). The blue lines represent linear regression and the grey shadow represents standard deviation in random networks. The black bars indicate the frequency distribution of the random networks: right y-axis – nestedness frequency, upper x-axis – frequency of the number of parasites (details: Supplementary material S4).

Connectance values according to the number of parasite species before standardization. The black dots indicate the connectance value of random networks for three theoretical models. Networks observed: seasonally flooded environment: red dot – Pantanal (a – R2: 1.972e-07, α: 1.181e-01, β: −3.227e-07; b – R2: 0.01, α: 1.298e-01, β: −1.752e-04; c – R2: 0.08, α: 1.321e-01, β: −4.356e-04) and non-flooded environment: red triangle – Atlantic forest (d – R2: 0.002, α: 1.189e-01, β: −3.299e-05; e – R2: 0.01, α: 1.173e-01, β: −8.653e-05; f – R2: 0.06, α: 1.095e-01, β: 2.826e-04). The blue lines represent linear regression and the grey shadow represents standard deviation over the random networks. The black bars indicate the frequency distribution of the random networks: right y-axis – connectance frequency, upper x-axis – frequency of the number of parasites (details: Supplementary material S4).

Modularity values according to the number of parasite species before standardization. The black dots indicate the modularity value of random networks for three theoretical models. Networks observed: seasonally flooded environment: red dot – Pantanal (a – R2: 0.47, α: 0.78, β: −0.004; b – R2: 0.12, α: 0.72, β: −0.002; c – R2: 0.09, α: 0.73, β: −0.002) and non-flooded environment: red triangle – Atlantic forest (d – R2: 0.45, α: 0.77, β: −0.003; e – R2: 0.38, α: 0.75, β: −0.003; f – R2: 0.22, α: 0.73, β: −0.0033). The blue lines represent linear regression and the grey shadow represents standard deviation over the random networks. The black bars indicate the frequency distribution of the random networks: right y-axis – modularity frequency, upper x-axis – frequency of the number of parasites (details: Supplementary material S4).

Theoretical models: host body size and taxonomy usually describe the observed networks better than neutral models
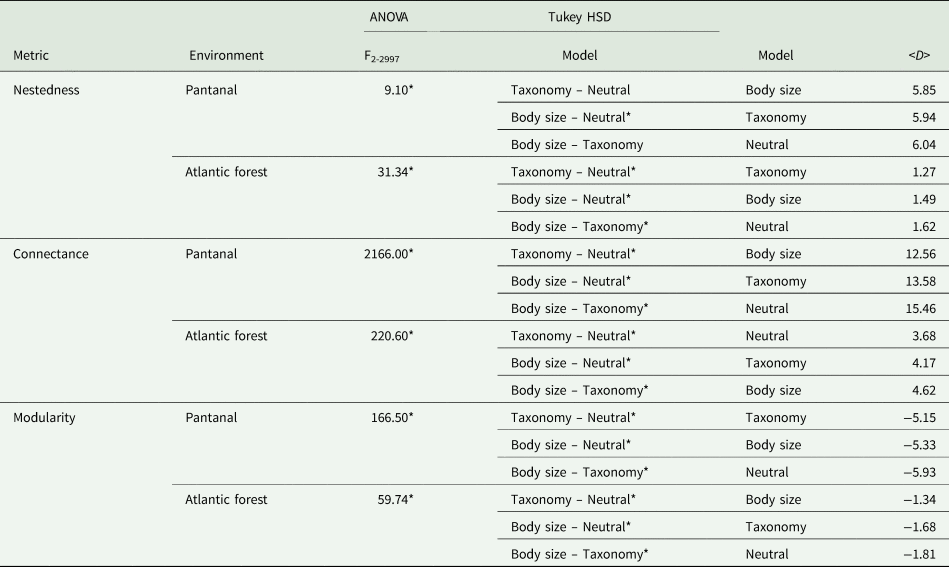
Metric values predicted by the theoretical models were generally distant from the observed values. The coefficient of distance (D) between random networks and their respective observed network were significantly different among the models (Table 1). The body size model was the one that best described nestedness and connectance pattern observed in the Pantanal, while modularity was better described by the host taxonomy model. For the Atlantic Forest network, the taxonomy model was the one that best resembled the observed nestedness, the connectance values were better resembled by the neutral model, and the modularity was better resembled by the body size model (Table 1). In general, the results show that, although no model fits perfectly the observed networks, the body size and taxonomy models resemble the network structure more than the neutral model, indicating the influence of such host traits to network structure.
Analysis of variance (statistical significance test F 2-2997), Tukey Test between neutral, taxonomy and body size theoretical models, for each metric and environment (network observed).

The right column of ‘Theoretical Model’ is ordered according to the model that better describes the observed network for a given metric, followed by the average coefficients of distance (<D>) between the observed network and the random networks. *Significant difference between models <0.05.
The models better describe the environment with no seasonal floods than one with seasonal floods
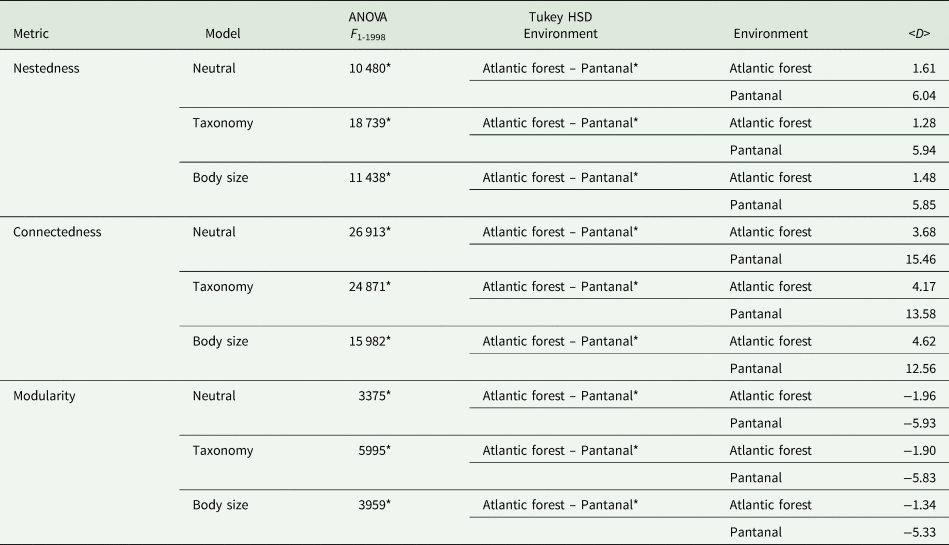
All metrics indicate that the network structure of the Pantanal is the furthest from the network structure of the theoretical models (Table 2). That is, the non-flooded forest network is better described by the proposed models than the seasonally-flooded forest network. All theoretical models indicate that the Pantanal network is more nested and connected, and less modular than the Atlantic Forest network (statistics for the test of each metric between random networks of the models and observed network – average coefficient of distance value, <D>, in Table 2).
Analysis of variance (statistical significance test F 1-1998), Tukey Test between neutral, taxonomy and body size theoretical models, for each metric and environment and coefficients of distance.
The fourth column is ordered according to the environment with the most coefficients of distance between the observed network and random networks, followed by the average coefficients of distance (<D>) between the observed network and the random networks. *Significant difference between environments <0.05.
Discussion
We developed a conceptual and methodological framework to evaluate the influence of neutrality, taxonomy or host body size to assess network metrics. We used this framework to evaluate the influence of ecological opportunity in the network structure of anuran–endoparasite in two environments: the Pantanal and the Atlantic Forest. These networks were better described by host body size and host taxonomy rather than neutral filter. In addition, the theoretical models better described the network of the environment with no seasonal floods. In agreement to other recent studies (Rezende et al., Reference Rezende, Jordano and Bascompte2007, Reference Rezende, Albert, Fortuna and Bascompte2009; Vazquez et al., Reference Vázquez, Chacoff and Cagnolo2009; Naisbit et al., Reference Naisbit, Rohr, Rossberg, Kehrli and Bersier2012; Campião et al., Reference Campiao, de Aquino Ribas, Morais, da Silva and Tavares2015), our results show that the difference in contact opportunities between species can alter the structure of the networks.
We also assume that the Pantanal may have historically provided a higher opportunity for interaction, increasing parasite sharing among different host species. This may occur because the seasonal floods may act directly in the anuran habitats, promoting successive connections among micro-habitats, which would then facilitate interactions through ecological fitting (Janzen, Reference Janzen1985). The occurrence of the seasonal floods may promote greater contact between aquatic and semiaquatic species, thus increasing ecological opportunity to establish new host–parasite associations (Agosta, Reference Agosta2006; Agosta et al., Reference Agosta, Janz and Brooks2010). The encounters can lead to new associations because of the ability of the organisms to quickly adapt to new resources due to their phenotypic flexibility, without genetic novelties (Janzen, Reference Janzen1985; Agosta and Klemens, Reference Agosta and Klemens2008; Araujo et al., Reference Araujo, Braga, Brooks, Agosta, Hoberg, von Hartenthal and Boeger2015). On the other hand, we assumed the Atlantic Forest to be more heterogeneous due to the absence of floods, limiting interaction opportunities.
The network metrics of the Atlantic Forest networks were more similar to the theoretical models than the Pantanal networks. This means that the ecological opportunity provided by the Pantanal floods could implicate in a less predictable pattern of interaction among species. In general, network structure is predicted to be the outcome of both evolutionary and ecological factors (Brooks et al., Reference Brooks, León-Règagnon, McLennan and Zelmer2006). One process that could explain such interaction is ecological fitting: a frequent process that explains interactions between plastic organisms and heterogeneous biotic and abiotic environments (Janzen, Reference Janzen1985). Mutation is not necessary for this process to occur, which varies a lot according to the ecological opportunity and to the name of the process. Therefore, the Pantanal is in line with this premise because it allows this ecological opportunity for parasite species.
Some studies suggest that randomness is an underlying mechanism to explain the structure of parasitic communities (Poulin, Reference Poulin2004; Krishna et al., Reference Krishna, Guimaraes, Jordano and Bascompte2008). However, most of the metrics we tested did not indicate the neutral model as the main descriptive of network topology, with exception only of the connectance of the network in the Atlantic Forest. This result may be affected by random neutral encounters between individuals that are probability mediated by the relative abundances of the populations involved and by interaction compatibility between hosts and parasites. Nonetheless, the theoretical models based on host characteristics, such as body size and taxonomy, resulted in simulated networks that were more similar in nestedness and modularity values to the observed (real) networks, suggesting that these elements are also playing a role in the anuran–endoparasite network of the Atlantic Forest.
In parasitic communities, the evolutionary history of the host acts as one of the determinants of the community structure (Scordato and Kardish, Reference Scordato and Kardish2014; Clark et al., Reference Clark, Clegg, Sam, Goulding, Koane and Wells2018). Phylogenetic relationships can function as a good proxy to describe ecological differences between hosts, if these attributes are phylogenetically conserved modulating interspecific barriers for parasite colonization among hosts, and outlining current interactions (Rezende et al., Reference Rezende, Albert, Fortuna and Bascompte2009; Dormann et al., Reference Dormann, von Riedmatten and Scherer-Lorenzen2017). This may explain why the theoretical model with the taxonomy filter, which is a proxy for phylogeny, resembled the modularity observed in the Pantanal network, which has been also found in other studies (Rezende et al., Reference Rezende, Albert, Fortuna and Bascompte2009; Huang et al., Reference Huang, Bininda-Emonds, Stephens, Gittleman and Altizer2014; Dormann et al., Reference Dormann, von Riedmatten and Scherer-Lorenzen2017; Clark et al., Reference Clark, Clegg, Sam, Goulding, Koane and Wells2018). Similarly, the theoretical model with samplings based on host body size was the better proxy to describe the nestedness and connectance in the Pantanal, as well as the modularity in the Atlantic Forest network.
Species may expand habitat use in response to the availability of new resources (MacArthur et al., Reference MacArthur, Diamond and Karr1972; Wright, Reference Wright1980), which would be associated with the encounter of different hosts. Some examples of habitat expansion arise directly from the events associated with the ecological opportunity (Malcicka et al., Reference Malcicka, Agosta and Harvey2015). Cyclical expansion of host–parasitic communities in the ecosystems subjected to seasonal floods favours seasonal contact of infectious forms of parasites with hosts. The colonization of new host species should in fact generate more connected, more nested and less modular networks (since modules are broken due to the new connections promoted by the environment – Fig. 4a–c).
In a non-flooded environment, such as the Atlantic Forest, the host–parasite interaction may be restricted by the low dispersion of species among aquatic environments, because forest environments may represent ecological barriers for many semi-aquatic and aquatic species. As contact is the main route of parasite transmission (expected for endoparasites with heteroxenous and monoxenic cycle), the structure of the Atlantic Forest network is more similar to the structure of random networks, since hosts share fewer parasite species. Our results may suggest that ecological opportunity plays an important role in determining the structure of interaction networks and the evolutionary dynamics of host–parasite associations. These results create new perspectives for studies on parasitic community assemblages, particularly as few studies relate the connectivity of host communities to the opportunity for parasitic dispersion. This may, in fact, increase our understanding of the influence of the dynamics of the physical environment on the structure of host–parasites interactions.
A network analysis covering a neotropical-level region is not a simple task, and it just was possible because of hundreds of scientists who have collected data on amphibian–endoparasite interactions in South America. The effort of these scientists allowed us to test the influence of taxonomy, host body size and ecological opportunity in seasonally flooded and non-flooded environments. We assumed some premises due to differences in data collection approaches, such as considering the interactions qualitatively (presence and absence), since they are more suitable for studying interactions at the community level. Our results may have been influenced by the fact that the host–parasites interaction database was built from several studies, with different sampling efforts in different regions. Such uneven study effort could have increased some interaction records, and, consequently, increased the connectance and reduced the modularity of theoretical models. On the other hand, the interaction database had a larger spatial scale than the local studies in the analysed environments, so that the random networks could have selected hosts that did not co-occur, thus, did not share the same species of parasites. This process results in more modular, but less connected random networks. Even though the variation in network size between the simulations is high, there is a risk that methodological artefacts (low sample effort) affected our results. However, even with these factors, all the networks observed had the same tendency: they were all more connected and less modular than predicted by the models, thus validating our results.
From an epidemiological perspective, an increase in parasite sharing among different host species or changes in the composition of parasitic species or in the frequency of host–parasite interactions are associated with the risks of parasitic invasions and emerging diseases (Brooks and Hoberg, Reference Brooks and Hoberg2007; Hoberg and Brooks, Reference Hoberg and Brooks2008; Jones et al., Reference Jones, Patel, Levy, Storeygard, Balk, Gittleman and Daszak2008; Lafferty, Reference Lafferty2009; Agosta et al., Reference Agosta, Janz and Brooks2010; Morse et al., Reference Morse, Mazet, Woolhouse, Parrish, Carroll, Karesh and Daszak2012; Brooks et al., Reference Brooks, Hoberg, Boeger, Gardner, Galbreath, Herczeg and Dursahinhan2014; Adlard et al., Reference Adlard, Miller and Smit2015). Some examples come from studies with the introduction of species (Hoberg and Zarlenga, Reference Hoberg, Zarlenga, Hoberg and Zarlengathe2016; Nylin et al., Reference Nylin, Agosta, Bensch, Boeger, Braga, Brooks and Schäpers2018). In birds, for instance, the occurrence of nematode parasites increases with the ecological opportunity due to migratory habits and the use of aquatic habitat (Leung and Koprivnikar, Reference Leung and Koprivnikar2016; Nylin et al., Reference Nylin, Agosta, Bensch, Boeger, Braga, Brooks and Schäpers2018). This increase changes the community structure and the formation of new species associations through a combination of mechanisms, such as ecological adaptation and opportunity for interaction between species (Stigall, Reference Stigall2014; Stigall et al., Reference Stigall, Bauer, Lam and Wright2017). In part, the emerging diseases are a result of processes such as those that occur during seasonal floods, in which climate change, travel and global trade generate opportunities for new species associations (Nylin et al., Reference Nylin, Agosta, Bensch, Boeger, Braga, Brooks and Schäpers2018).
Therefore, using our conceptual and methodological framework, we have shown that the properties of interaction networks at the community level were best described by body size proxies followed by the host's taxonomy. In addition, our results suggest that the ecological opportunity for interaction in these communities is gradient. Our findings integrate ecological approaches and the proposed theoretical model can be used to understand the structure of other complex systems, such as mutual networks and social networks. Future studies could use such a methodological framework to evaluate the generality of our findings in other systems with contrasting ecological conditions.
Supplementary material
The supplementary material for this article can be found at https://doi.org/10.1017/S003118202000133X
Acknowledgements
We would like to thank our colleagues who helped us in different ways during this project, especially Flavia M.D. Marquitti and Rafael A. Baggio for their comments and suggestions in the manuscript. We would also like to thank the Academic Publishing Advisory Center (Centro de Assessoria de Publicação Acadêmica, CAPA – www.capa.ufpr.br) of the Federal University of Paraná for assistance with English language editing. EDB was supported by a Master's degree scholarship from the Brazilian Coordination for the Improvement of Higher Education Personnel (CAPES).
Author contribution
KMC, WAB, SBLA and EDB originally formulated the idea. SBLA and EDB developed the models, conducted the research and generated data analyses. EDB, SBLA, KMC and WAB interpreted the results and wrote the manuscript.
Financial support
Brazilian Coordination for the Improvement of Higher Education Personnel (CAPES).
Conflict of interest
The authors declare that they have no conflict of interests.
Ethical standards
Not applicable.