


In addition to affecting the problems that they are designed to address, public policies can also have important political impacts. The creation of Social Security, for example, not only addressed the problem of senior poverty, but it also created a powerful constituency that has arguably constrained social policy ever since (Campbell Reference Campbell2003). Understanding the political effects of public policies is important not only because they may create constituencies invested in the scope and durability of a particular program, but also because they may alter the electoral landscape and affect policymaking more broadly.
The claim that new policies create a new politics is as old as Schattschneider’s (Reference Schattschneider1935) study of the tariff in the United States, but it has been taken seriously as an empirical prediction only recently (Pierson Reference Pierson1993; Campbell Reference Campbell2003; Mettler and Soss Reference Mettler and Soss2004). In addition to Campbell’s (Reference Campbell2003) pioneering work on Social Security and senior political activism, scholars have also examined this hypothesis in the cases of pension reform (Pierson Reference Pierson1992), welfare (Soss Reference Soss1999), the G.I. Bill (Mettler Reference Mettler2002, Reference Mettler2005), and the carceral state (Weaver and Lerman Reference Weaver and Lerman2010) to name but a few. Despite these important investigations, however, several questions remain about the impact and nature of policy feedback effects.
First, existing work focuses on policies enacted with strong bipartisan support. The GI Bill was nearly unanimously supported in Congress, Social Security and social insurance programs have been largely apolitical since 1936 (Derthick Reference Derthick1979), and even reforms to the public assistance program Aid to Families with Dependent Children are often passed with bipartisan coalitions. Given the importance of partisan cues for elite and mass behavior, it is an open question whether similar effects obtain for a policy passed over the objections of an entire political party, and whose continued existence has been an issue for several election cycles. Do the partisan political conditions surrounding a policy affect its ability to produce political impacts? Is blowback from opposed citizens as likely to occur as feedback from beneficiaries?
Second, persuasively identifying the political effects of a public policy is difficult (Campbell Reference Campbell2012). Do policies affect the political behavior of beneficiaries, or would beneficiaries behave differently even in the absence of the policy? Does the receipt of a means-tested program depress participation, for example, or are those eligible for assistance different in other ways, such as aspiration levels (Bendor Reference Bendor2010) or feelings of deservingness (Schneider and Ingram Reference Schneider and Ingram1993)? Given the difficulty of accounting for unobservable differences, better understanding the connection between policy and behavior requires leveraging circumstances that are well-suited to isolating causal effects.
We tackle both of these concerns using the highly salient and important case of the Patient Protection and Affordable Care Act (ACA) of 2010. While the connections between the expansion of Medicaid and the ACA may be hard to perceive given the decentralized delivery of Medicaid by the states, the conditions required to produce mass political effects by a social policy appear to be well-satisfied given the scope, salience, and publicity surrounding the ACA in general, and the expansion of Medicaid provided by the ACA in the states in particular. Unlike the ephemeral benefits of some social policies (e.g., tax credits that become most salient at tax time), the policy consequences of the ACA and the expansion of eligibility for health insurance were prominent, publicized, and the subject of an enduring political debate through the 2016 election.
The politics surrounding the ACA’s creation and maintenance also differ markedly from policies previously studied in the feedback literature. The law was enacted along strict party lines—not a single Republican in either the House or the Senate voted in its favor – and the intensity of the partisan conflict has persisted through several election cycles. It is unclear whether the political impacts of the ACA are affected by this level of partisan conflict, and whether the heightened partisanship dampers or exacerbates the political effects relative to those found for policies enacted with bipartisan support.
The ACA is also particularly well-suited to empirical investigation, because the manner in which it was implemented helps us avoid many confounding factors. The ACA’s Medicaid expansion varies between states as a result of the Supreme Court’s decision in National Federation of Independent Business v. Sebelius. The resulting between-state variation provides us with the ability to compare otherwise similar geographic areas with vastly different experiences with the law. For example, whereas a lower-income individual living in Tennessee near the Tennessee-Kentucky border continues to be ineligible for Medicaid, an otherwise similar individual living across the border in Kentucky is newly eligible.
Our identification strategy is important because much of the elite-level discourse surrounding the ACA presumes positive participatory effects for recipients (e.g., Novack Reference Novack2013), while existing research on means-tested programs tends to find null (Sharp Reference Sharp2012) or even negative (Soss Reference Soss1999, Reference Soss2002) effects. Even work focusing on Medicaid offers conflicting findings—Michener (Reference Michener2015) argues for a negative impact of Medicaid on political participation prior to the ACA, but Haselswerdt (Reference Haselswerdt2017) suggests that the expansion of Medicaid under the ACA increased participation in House races in 2014 relative to 2012. While selection bias may explain the contradictory findings of prior research, comparing the change in behavior of otherwise similar counties experiencing different policy environments allows us to sidestep many confounding factors.
Beyond the more general question of how contested social welfare policies affect political behavior, examining the impact of the ACA is also important for what it reveals about the nature of contemporary politics in the United States. Not only is the ACA one of the most significant social welfare policies enacted in decades—if not since the 1935 Social Security Act (Balz Reference Balz2010)—but its continued existence depends critically on its ability to generate and maintain a supportive constituency in the face of continuing attempts at repeal (Patashnik Reference Patashnik2014). Understanding participatory impacts is also important because of the well-known finding that political participation in the United States varies by socioeconomic class (e.g., Wolfinger and Rosenstone Reference Wolfinger and Rosenstone1980; Highton and Wolfinger Reference Highton and Wolfinger2001; Schlozman, Verba, and Brady Reference Schlozman, Verba and Brady2012; Leighley and Nagler Reference Leighley and Nagler2014), and the related finding that, perhaps as a consequence, there is an upper-class bias in the the policies that are enacted (Bartels Reference Bartels2008; Hacker and Pierson Reference Hacker and Pierson2010; Gilens Reference Gilens2012). Exploring whether the ACA increases beneficiaries’ participation is therefore important for understanding how policy outcomes affect the connection between economic and political inequality.
We show the expansion of Medicaid caused substantial decreases in the share without insurance in counties located in expansion states, relative to otherwise similar counties located in nonexpansion states; we also show the impact is concentrated in counties with an above-average share of the population making less than 138% of the federal poverty level, just as the expansions intended. The percentage uninsured declines by between three and four points in counties with a low share of potential eligibles, and by about ten points in counties with a large share of potential eligibles. Moreover, the increase in insurance coverage covaries with an increase in political participation, but with some important caveats. In both 2014 and 2016, voter registration increases by between three and four points in high-eligibility counties, but there is no detectable effect in low-eligibility counties. Yet we only observe a temporary impact on voter turnout: while 2014 turnout in high-eligibility counties is as much as three points greater in expansion states than nonexpansion states, the effect evaporates by 2016. This pattern of results suggests that, while the expansion of Medicaid increased voter registration—perhaps as a consequence of the mechanical connection between applying for Medicaid and voter registration created by the National Voter Registration Act of 1993—the ability of the policy to bring beneficiaries to the voting booth is, at least in the short-term, more limited.
THE POLITICS OF MEDICAID EXPANSION IN THE STATES
The ACA was the most important legislative priority of newly elected Democratic President Barack Obama, one on which both the president and his party were willing to use their filibuster-proof majority in the Senate to ensure passage. As efforts to craft a bipartisan solution in Congress fell apart, the parties took divergent views about the desirability and expected impact of the bill, which was eventually passed without a single Republican vote. The partisan divide on the ACA differed radically from the bipartisan-enacting coalitions of earlier prominent social programs (Brill Reference Brill2015).
The ACA aimed to cut health care costs by increasing the percentage of insured citizens and increasing access to preventive care. To achieve this goal, the law provided income-based subsidies to assist with the purchase of private insurance; these subsidies would be available to those making between 100% and 400% of the federal poverty limit. Those making less than 138% of the poverty limit, on the other hand, would become eligible for the free public Medicaid insurance program. Prior to the ACA, Medicaid eligibility varied by state, but there was generally a significant portion of low-income, childless adults without insurance in all states (Brooks et al. Reference Brooks, Touscher, Artiga, Stephens and Gross2015). For example, in the 28 states expanding Medicaid as of January 2015, the median Medicaid eligibility limit was 106% of the federal poverty limit for parents and 0% for childless adults (the federal poverty limits for 2014 were $19,790 for a family of three and $11,670 for an individual). With the expansion of Medicaid, these eligibility limits were to be increased to 138% of the federal poverty line for all, regardless of dependents.
While the ACA presumed that the federal government could compel the states to expand Medicaid using the threat of federal aid, this provision was ruled unconstitutional by the U.S. Supreme Court. As a result of the 2012 decision in National Federation of Independent Business v. Sebelius, the expansion of Medicaid was left to the discretion of each state, with a patchwork pattern of Medicaid expansion resulting when the ACA’s major provisions took effect on January 1, 2014.Footnote 1
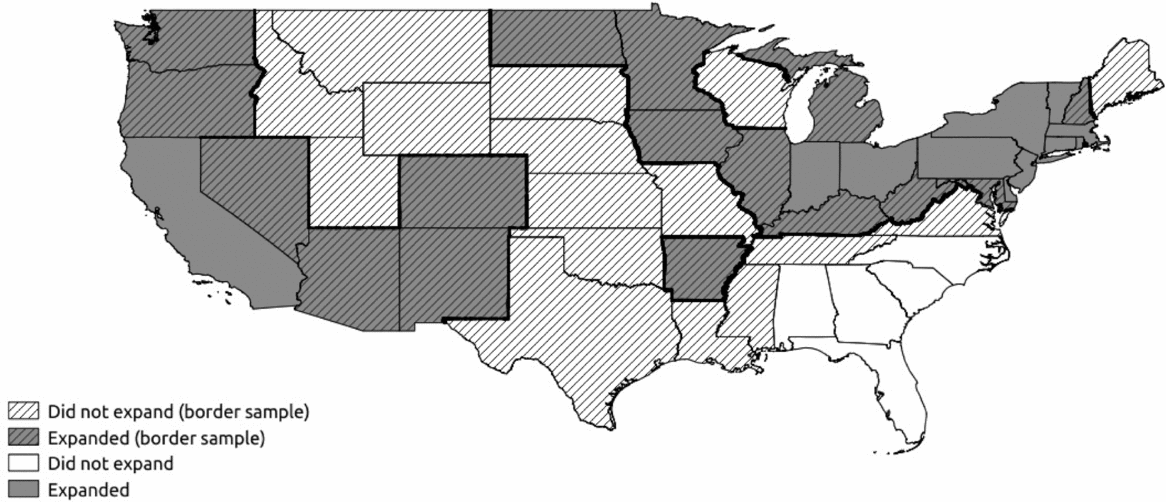
To provide a sense of the varied policy environment, Figure 1 maps the expansion status of the 48 contiguous states as of 2014.Footnote 2 The darker shaded states are those that had expanded Medicaid as of 2014, while the lighter shaded states did not. We highlight the 32 “border states” that we focus on in the analysis that follows—states that share a border with at least one state with a different expansion status—by adding an additional shading of diagonal lines. While states choosing to expand Medicaid are somewhat more likely to support Democratic politicians at the ballot box, the decision to expand Medicaid was not entirely determined by party; several states voting for the Republican presidential candidate in every election between 2000 and 2012 voted to expand Medicaid (e.g., North Dakota, New Mexico, Arkansas, West Virginia), several states that have voted for the Democratic candidate in every election between 2000 and 2012 chose not to expand (e.g., Wisconsin and Maine), and several states won by each party twice since 2000 decided to expand (e.g., Nevada and Colorado).
Status of Medicaid Expansion in the States as of 2014

Beyond the direct effect of increasing the percentage with health insurance, the expansion of Medicaid may have also increased political participation.Footnote 3 Research on policy feedback theorizes both “interpretive” and “resource” effects (Pierson Reference Pierson1993; Campbell Reference Campbell2012). Regarding the former, many argue that universalistic social programs are likely to produce positive psychological benefits (Skocpol Reference Skocpol, Jencks and Peterson1991; Wilson Reference Wilson1987), whereas means-tested programs should produce null (Sharp Reference Sharp2012) or even negative (e.g., Soss Reference Soss1999, Reference Soss2002; Mettler and Stonecash Reference Mettler and Stonecash2008) effects. In the case of the ACA, besides the demobilizing impact of stigmatization related to means-testing (e.g., Schneider and Ingram Reference Schneider and Ingram1993), the politicized nature of the policy may also adversely affect the ability of the program to mobilize beneficiaries (Patashnik and Zelizer Reference Patashnik and Zelizer2013). Partisanship may moderate the impact of the policy benefits (Kriner and Reeves Reference Kriner and Reeves2014; McCabe Reference McCabe2016; Lerman, Sadin, and Trachtman Reference Lerman, Sadin and Trachtman2017; Lerman and McCabe Reference Lerman and McCabe2017) and Republican beneficiaries may follow elite cues and oppose a policy they personally benefit from (Kliff Reference Kliff2016). At the same time, we cannot rule out positive interpretive effects either: the embrace of the expansions and the ACA by President Obama, the Democratic party, and numerous governors from both parties may have dampened or even reversed any potentially stigmatizing effects.
Beyond potential interpretive effects, there is also a robust correlation between economic status and turnout (e.g., Wolfinger and Rosenstone Reference Wolfinger and Rosenstone1980; Highton and Wolfinger Reference Highton and Wolfinger2001; Schlozman, Verba, and Brady Reference Schlozman, Verba and Brady2012; Leighley and Nagler Reference Leighley and Nagler2014). Increasing access to health care may boost political participation by increasing the health and economic welfare of its recipients (Pacheco and Fletcher Reference Pacheco and Fletcher2015), or by limiting adverse health outcomes and allowing recipients to better integrate with normal civic life (Blais Reference Blais2000). Whether the expansions lead to “resource effects” (Mettler Reference Mettler2002) sufficient to increase political participation is unclear—especially since those benefiting from the expansion are among those who are the least likely to vote, given their demographic characteristics. Two recent studies, however, highlight the possibility of positive effects: Burden et al. (Reference Burden, Fletcher, Herd, Moynihan and Jones2017) find that an increase in financial (and mental) health provides an increased ability to overcome the costs associated with political participation, while a randomized controlled trial involving Medicaid expansion in Oregon reveals an increase in mental and financial heath (but not necessarily physiological health) as a consequence of receiving Medicaid (Baicker et al. Reference Baicker, Taubman, Allen, Bernstein, Gruber, Newhouse, Schneider, Wright, Zaslavsky and Finkelstein2013).
Increased participation by recipients of the expanded Medicaid program may also occur because of the connection between the ACA and the 1993 National Voter Registration Act (NVRA). The NVRA requires that departments of motor vehicles and other public assistance agencies provide voter registration services in addition to their regular duties. Because the health exchanges created by the ACA are public assistance agencies, according to the Department of Health and Human Services, the process by which individuals register for health insurance must also allow them to register to vote. Because barriers related to registration are often cited as a key reason for low turnout in the U.S. relative to other advanced democracies (Powell Reference Powell1986), the connection between the ACA and the NVRA could increase voter registration and, as a consequence, voter participation. Indeed, some conservatives decried the ACA’s supposed link to voter registration efforts, claiming that “there is obviously massive Democrat voter registration going on at these exchanges” (Roth Reference Roth2014), and some of those tasked with helping individuals sign up for health insurance were actively engaged in voter registration efforts (Hagan Reference Hagan2016).Footnote 4
While the existing policy-feedback literature emphasizes the mobilization of policy beneficiaries, the partisan nature of the law raises the possibility that opponents are also mobilized (Haselswerdt Reference Haselswerdt2017; McCabe Reference McCabe2016). If voters are motivated to participate by policies they disagree with—perhaps following a so-called thermostatic model of behavior (Soroka and Wlezien Reference Soroka and Wlezien2010; Bendz Reference Bendz2015)—citizens opposed to Medicaid expansion may be as motivated to increase their participation as policy beneficiaries. Republican-allied groups were active in contesting the ACA and the Medicaid expansions in 2010—Béland, Rocco, and Wadden (Reference Béland, Rocco and Waddan2016), for example, show that more money was spent on statewide races in 2010 than in 2008 or 2012, and conservative policy organizations increased their contributions by more than 70% between 2008 and 2010—and the expansion of Medicaid may have produced a similar mobilization in the 2014 midterm elections.
Several patterns of policy blowback are possible. One possibility is that opponents in nonexpansion states mobilize at similar or greater rates than policy beneficiaries—perhaps to defeat efforts to expand Medicaid in their state. If so, we should not observe a larger increase in participation in expansion states relative to nonexpansion states. Alternatively, perhaps opponents are mobilized in expansion states as a direct response to the expansion. If so, participation should increase more in expansion states, and the effects should not be concentrated in counties with a high percentage of newly eligible citizens, given that opponents to the ACA are wealthier and more likely to already have health insurance (Henderson and Hillygus Reference Henderson and Hillygus2011), unless those who are most opposed reside in the counties that experience the greatest policy effects. Finally, because of these differences, any policy-blowback effects should affect turnout more than registration, given that the wealthier, more-likely-to-be-insured opponents of the expansions were also already more likely to be registered to vote.
EFFECT OF MEDICAID EXPANSION ON INSURANCE COVERAGE
We begin by exploring whether the expansion of Medicaid increased insurance coverage; we later use an identical identification strategy to characterize the impact on voter registration and turnout. Demonstrating that the expansion of Medicaid increased the percentage of insured individuals is an important first step, as sizable policy impacts make the hypothesized political impacts more likely. Existing work has examined randomly assigned Medicaid eligibility in Oregon to argue that Medicaid has positive health and wealth benefits for its recipients (Finkelstein et al. Reference Finkelstein, Taubman, Wright, Bernstein, Gruber, Newhouse, Allen and Baicker2012); others have examined the impact of pre-ACA Medicaid expansions on mortality rates (e.g., Sommers, Baicker, and Epstein Reference Sommers, Baicker and Epstein2012). We focus on the more immediate impact of insurance, as a connection between expansion and coverage is a necessary condition for citizens to form expectations between policy choices and their own welfare (Arnold Reference Arnold1990), as is required for policy feedback.Footnote 5
Prior work on policy feedback largely relies on cross-sectional variation in the self-reported behavior of survey respondents (e.g., Soss Reference Soss1999; Mettler and Stonecash Reference Mettler and Stonecash2008). While much can be learned from such studies, it is difficult to assess whether observed relationships are due to policy feedback, or preexisting differences in the (potentially unobservable) characteristics of beneficiaries. There are many potential ways in which those who receive a program may differ from those who do not, especially for programs in which eligibility depends on characteristics known to be related to participation (Schlozman, Verba, and Brady Reference Schlozman, Verba and Brady2012). In addition, unobservable characteristics such as lower aspiration levels (Bendor Reference Bendor2010) or increased feelings of stigmatization or undeservedness (Schneider and Ingram Reference Schneider and Ingram1993) may be higher among those who are eligible for means-tested programs such as Medicaid. If so, a cross-sectional analysis will be unable to disentangle whether observed differences in outcomes are due to confounding factors.Footnote 6
To overcome these difficult selection issues, we leverage the spatial policy discontinuities (Holmes Reference Holmes1998; Card and Krueger Reference Card and Krueger1994; Dell Reference Dell2010; Dube, Lester, and Reich Reference Dube, Lester and Reich2010; Lee and Lemieux Reference Lee and Lemieux2010; Keele and Titiunik Reference Keele and Titiunik2015; Keele et al. Reference Keele, Lorch, Passarella, Small and Titiunik2017) produced by the 2012 Supreme Court decision. Insofar as counties located near the border of a neighboring state were not pivotal for the expansion of Medicaid in their state—a reasonable assumption once we condition on observable county characteristics—we can treat the expansion of a county’s state as independent of other factors that may influence a county’s insurance coverage and political participation.
To measure the relative change in insurance status between expansion and nonexpansion states, we use the Census Small Area Health Insurance Estimates (SAHIE). These data provide annual counts of those with and without insurance by geographic and demographic subgroups. While partially model-based, the census draws on a variety of administrative and population-based sources—including state-provided counts of those covered by Medicaid and IRS counts of those at different income levels—to produce these estimates (United States Census Bureau 2017). Formally, our measure of changes in the share uninsured in county c in state s, between year pre and year post is:
 $$\begin{eqnarray*}
&&\Delta PctUninsured_{cs} \nonumber = \left(\frac{Uninsured \ 18 \ to \ 64_{cs,post}}{Population \ 18 \ to \ 64_{cs,post}} * 100 \right)\\
&&\quad -\, \left(\frac{Uninsured \ 18 \ to \ 64_{cs,pre}}{Population \ 18 \ to \ 64_{cs,pre}} * 100 \right).
\end{eqnarray*}$$
Because the Medicaid expansions were primarily intended for poor adults ineligible for other insurance programs, we also focus on the share of the uninsured among the population aged 18-64 and making less than 138% of the federal poverty limit. Here and elsewhere, we distinguish between counties that have a high number of residents who would potentially benefit from the Medicaid expansion, and those with a low number of potential beneficiaries. Because the Medicaid expansions were designed to impact a specific population—adults making up to 138% of the poverty level—we calculate a measure of potential eligibility for each county c in state s:
 {\fontsize{9}{11}\selectfont{$$\begin{eqnarray*}
&&PotentialEligibility_{cs} \\
&&\quad= \frac{Population \ 18 \ to \ 64 \ making \le 138\% \ poverty \ limit_{cs,2013}}{Population \ 18 \ to \ 64_{cs,2013}}
\end{eqnarray*}$$}}
That is, we take the share of the aged 18-64 population making up to 138% of poverty in 2013.Footnote 7 We use 2013 because it was the last year before the implementation of Medicaid expansions; we limit to age 18–64 to exclude populations already covered by existing government insurance programs (CHIP and Medicare) prior to the ACA. States’ Medicaid programs varied in their eligibility levels prior to expansion, but we obtain similar results using measures that account for such differences (e.g., the share without insurance in 2013) and other, less model-based measures (the share in poverty).
Graphical Analysis
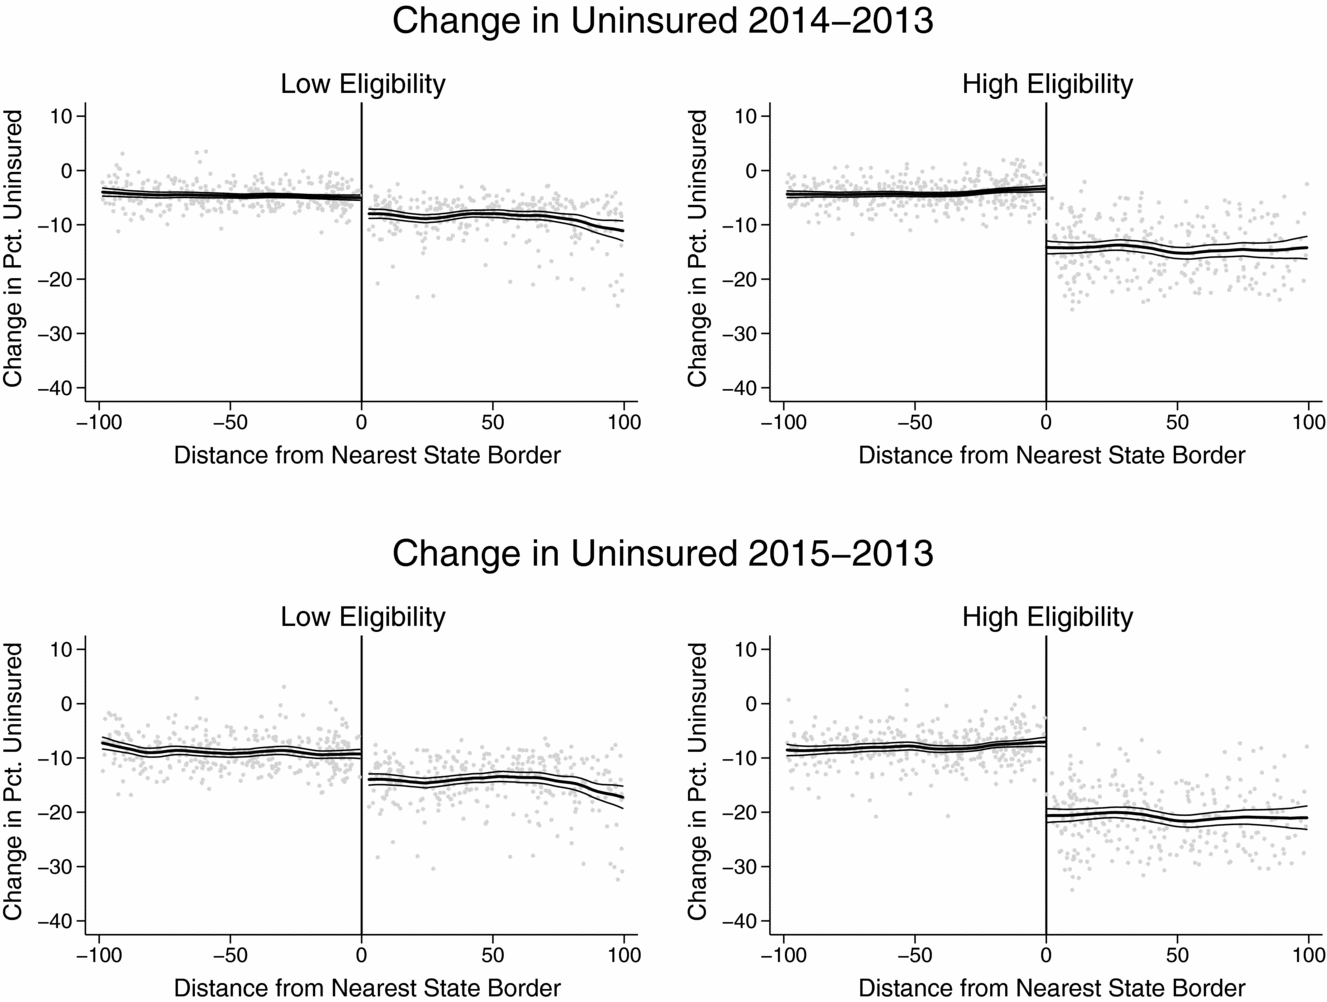
Figure 2 plots county-level changes in the percent uninsured between 2014 and 2013 (top panel) and between 2015 and 2013 (bottom panel) against the distance from a county’s geographic center to the closest bordering state with a different expansion status.Footnote 8 Each point in Figure 2 represents a county bordering a state with a different expansion status; negative numbers on the horizontal axis indicate increased distance from the border of an expansion state, and positive numbers indicate increased distance from a nonexpansion state. Thus, points to the right of zero are county-level changes in the percentage of uninsured residents in states expanding Medicaid, and points to the left of zero are county-level changes in states opting not to. The solid lines represent moving averages generated by a local polynomial smoother, which we allow to vary for either side of the threshold. To account for potential heterogeneity in the county comparisons, we limit the comparison to counties within 100 miles of the nearest border, although other thresholds reveal qualitatively similar conclusions (see Section 1 of the Online Appendix).Footnote 9
Change in Percent Uninsured, 2014–2013 and 2015–2013, by Distance to Border

Examining the top two panels jointly, the percentage of uninsured residents decreased in nearly all counties between 2013 and 2014, presumably due to the provisions in the ACA that were nationally applicable (e.g., the required coverage of those with preexisting conditions and of dependents under the age of 26). However, the change in the share uninsured also decreases sharply at the border between expansion and nonexpansion states. In fact, within this 100-mile window, the average decrease in the percentage of uninsured residents is uniformly larger (in absolute terms) in counties that are located in states that chose to expand Medicaid.
The top-left panel of Figure 2 displays changes in the percentage of uninsured for counties with below-median eligibility, as measured using the potential eligibility measure given above, and the top-right panel shows changes for counties with above-median eligibility. (In our sample, the median share eligible in a county is about 22%.) Comparing the top-left and top-right panels in Figure 2 shows larger decreases occurred in counties with higher potential eligibility, and the largest decreases occurred in high-eligibility counties in expansion states. In fact, the decrease in the percentage of uninsured in high-eligibility counties in expansion states (right side of top-right panel) is over twice as large, on average, as the decrease in high-eligibility counties in nonexpansion states (left side of top-right panel). Moreover, the decrease in the percentage of uninsured in low-eligibility counties in expansion states (right side of top-left panel) exceeds the decrease that occurs in high-eligibility counties located in nonexpansion states (left side of top-right panel). The bottom panel of Figure 2 shows the percentage of uninsured residents continued to decline into 2015, and that the decline continues to be largest in high-eligibility counties located in expansion states.
Regression Analysis
Figure 2 strongly suggests expanding Medicaid eligibility decreased the percentage of uninsured residents, especially in counties with higher shares of potential eligibles. To quantify the impact more precisely and control for possible confounding effects, we estimate the following regression for ΔPctUninsured cs —the change in the percentage of uninsured residents between 2014 and 2013, and between 2015 and 2013, in county c in state s:
 $$\begin{eqnarray}
&&\Delta PctUninsured_{cs}\nonumber \\
&& \quad = \alpha Expansion_{s} + \beta Distance_{cs}\nonumber \\
&& \qquad + \mu HighEligibility_{cs} \nonumber \\
& & \qquad +\gamma \left(Expansion_{s} \times Distance_{cs} \right) \nonumber \\
& & \qquad +\nu \left( Expansion_s \times HighEligibility_{cs} \right) \nonumber \\
& & \qquad +\eta \left( Distance_{cs}\times HighEligibility_{cs} \right) \nonumber \\
& & \qquad +\delta \left(Expansion_{s} \times Distance_{cs} \times HighEligibility_{cs} \right) \nonumber \\
& & \qquad + \bm {X}_{cs} \pi + e_{cs},
\end{eqnarray}$$
where Expansion s is an indicator for whether the state expanded Medicaid (1) or not (0), Distance cs is a measure of distance (in miles) of county c to its closest neighboring state with a different expansion status, and X is a vector of county-level covariates: the share of white residents, the share aged 65 and older, the share with a high school degree or less, median income (logged), voting age population (logged), and lagged percentage uninsured. We also include HighEligibility cs , an indicator for whether the potentially eligible population share is greater than the median (i.e., the same variable by which we distinguish counties in Figure 2).Footnote 10 The perpendicular distance to the closest border is used as a “forcing variable” to control for other relevant but omitted characteristics and allow for the possibility that closer counties are more similar.Footnote 11 e cs denotes idiosyncratic errors, which we cluster by state using the wild bootstrap of Cameron, Gelbach, and Miller (Reference Cameron, Gelbach and Miller2008) to account for the small number of clusters.Footnote 12 The parameters of primary interest in Equation (1) are α—the average change in the percentage of uninsured citizens in low-eligibility counties, all else equal—and ν, the difference in discontinuities between high- and low-eligibility counties.
Several assumptions are required to interpret α and ν as causal effects. First, the outcome in county c must not depend on the treatment status of counties c′ ≠ c. That is, whether or not other counties experience an expansion of Medicaid cannot directly affect the change in insurance coverage of other counties. This assumption would be violated if individuals living in nonexpansion states relocated into expansion states because of the expansion of Medicaid. The impact of such sorting seems limited, as only those making between 138% of the federal poverty limit and the eligibility limit established by the state would benefit from such a move, and relocation costs are likely nontrivial for this group. Consistent with this view, recent work estimates that the upper-bound for Medicaid-based migration is just 1,600 people per year in expansion states (Schwartz and Sommers Reference Schwartz and Sommers2014).Footnote 13
A second identifying assumption is that the other state-level determinants of insurance coverage do not simultaneously covary with the expansion of Medicaid. If the states choosing to expand Medicaid simultaneously took additional steps to manipulate coverage (or, more relevant for our analysis below, participation), our research design will be unable to disentangle the effects of Medicaid expansion from the effects of these other changes. We know of no such systematic changes, and we show later on that close counties are indeed similar on observable characteristics, and that the impacts we uncover are highly unlikely to be driven by arbitrary policy differences across borders.
Third, the trend of insurance coverage in nonexpansion states must be a sensible counterfactual for what would have occurred had the expansion states not expanded Medicaid. The assumption that expansion and nonexpansion states are on parallel paths with respect to insurance coverage requires that the potential change in insurance coverage for expansion and nonexpansion states is equal, on average, conditional on the included covariates. If so, we can use the trend we observe in nonexpansion states to infer what would have occurred in expansion states, had they chosen not to expand. We report tests of this parallel-paths assumption later in the paper.
Note our use of an interaction with eligibility reduces bias as well as variance. The increase in power comes from the fact that the law was targeted toward a specific group, such that we should see a more precisely estimated impact in counties with a larger share of eligibles. The interaction between expansion and the share potentially eligible also makes our specification a “difference in difference in differences” design (Angrist and Pischke Reference Angrist and Pischke2009, 242-3). That is, we compare participation before and after expansion, between counties with a high versus a low share of eligibles, between counties that did and did not expand (without this interaction, we would be comparing participation before and after expansion, between counties that did and did not expand). Many of the potential objections to our design come in the form of omitted variables that vary between states and over time. The triple difference design should control for these—if, for instance, expansion and nonexpansion states change in other ways pre- and post-expansion, these differences will be held constant when we compare counties with a high versus a low share of eligibles. That is, if time-varying differences between states also impact insurance and participation, they should hopefully do so equally for high- and low-eligible counties. (Note we obtain similar, but less precisely estimated results when we exclude interactions; see Section 5 of the Online Appendix.)
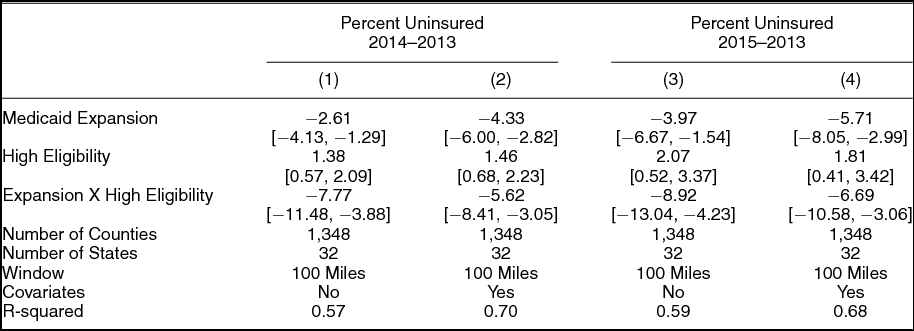
Table 1 reports the results of estimating specification (1). As in Figure 2, we first use the change between 2013 and 2014 as the outcome, and next use the change between 2013 and 2015. For each outcome, we compute estimates for close counties without covariates [columns (1) and (3)]; we then add covariates [columns (2) and (4)]. The results are consistent regardless of the outcome variable, and whether or not covariates are included. Columns (1) and (2) reveal that the expansion of Medicaid decreased the proportion uninsured in a county by between three and four percentage points in low-eligibility counties on average; the 95% confidence intervals for these two estimates suggest the impact could be as small as −1.3 points, or as large as −6 points. The impact is about twice as large in high-eligibility counties, however, as the relevant interaction coefficients are between six and eight points (with confidence intervals spanning −3 and −11 points). Consistent with Figure 2, columns (3) and (4) show the decreases are greater when comparing 2015 to 2013: between four and six points in low-eligible counties (95% confidence intervals spanning −1.5 and −8), but as much as nine points larger (confidence intervals spanning −3 and −13) in high-eligible counties. All of these estimates are statistically significant at conventional levels, with the 95% confidence intervals never crossing zero.
Effect of Medicaid Expansion on the Percent Uninsured

Covariates include the share of white residents, the share age 65 and older, the share with a high school degree or less, median income (logged), voting age population (logged), and lagged percentage uninsured. All specifications also include distance from the border in miles, an interaction between distance and eligibility, and a triple interaction between expansion, distance, and eligibility. 95% confidence intervals based on the wild cluster bootstrap of Cameron, Gelbach, and Miller (Reference Cameron, Gelbach and Miller2008) clustered by state are reported in the brackets.
EFFECT ON POLITICAL PARTICIPATION
Having shown sizable policy impacts, with the the largest effects located in the counties with the largest percentage of potentially eligible beneficiaries, we now explore whether the expansion of Medicaid also increased voter participation. To compare the political impacts on voter registration and voter turnout, we employ the same identification strategy used to examine the effect of the expansions on the percentage of uninsured residents in a county. That is, we compare county-level registration and turnout in a post-expansion statewide election to a pre-expansion election, and we examine how these changes vary at the expansion border. For voter registration, we calculate:Footnote 14
 $$\begin{eqnarray*}
\Delta Reg_{cs} &=& \left(\frac{TotalReg_{cs,post}}{VotingAgePop_{cs,post}} * 100 \right)\\
&& -\, \left(\frac{TotalReg_{cs,pre}}{VotingAgePop_{cs,pre}} * 100 \right)
\end{eqnarray*}$$
We use the registration and turnout statistics from David Leip’s Atlas of US Presidential Elections (Leip Reference Leip2017), and we calculate the voting age population using the federal census.Footnote 15 Although election laws vary across states (e.g., laws related to felon disenfranchisement (Meredith and Morse Reference Meredith and Morse2015)), stable between-state and between-county differences in the administration of elections cannot be responsible for the differences we identify, because our focus is on county-level changes.
We use the two national elections following the expansions to assess participatory impacts: the 2014 midterm election and the 2016 presidential election. To ensure that we are comparing participation in each race to its most similar pre-expansion race, we compare participation in 2014 to 2010, and we compare participation in 2016 to 2012. (Section 6 of the Online Appendix reports results using every election since 2004 as the baseline and reveals qualitatively similar conclusions; here, we focus on the most temporally proximate comparison involving the most similar set of elections to narrow the range of possible confounders and focus the exposition.) Even so, the midterm comparison of 2014 to 2010 is potentially problematic, because unlike the comparison of 2016 to 2012 when every state had the same top-of-the-ticket contest, different states had different offices on the ballot in 2014 and 2010. In 2014, for example, some states had only a senatorial election, some states only had a gubernatorial election, some had both, and at least one state had only an at-large House election (North Dakota). To deal with the variation in electoral environments in midterm election years we take several approaches, including controlling for the races held in each state in each midterm year, and focusing on changes in participation amongst pairs of states with the same races. While we can control for the races on the ballot, we do not attempt to directly adjust for the competitiveness of each race; however, we do control for a measure of general political competition in each state. It is not obvious that the between-state electoral variation in the post-expansion election is not itself an outcome of the expansions. If electoral differences are correlated with expansion status and the decision to expand (or not) is responsible for the electoral differences, we can still conclude that the expansion affects participation.
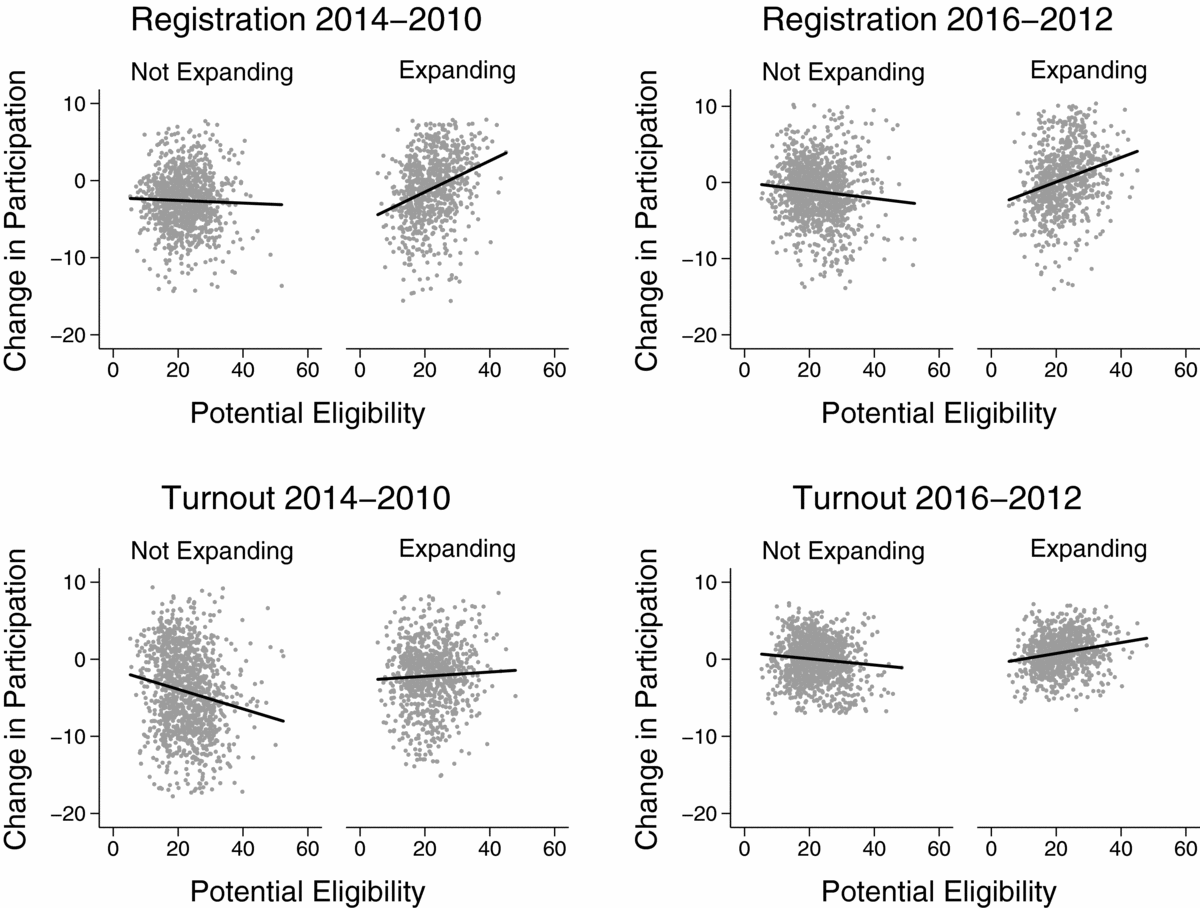
It is useful to consider the raw relationship between the percentage of potentially eligible beneficiaries prior to expansion (in 2013) and the post-expansion changes in registration and turnout. Figure 3 plots these changes for four outcomes: the change in registration between 2010 and 2014 (top-left), the change in registration between 2012 and 2016 (top-right), the change in turnout between 2010 and 2014 (bottom-left), and the change in turnout between 2012 and 2016 (bottom-right). For each outcome, we simply scatter the change in participation against the share of potential eligibles, for both nonexpansion and expansion states.
Change in Participation by Potential Eligibility

Figure 3 reveals clear differences in the relationship between eligibility and political participation. In nonexpanding states, there is a slightly negative relationship between eligibility and participation, which is to be expected given the robust correlation between economic status and voting. Yet the relationship is reversed in expansion states. Contrary to well-known correlations between income and political participation, but consistent with a policy feedback effect concentrated among beneficiaries, Figure 3 reveals that increases in registration and turnout are more likely to occur in counties with higher percentages of newly eligibles in expansion states. We also observe a stronger relationship for registration as opposed to turnout. While reassuring, given that registration is a necessary first step for voting, the relative magnitude of the effects provides suggestive evidence that the primary impact of the expansion was not to mobilize already-registered voters to the voting booth.
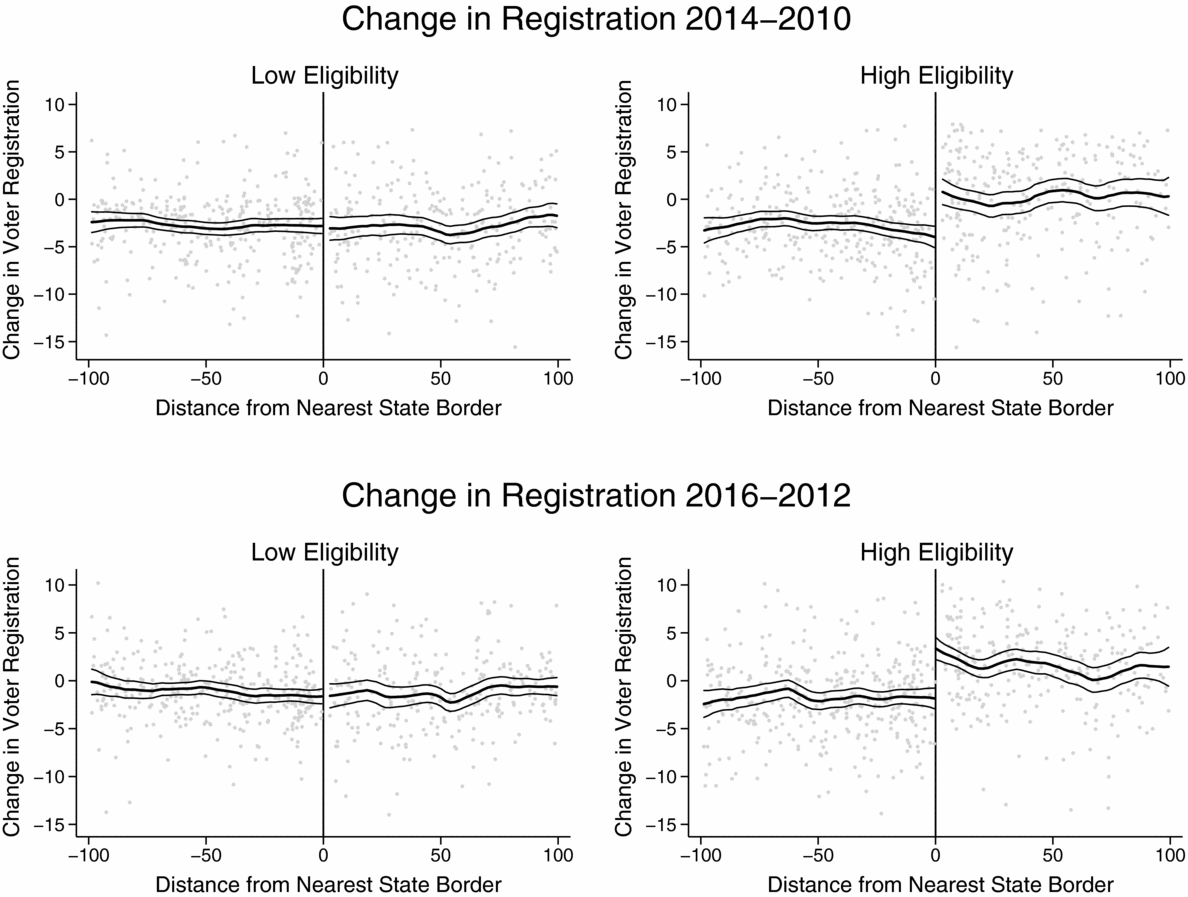
Of course, these patterns are simply raw correlations, and there are many potential alternative explanations for these relationships. To begin to rule out some of these explanations, Figure 4 plots changes in registration against distance to the border for counties in a 100-mile window.Footnote 16 There is no observable impact on registration in low-eligibility counties (top-left panel), but there is a positive jump in registration in high-uninsured counties (top-right panel). For 2016 registration, we see similar patterns: no evidence of discontinuities for low-eligibility counties, and a positive jump for high-eligibility counties. The pattern of results is strikingly similar to the impacts we identify for insurance coverage—although instead of a weaker impact on insurance rates in low-eligibility counties, there is no impact at all. This is a sensible result: if the change in participation is truly being driven by the newly insured, then the change in the former should not exceed the latter, and will probably be a good deal smaller. Only some who sign up for Medicaid will not yet be registered to vote, and of those, only some will choose to register.Footnote 17
Change in Registration by Distance to Border

We next estimate regression specifications similar to those used in the previous section, but now using ΔReg cs as the dependent variable. To account for differences in the electoral and political environment, we control for the presence of various statewide races in 2014 and 2010 (senate, gubernatorial, or both), whether the county is located in one of the nine swing states identified by the Washington Post in the 2012 election,Footnote 18 the 2012 Democratic presidential vote share, and the percentage of registered voters in the “pre” election. As with our uninsurance regression, we also control for the share white, share with a high school education or less, share over 65, log median income, and log population.
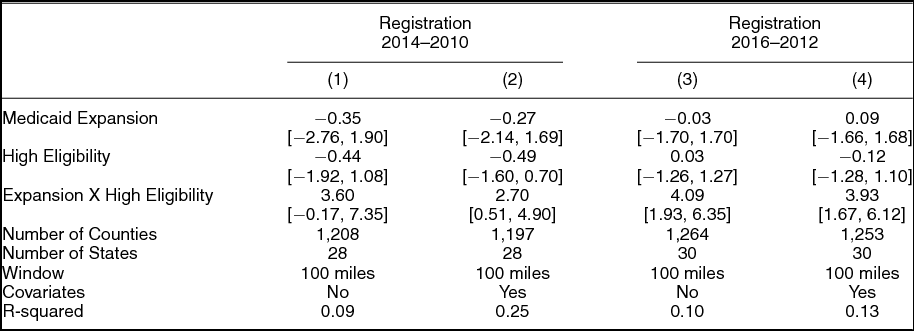
Table 2 shows the results of four specifications. The first two columns use the change in registration between 2010 and 2014 as the outcome, and the final two columns use the change between 2012 and 2016. For both outcomes, we show results without [columns (1) and (3)] and with [columns (2) and (4)] covariates. The results are not greatly impacted by the inclusion of covariates, and they are consistent with the graphical evidence shown in Figures 3 and 4. There is no evidence that the expansion influenced registration in counties with a low share of potential eligibles—that is, the counties where the expansion had the lowest impact on insurance—with the point estimates essentially at zero and with wide confidence intervals spanning −3 and +2 points. In counties with a high share of potential eligibles, the estimated impacts on registration are between 2.7 and 3.6 for 2014–2010, and are around 4 points for 2016–2012. The slightly higher impact in 2016 is consistent with the slightly larger decrease in the percentage of uninsured residents in 2015–2013 relative to 2013–2014 that we identified in Table 1. With the exception of the no-covariates specification for 2014–2010, for which the confidence interval is −0.17 to 7.35, the interactions are all statistically significantly distinguishable from zero at conventional levels using a two-sided test.Footnote 19
Effect of Medicaid Expansion on Voter Registration

Covariates include the percentage of white residents, the percentage of residents with a high school degree or less, the percentage of residents above the age of 65, log median income, log voting age population, the percentage of Democrat vote share in 2012, the proportion registered in the preelection, whether the state was a swing state in 2012, and [columns (1) and (2) only] indicators for a gubernatorial election, senatorial election, and the interaction between the two for 2014 and 2010. All specifications also include distance from the border in miles, an interaction between distance and eligibility, and a triple interaction between expansion, distance, and eligibility. 95% confidence intervals based on the wild cluster bootstrap of Cameron, Gelbach, and Miller (Reference Cameron, Gelbach and Miller2008) clustered by state are reported in the brackets.
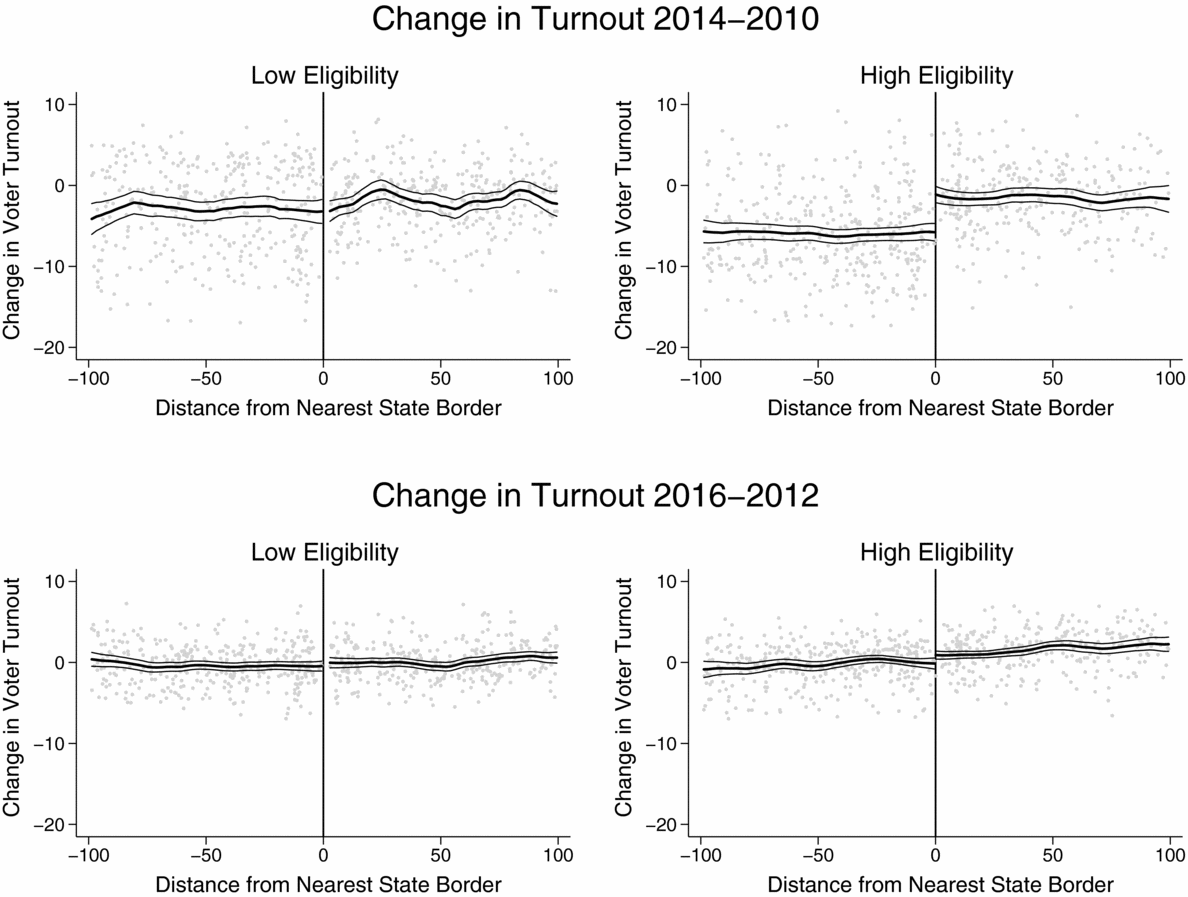
Repeating the graphical analysis for voter turnout in Figure 5 reveals a similar pattern for changes in turnout between 2010 and 2014: there is no jump at the border for low-eligibility counties, suggesting that turnout is unchanged by the expansion of Medicaid in counties with lower-than-average eligibility levels, but there is an increase of a few points in high-eligibility counties (top panels). However, when comparing the presidential election years of 2016 and 2012 there is little evidence of an increase in turnout for either set of counties (bottom panels).
Change in Turnout by Distance to Border

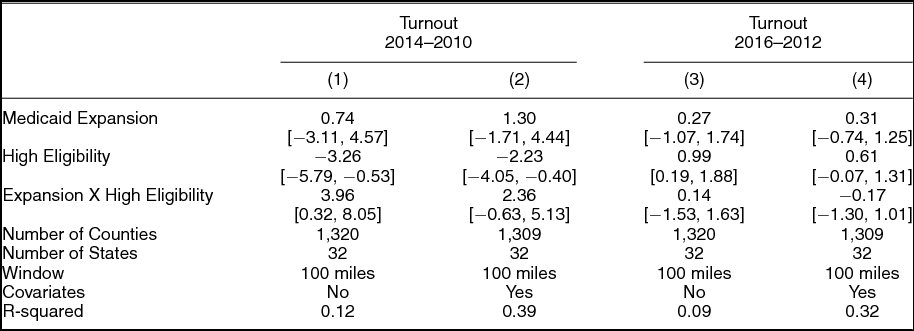
Table 3 presents the relevant regression estimates to show that controlling for covariates does not significantly change this interpretation: the estimated coefficients for expansion representing the jump at the threshold for low-eligibility counties are again close to zero and statistically insignificant. The key interaction—between expansion and eligibility—is positive and precisely estimated only for 2014–2010 and only without covariates. When covariates are included, the estimated turnout effect for 2014 falls from about 4 points to roughly 2.4 points, and the effect is more uncertain, and no longer distinguishable from zero at conventional levels (the 95% confidence interval ranges from −0.63 to 5.13).
Effect of Medicaid Expansion on Voter Turnout

Covariates include the percentage of white residents, the percentage of residents with a high school degree or less, the percentage of residents above the age of 65, log median income, log voting age population, the percentage of Democrat vote share in 2012, the proportion voting in the preelection, whether the state was a swing state in 2012, and (first two columns only) indicators for a gubernatorial election, senatorial election, and the interaction between the two for 2014 and 2010 (first four columns only). All specifications also include distance from the border in miles, an interaction between distance and eligibility, and a triple interaction between expansion, distance and eligibility. 95% confidence intervals based on the wild cluster bootstrap of Cameron, Gelbach, and Miller (Reference Cameron, Gelbach and Miller2008) clustered by state are reported in the brackets.
In contrast, comparing the change in turnout between 2012 to 2016 reveals no evidence of an increase in either set of counties. Not only are the point estimates close to zero for both the main effect and the interaction, but the confidence intervals around those point estimates are also much tighter than for the comparison of the midterm elections of 2014 and 2010. Even if there was an impact on turnout in 2014, the effect was no longer present two years later during the 2016 presidential election—an election in which the winning Republican candidate, Donald Trump, was explicitly campaigning on the repeal and replacement of the ACA.
ROBUSTNESS CHECKS
By focusing on changes in participation at the border, our design is able to rule out several alternative explanations for the relationship between the ACA’s expansions and participation. However, it is still possible that other important factors also change discontinuously at state borders in ways that may confound our comparisons. Before moving to interpret the meaning of the results, in this section we report a series of tests we conduct to address such concerns.
First, in Section 3 of the Online Appendix, we replicate our participation results using specifications with border fixed effects, which control for heterogeneity across pairs of states, as well as a two-dimensional measure of distance from the border (Keele and Titiunik Reference Keele and Titiunik2015). Our results are generally robust to these additional specifications.Footnote 20 Second, in Section 4 of the Online Appendix we show that there is no differential trend in migration between expansion and nonexpansion states, suggesting that residential sorting as a consequence of the expansion is not an important confounder for our results. Third, we show in Section 7 of the Online Appendix that close counties are indeed similar on observable characteristics, as there is no detectable jump in potential eligibility, race, population, age, income, or partisanship at the border.
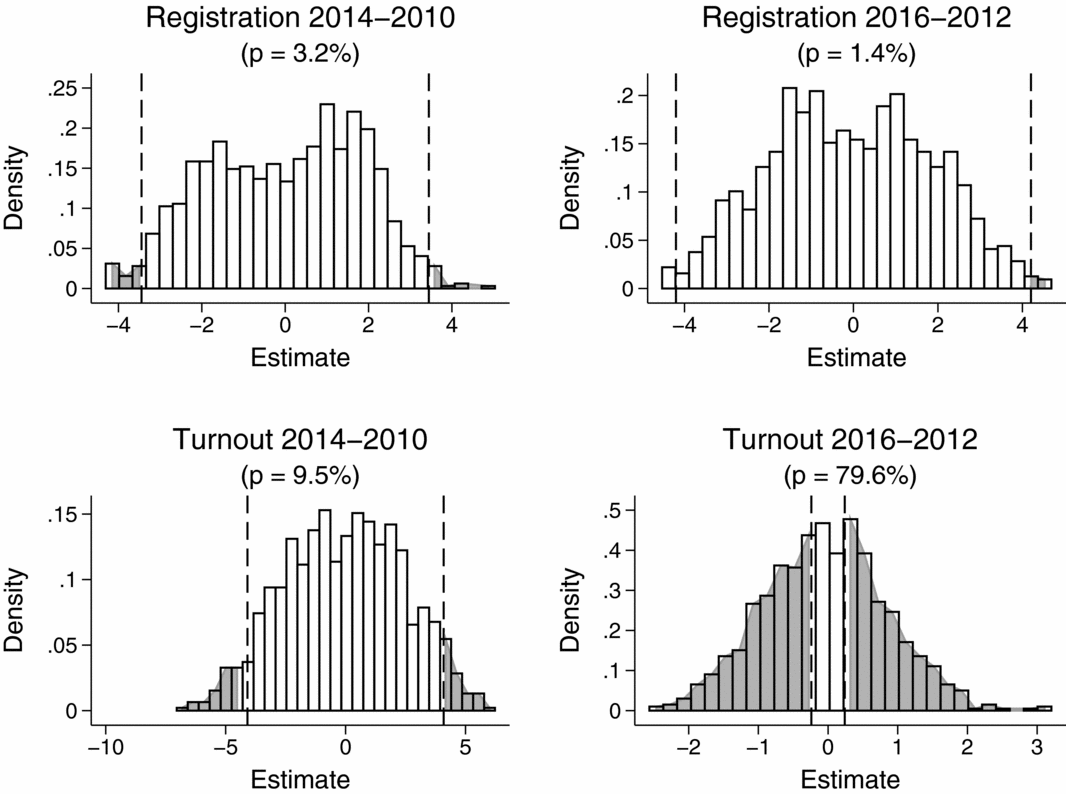
Fourth, we test whether arbitrary cross-state differences could produce similarly sized effects by randomly assigning a placebo expansion to 27 randomly selected states. We repeat this procedure for 1,000 iterations, estimating the same participation specifications reported above for each of our four comparisons.Footnote 21 Figure 6 plots the distribution of point estimates (interactions between expansion and an indicator for high eligibility) from this exercise. Reassuringly, the estimates are always centered around zero, and only very rarely do we obtain a placebo estimate that is at least as large as the observed estimates: 3.2% of the time for 2014–2010 registration, 1.4% of the time for 2016–2012 registration, and 9.5% of the time for 2014–2010 turnout. Consistent with our observed estimates, we regularly (79.6% of the time) obtain estimates for 2016–2012 turnout that are as large or larger than the observed estimates. Overall, then, the results of this exercise suggest that the participation effects we find are not spurious.Footnote 22
Placebo Expansion Estimates

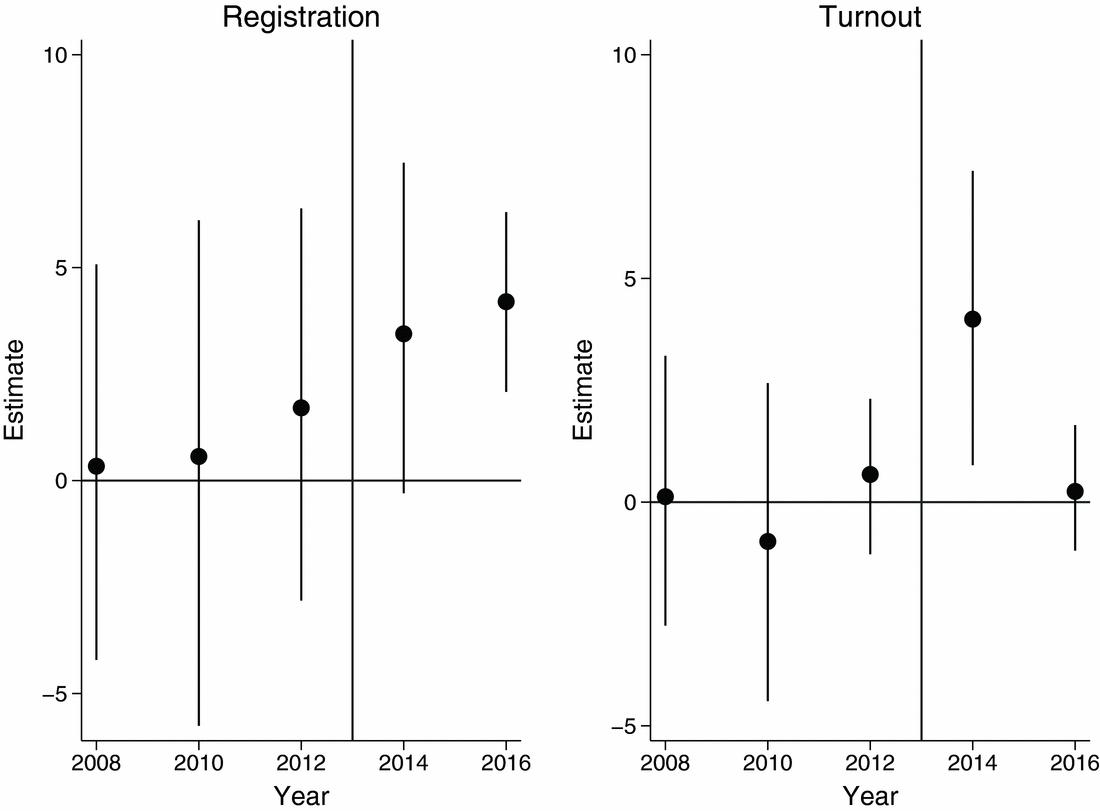
Fifth, we probe the assumption that the trend in participation in nonexpansion states is a good counterfactual trend for expansion states, had they not expanded. Using data from Leip (Reference Leip2017) back to 2004, we calculate four-year changes in registration and turnout for three pre-expansion elections: 2008 (compared to 2004), 2010 (2006), and 2012 (2008). We then estimate the same specification we used for 2014 and 2016 participation (without covariates), but with these pre-expansion variables as outcomes. If we were to observe an impact on pre-expansion changes in participation, this would suggest that nonexpansion states are not, in fact, a sound counterfactual, and that expansion states may have increased their participation even in the absence of expansion.
Figure 7 plots the relevant coefficient estimates (the interaction between expansion and high eligibility) for each outcome. The vertical line at 2013 is meant to differentiate pre- versus post-expansion elections, and we include the two post-expansion elections for comparison. The left panel shows estimates for registration, and the right panel shows estimates for turnout. In both panels, the point estimates are not significantly different from zero for any pre-expansion election, only becoming significant in the post period.Footnote 23
Trends in Participation Pre- and Post-expansion

Seventh, to more directly address the possibility that differences in the electoral environment are influencing our results, in Section 10 of the Online Appendix we calculate discontinuity estimates for each of the borders (pairs of states). Overall, the mean estimated impact for 2014–2010 registration is 2.7, and the standard error of the estimates is 0.6. More importantly, the effects are not weaker, but are in fact stronger, when we focus in on the seven pairs of states that had the exact same electoral configurations in 2010 and 2014. For example, if both states within a border had a gubernatorial and a senate race in both 2010 and 2014, they are a match; if both states had a gubernatorial race in 2010 but not 2014, and a senate race in both years, they are a match; and so on. (The seven pairs of states with matching races are: Virgnia-West Virginia, Kansas-Colorado, Oklahoma-Colorado, Idaho-Oregon, South Dakota-Iowa, Oklahoma-Arkansas, and Texas-New Mexico.) This suggests our results are not being driven by differences in the electoral environment across states.Footnote 24
Eighth, in Section 11 of the Online Appendix we estimate a “within-state” specification where we regress changes in participation on the share eligible, separately for expansion and nonexpansion states. This specification is similar to the graphical analysis presented in Figure 3 above, but includes the same covariates as included in our discontinuity specifications, and also yields a standard error. In some specifications, we also include state fixed effects, which should absorb any within-state confounders including the electoral environment (note we do not include state fixed effects in Equation (1), as they would be perfectly collinear with the expansion dummy). In these results, we always find that the share eligible is more positively associated with participation in expansion states, and is (without state fixed effects) negatively associated with participation in nonexpansion states.
Finally, in Section 1 (referenced earlier) of the Online Appendix we show our results are not sensitive to the distance window we use. We obtain positive estimates (for all outcomes save 2016 turnout) when rerunning our results within 600, 400, 200, 100, 50, and 10 miles of the border, and the estimates are always consistent with the results presented in the main text.Footnote 25
WHY DOES POLICY AFFECT POLITICS?
Our results reveal a positive effect of expansions on voter registration in both 2016 and 2014, weaker evidence of a potential turnout effect in 2014, and a consistent lack of any impact on turnout in 2016. When effects do occur, they are always concentrated in counties with a high share of potentially eligible citizens. We find little or no impact on counties with a low share of potential eligibles. The effects we recover are also sensibly ordered; in high-eligibility expansion counties, the percentage of uninsured falls by roughly 10 percentage points, but the percentage who are registered only increases by as much as 3 percentage points. While we cannot infer precisely what fraction of those receiving Medicaid also registered from aggregate data, it seems clear that only some became registered as a consequence of the expansion of Medicaid. Moreover, while turnout appears to have increased in 2014 in high-eligibility counties located in expansion states, by 2016 there was no detectable impact on turnout in these same counties.
We theorized that the expansion of Medicaid could impact political participation through several channels. Identifying the specific mechanisms behind such effects is difficult given the myriad of influences at play (Green, Ha, and Bullock Reference Green, Ha and Bullock2010; Imai et al. Reference Imai, Keele, Tingley and Yamamoto2011; Campbell Reference Campbell2012), as well as our focus on county-level data; however, our results do offer suggestive evidence for adjudicating between mechanisms. One possibility, consistent with conventional accounts of policy feedback, is that the beneficiaries of expansion could become more involved because of either interpretive or resource effects. Our ability to distinguish between psychological and material effects is limited, but the results seem most consistent with the effects being due to the law’s built-in resource effects. Given that the effects are strongest for registration, it is plausible that those signing up for Medicaid were also encouraged to register to vote because of the connection to the existing NVRA legislation.
We cannot determine whether the increase is due to individual initiative or the actions of outside groups focusing on expansion states to enroll newly eligible beneficiaries (the nonprofit group Project Vote, for example, produced manuals titled Voter Registration & Affordable Care Act Enrollment: A Manual for Enrollment Assisters that were used by health care advocacy organizations (Hagan Reference Hagan2016)), but the patterns we find are consistent with the expansion increasing registration rates among newly eligible beneficiaries because of the ease of registering while enrolling for Medicaid. Not only do we find larger and more precisely estimated impacts on registration compared to voter turnout, but we also only find a long-term effect (i.e., in both post-expansion elections) for registration. The persistence of a registration effect is to be expected given that registering to vote makes one eligible for multiple election cycles. Indeed, the increase in registration between 2016 and 2012 is entirely driven by the surge in registration that occurs between 2010 and 2014: Section 6 of the Online Appendix shows there is no impact on changes in registration between 2014 and 2016.
We cannot conclusively rule out interpretive effects, but it would seem that any such effects were not strong enough to cause a notable, persistent increase in turnout among the beneficiaries motivated to protect the expansion of Medicaid or the ACA. Moreover, the fact that the estimated turnout effect in 2014 was similarly sized to the estimated effect on registration suggests that individuals other than the newly registered were also likely mobilized by the election (as it seems implausible that every new registrant voted). While the effect on turnout we document in the 2014 midterm election immediately followed the expansion of Medicaid, it is notable that there is no effect on turnout in the 2016 presidential election despite the presence of a Republican candidate promising to repeal and replace the law that created the expansion. The lack of increased participation during an election in which the program was under threat suggests that the beneficiaries were not sufficiently aware of, or motivated by, potential threats to the program. Neither possibility suggests the existence of a constituency invested in the protection of the policy—perhaps because the ACA increased insurance coverage through state-run Medicaid programs that may have consequently obscured the connection between the ACA and the expansion of Medicaid.
Given the partisan environment surrounding the ACA and the expansion of Medicaid in the states, another important possibility is that the expansions could have mobilized opponents of the ACA. While mobilization could occur either in nonexpansion states or within expansion states themselves, the fact that the political impacts we detect occur in high-eligibility counties located in expansion states is hard to reconcile with the possibility that the expansion of Medicaid resulted in more policy blowback than policy feedback. If opponents in nonexpansion states were mobilized, we should see a null or negative impact of expansion (because relative to nonexpansion states, expansion states would see less participation). If opponents in expansion states were mobilized, we should see larger impacts in counties with a low share of potential eligibles, given that the opposition to the expansion was concentrated among the wealthy; we see the opposite. Further, the impacts are strongest for voter registration, and it is likely that opponents, being wealthier and already insured, are also more likely to be already registered to vote.
To be thorough, in Section 12 of the Online Appendix we replicate the results separately for Republican-leaning counties—those below the median on Democratic vote share in the 2012 presidential elections—and Democratic-leaning counties—those above the median. The interactive effect on share uninsured replicates in both sets of counties; the interactive effect on participation replicates primarily in Democratic-leaning counties; and there is a main effect, but not an interactive effect, for Republican-leaning counties in 2014.Footnote 26 Thus while we cannot rule out the possibility that opponents were mobilized—especially in the 2014 midterm election—we conclude that such effects are generally smaller than those we find for beneficiaries.
CONCLUSION
Does policy affect politics? This is a longstanding question with important implications for why some social policies persist, for the potential for new social policies to survive repeal attempts, and for political inequality. It has also been a difficult question to answer, especially for means-tested programs where eligibility often depends on the very same factors thought to be related to political participation. Given that prior work has focused on policies over which the political parties largely agree, it is also unclear whether the surrounding partisan environment affects the ability of policies to create positive policy feedbacks.
We focus on the political consequences of Medicaid expansions in the states, expansions provided for by the ACA. The ACA is arguably the most impactful social welfare program since the 1935 Social Security Act, and it is also unprecedented in the extent to which it has been politicized. We leverage this politicization, both as a way to explore feedback effects in hyperpartisan times, as well as a way to rule out confounding factors. Using state-level variation in policy implementation resulting from the Supreme Court’s decision in National Federation of Independent Business v. Sebelius provides a unique opportunity to identify the effects of social policies, as it enables us to compare otherwise similar counties facing radically different policy environments.
Our investigation reveals a qualified political impact of Medicaid expansion, one that is concentrated among potential beneficiaries. The largest political impacts are located in the counties with the highest percentage of eligible citizens in expansion states—the same set of counties in which we find the largest increase in the percentage of insured residents as a consequence of Medicaid expansion. Even so, the effects are limited; the largest, most persistent effects are observed for voter registration. While we typically find positive and substantively large impacts on turnout in 2014 relative to 2010, these estimates are usually less precise, and we never find evidence of turnout effects in 2016 relative to 2012. We conclude that any feedback effects have, so far at least, been primarily limited to an increase in voter registration, and that any impacts on turnout have been weaker and less consistent.
While finding the existence of positive policy feedback for such a substantively consequential and politically divisive policy is important for understanding the interactions between politics and policy, we are unable to definitively identify the exact mechanism that results in greater participation. Theories of policy feedbacks distinguish between resource effects—the financial and civic resources that programs provide—and interpretive effects—the messages that participants receive about their place in the political system. While the fact that the largest increase is in terms of voter registration—a process that is directly related to Medicaid enrollment because of the NVRA—speaks in favor of a resource-based explanation, the magnitude of the turnout effect we document in 2014 suggests that interpretive effects may also have been relevant in the short-term. Even though public health insurance has been shown to have its strongest impacts on financial security—stronger even than its impact on actual health—the magnitude of our effects would seem to speak against a strictly resource-based interpretation. In our data, a one-standard deviation increase in county median income (about $11,000)- is associated with a 1.7-point increase in voter turnout—an effect that is roughly half of the effect we estimate occurs in high-eligibility counties in 2014.
Also beyond the scope of our investigation is the impact of the expansion on mass opinions and policy outcomes. That said, there is reason to suspect that the expansion may not have strong and enduring partisan consequences. Not only does existing work show that the increased participation of lower socioeconomic groups has unclear partisan consequences (e.g., Wolfinger and Rosenstone 1980), but the fact that Medicaid expansion was sometimes implemented by Republican governors (e.g, Arkansas) or significantly rebranded by Democratic governors (e.g., Kentucky) may lessen the partisan connections. Recent work also suggests that perceptions about the ACA’s impact differs by individual partisanship, suggesting that partisan affinity may also impact the effect of Medicaid expansion on how votes are cast (McCabe Reference McCabe2016).
It is difficult to speculate as to what the impacts we identify portend for the future of the policy itself. While the inability of the policy to produce a mobilized constituency even when the program is under explicit threat appears problematic for the long-term existence of the policy, results at the state level suggest that the relationship between mobilization levels and policy outcomes is more uncertain. For instance, despite witnessing one of the most successful and impactful expansions, Kentucky voters in 2015 elected Republican Matt Bevin, a candidate who explicitly campaigned on repealing the ACA and rolling back the expansion of Medicaid (Brill Reference Brill2015). Despite being elected on promises to do so, however, Bevin has yet to fully roll back the expansion of Medicaid in the state (Newkirk Reference Newkirk2017).
The relationship between policy and politics is critical for understanding not only the demand for lawmaking action, but also the persistence of existing policies. To the extent that public policies create invested constituencies of beneficiaries, understanding the causes and consequences of lawmaking requires studying both the actions of elected officials as well as the impact of the surrounding electoral environment. Such investigations are involved, complicated, and often hard to conduct given the pervasive connections that make identifying the impacts of each difficult. Fortunately, we are sometimes provided with circumstances that enable us to untangle such connections, and the expansion of Medicaid, as provided for by the ACA, is both a substantively important and a methodologically exemplary case.
SUPPLEMENTARY MATERIALS
To view supplementary material for this article, please visit https://doi.org/10.1017/S0003055417000430.
Replication materials can be found on dataverse at https://doi.org/10.7910/DVN/X0ZPH4.




Comments
No Comments have been published for this article.