

Observed scores of latent traits are derived from true scores and measurement error (Spearman, Reference Spearman1904). When Spearman penned his immutable theory, the mantra of modern psychometrics was born, challenging researchers to continually strive to reduce measurement error. To this end, a variety of methods have been employed, including standardised administration and rigorous statistical evaluation of measures. Others have taken the opposite approach, pausing to consider what meaning may lie within the error itself. One such area of interest to psychometricians is acquiescence response bias, and the current study considers acquiescence and considers what role education may play in this source of measurement ‘error’.
Acquiescence is the tendency of an individual to consistently agree to questionnaire items, irrespective of item directionality (Jackson & Messick, Reference Jackson and Messick1965; Javeline, Reference Javeline1999). Acquiescence's less agreeable cousin (termed counter-acquiescence) creates the opposite pattern of response, with a tendency towards disagreement regardless of item directionality. Acquiescence is problematic for both researchers and clinicians, introducing a source of error into the measurement of the construct of interest that varies within individuals (Rammstedt & Farmer, Reference Rammstedt and Farmer2013). A pattern of responses that leads an individual to be biased towards the upper or lower end of a measurement scale challenges the validity of the measure. For clinicians, an inaccurate measure may negatively affect client outcomes, while researchers may draw inaccurate conclusions from research using measures confounded by acquiescence.
There are two conflicting positions in regard to acquiescence. The traditional position holds that acquiescence is an artefact of little interest, confounding the measured constructs with error that is best removed or controlled for (Nunnally, Reference Nunnally1978). Other researchers consider acquiescence to be a trait worthy of further investigation within the context of individual differences — a trait that maintains a certain degree of stability, consistency, and generalisability across settings (Eysenck & Eysenck, Reference Eysenck and Eysenck1963; Morf & Jackson, Reference Morf and Jackson1972).
As a trait, acquiescence is both temporally stable (Billiet & Davidov, Reference Billiet and Davidov2008) and able to significantly alter the covariance of item pairs, irrespective of item content (Bentler, Jackson, & Messick, Reference Bentler, Jackson and Messick1971; McCrae, Herbst, & Costa, Reference McCrae, Herbst, Costa, Riemann, Spinath and Ostendorf2001). The confounding effect of acquiescence on both predictor and outcome variables can lead to inflated predictive validity (Rammstedt & Farmer, Reference Rammstedt and Farmer2013). To a certain extent, the effect of acquiescence is somewhat mitigated by scales that contain balanced numbers of positively and negatively worded items; however, researchers disagree as to the true effectiveness of balanced item sets in controlling for acquiescence (Sonderen, Sanderman, & Coyne, Reference Sonderen, Sanderman and Coyne2013). Acquiescence has been shown to account for up to 10% of the variance in factor structures (Hendriks, Reference Hendriks1997; ten Berge & Hofstee, Reference ten Berge and Hofstee1999).
Meisenberg and Williams (Reference Meisenberg and Williams2008) conducted a large, cross-cultural study into acquiescence at both the individual and country level. At the individual level, acquiescence was greatest in older individuals, those with less education, and those from low socio-economic backgrounds. At the country level, higher acquiescence was also associated with lower intelligence, corruption, and lack of political freedom and democracy. It was suggested that acquiescence was facilitated by a lack of self-confidence or assertiveness and the desire to comply, rather than directly by intelligence. Given the somewhat circular relationship between intelligence and education (Hatch, Feinstein, Link, Wadsworth, & Richards, Reference Hatch, Feinstein, Link, Wadsworth and Richards2007), the mechanism by which acquiescence operates is not yet fully understood. Increased academic achievement may foster traits such as confidence (Stankov & Lee, Reference Stankov and Lee2014), resulting in a lower tendency to acquiesce.
Several studies have shown a relationship between education and acquiescence. Rammstedt, Goldberg, and Borg (Reference Rammstedt, Goldberg and Borg2010) found that acquiescence bias was worse in lower education groups, and that a five-factor model of personality was considerably less well defined in the lower group. After accounting for acquiescence, the structure emerged equally well in the lower and higher education groups, although it should be noted that the study only considered secondary education levels. Specifically, the study compared only those who had completed lower secondary school; those with intermediate secondary school education; and higher secondary education, including those with university entrance qualifications.
To investigate whether acquiescence was related to reading comprehension, Rammstedt and Kemper (Reference Rammstedt and Kemper2011) conducted a study using an instrument presented verbally. A consistent pattern of acquiescence was demonstrated, with larger variance evident in the lower education group. This is consistent with the findings of Meisenberg and Williams (Reference Meisenberg and Williams2008), who suggested that intelligence was not directly implicated in acquiescence. These results support the suggestion that acquiescence is more than simply measurement error that may have resulted from difficulties in reading comprehension or intelligence.
While education has been shown to play a role in acquiescence, it is worth considering the extent to which age may confound educational achievement. Acquiescence has been shown to decrease in absolute magnitude as age increased from 10 and 20 years (Soto, John, Gosling, & Potter, Reference Soto, John, Gosling and Potter2008), and this effect was independent of any item complexity due to word comprehension. When considering adult educational achievement within an Australian context, it is possible but highly unlikely that many individuals would have completed a higher degree such as a doctor of philosophy before the age of 24 years (allowing 4 years for undergraduate study and 4 years for doctoral studies after completing school at age 17 years). When considering the highest level of education achieved, any impact of age cannot be simply ignored, given that higher levels of education are generally not able to be attained by younger adults. For this reason, any consideration of acquiescence and adult educational achievement would be best conducted after accounting for any variance explained by age alone.
The aim of the current study was to investigate the stability of age-corrected acquiescence in adults of differing educational achievements within an Australian context. It was expected that acquiescence would reduce as formal education increased. Similarly, it was expected that due to the confounding nature of acquiescence, the factor structure of a five-factor model of personality would emerge with greater clarity in higher educated individuals compared with those of lower levels of education.
Method
Participants
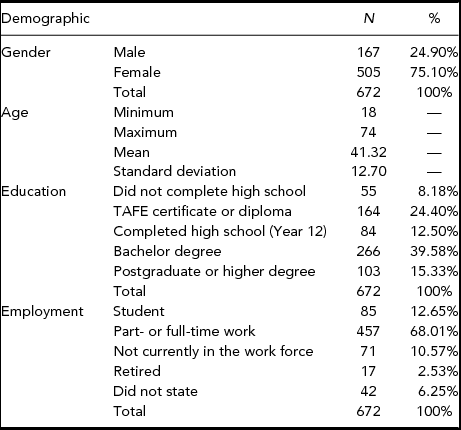
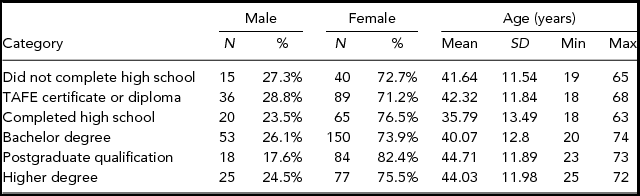
Online survey data were collected from 672 participants using a snowball method of recruiting. Participation was restricted to residents of Australia who were over the age of 18 years. The survey was collected with the approval of the Monash University Human Research Ethics Committee. The demographic distribution of the sample is provided in Table 1.
Demographic Details for Sample (N = 672)

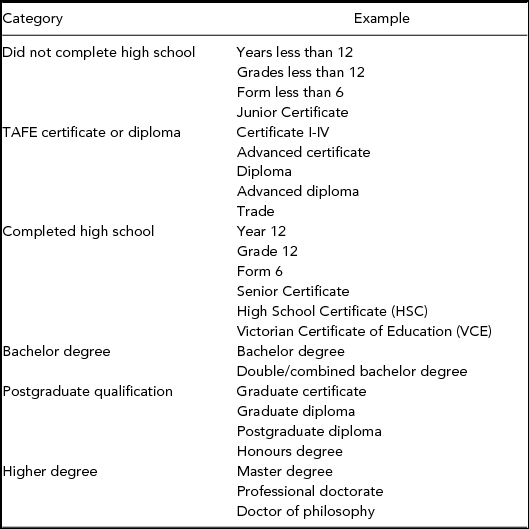
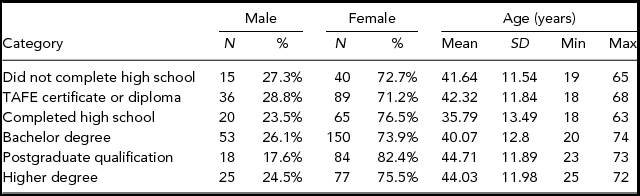
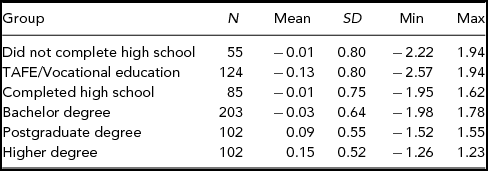
Details of participants’ self-reported highest education level attained were collected in free form, and recoded into five categories. Categorisation was conducted with the intent to maximise the equivalency within educational achievement groups in an Australian context. Categorising most levels of achievement, such as whether a participant had or had not completed high school, was straightforward, differing primarily in the language used (such as year or grade) and geographical differences (such as High School Certificate or Victorian Certificate of Education for New South Wales and Victoria respectively). Vocational and technical qualifications completed through Technical and Further Education (TAFE) training were combined in one category. Examples of the educational achievements by category are provided in Table 2, and the descriptive statistics of the categories are provided in Table 3.
Examples of Education Groups
Note: TAFE = Technical and Further Education.
Descriptive Statistics by Education Group
Materials
The Big Five Inventory (BFI; John, Naumann, & Soto, Reference John, Naumann, Soto, John, Robins and Pervin2008) was used to obtain personality self-reports. The 44 BFI items are short, easy to understand phrases that assess personality traits related to each of the Big Five factors of personality: Extraversion, Agreeableness, Conscientiousness, Neuroticism, and Openness to Experience. The BFI scales have shown substantial internal consistency, retest reliability, and clear factor structure, as well as considerable convergent and discriminant validity with longer Big Five measures, and substantial agreement between self and peer reports (Rammstedt & John, Reference Rammstedt and John2007). Each item was rated on a scale ranging from 1 (strongly disagree) to 7 (strongly agree).
Procedures
With the exception of the targeted rotation for the five factor model fit, all statistical analyses were conducted using SPSS version 22. Prior to any analysis, the data was screened for missing and extreme values. Imputation of missing values was conducted using the SPSS expectation-maximisation (EM) imputation algorithm, which uses a maximum likelihood approach to iteratively generate values using a normal distribution (Little & Rubin, Reference Little and Rubin2002; Pigott, Reference Pigott2001). The extent of missing data was minimal, with a mean rate of missing data of 1.06% across all items, and no item missing more than 1.9%. No significant difference was obtained between variable means both before and after applying the EM imputation method (Little's MCAR χ2 = 1.346, df = 1.371, p = .68), and therefore it was concluded there was no pattern for the missing data.
Hofstee, ten Berge, and Hendriks (Reference Hofstee, ten Berge and Hendriks1998) described a method of determining individual acquiescence scores, using logically and semantically opposite pairs of items, and taking the grand average of each individual's responses over the set, expressed as a deviation from the midpoint score. Consider the semantic pair ‘bfi1 (talkative) – bfi21 (quiet)’, and an individual who might score them 2 and 7 respectively. Acquiescence was taken to be the deviation of the sum of scores from 8 (as the scale midpoint was 4), therefore 8-(2+7) = -1, indicating a slight tendency to acquiesce for that item pair. The acquiescence score of each individual participant would represent an unweighted mean over the pairs of items. Soto et al. (Reference Soto, John, Gosling and Potter2008) identified 16 opposing item pairs within the BFI, and these item pairs were used to estimate acquiescence. Using an acquiescence score that is anchored at the scale midpoint, negative scores indicate the presence of acquiescence while positive scores indicate the presence of counter-acquiescence.
Results
Calculating Acquiescence
To evaluate the appropriateness of the opposing item pairs for determining acquiescence, bivariate correlations between pairs were calculated. A minimum correlation score of -.316 (negative correlations expected due to item reversal) was established, which is 10% of the shared variance between items. Correlations between all item pairs exceeded -.316, p < .001, with the exception of item pair bfi30 (values artistic, aesthetic experiences) and bfi41 (has few artistic interests), which contained only 9% shared variance. Consequently, the total acquiescence score was calculated using 15 item pairs, rather than the 16 pairs identified by Soto et al. (Reference Soto, John, Gosling and Potter2008).
Hofstee et al. (Reference Hofstee, ten Berge and Hendriks1998) recommend that the reliability of acquiescence (as determined by coefficient alpha over the item pairs) needs to be high if the acquiescence score is to be meaningful. For each of the item pairs, acquiescence was taken to be the deviation of the sum of scores from 8 (as the midpoint of the scale was 4). Since 8 is a constant for all variables, there was no need to incorporate it into any computation of alpha, and a total score of 8 for any item pair can be interpreted as an absence of acquiescence. Coefficient alpha over the pairs of items was .78, suggesting that acquiescence was quite consistent over the 15 item pairs and that acquiescence could be considered a single factor.
Investigating Age and Acquiescence
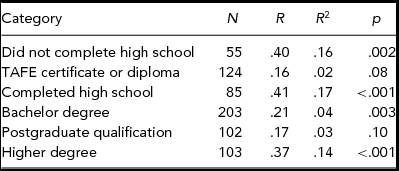
The relationship between age and acquiescence was considered. A bivariate correlation between age and acquiescence revealed a significant positive relationship (R = .27, p < .001), suggesting that acquiescence reduces with age. Bivariate correlations were then calculated for age and acquiescence for each level of education achievement group separately. Each relationship was significant, and the results demonstrated a clear interaction between age and level of education achievement group. The results of the correlations are presented in Table 4.
Correlations Between Age and Acquiescence by Level of Education Group
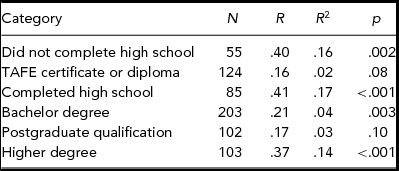
Participant age explained a significant amount of variance, particularly in the lowest and highest education achievement groups. Given that age acts as a confounding variable in educational achievement, the decision was made to regress participants’ acquiescence scores on age, leaving the remaining unstandardised residuals as a measure of acquiescence free from any relationship with age.
Individual Differences in Acquiescence
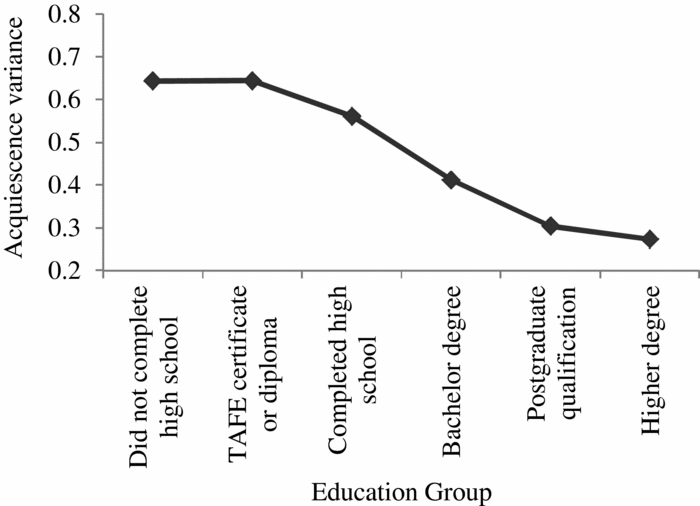
Previous research suggests that level of education achievement is related to individual differences in acquiescence. This was investigated in the current study by comparing age-residualised acquiescence scores across six levels of educational achievement. As expected, variance in acquiescence scores was larger in lower education groups, and demonstrated a consistent trend towards lower acquiescence scores with increasing levels of educational achievement. Levene's test for the equality of variances was significant, F(5, 665) = 5.25, p < .001, providing further support for the differences in variance across levels of education (see Figure 1).
Variance in acquiescence scores by level of education group.
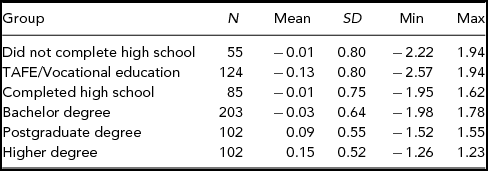
A oneway analysis of variance (ANOVA) was conducted for acquiescence and education group, and a significant difference was noted with F(5, 665) = 2.36, p = .04. Given that Levene's test was significant, post-hoc analyses were conducted using the Games-Howell test, which accounts for unequal variances. The only significant mean difference in acquiescence was between the TAFE (M = -0.13, SD = 0.80) and higher degrees groups (M = 0.15, SD = 0.52), with the TAFE group demonstrating higher levels of acquiescence than the higher degrees group, p = .02, d = -.41, 95% CI [-.31,-.55], which was a small-to-moderate effect size according to Cohen (Reference Cohen1992). The descriptive statistics are presented in Table 5.
Mean Acquiescence Scores by Education Group
Factor Structure in Education Groups
To investigate the extent to which acquiescence impacts the factorial validity of the BFI, participants were separated into two groups. The lower education group included participants who had not completed high school, completed TAFE or vocational studies, and those who completed high school. The higher education group included those who had completed bachelor degrees and higher qualifications. The lower group contained 71 males and 194 females (mean age 40.08 years, SD 12.64) while the higher group contained 96 males and 311 females (mean age 42.22 years, SD 12.53).
To be consistent with previous research conducted using the BFI, principal components analysis with Varimax rotation was conducted for each group. Procrustes rotation to an ideal a priori structure was used (Hopwood & Donnellan, Reference Hopwood and Donnellan2010; McCrae, Zonderman, Costa, Bond, & Paunonen, Reference McCrae, Zonderman, Costa, Bond and Paunonen1996), which compares the rotated solution to an ideal matrix where items either load completely or not at all, providing an estimate of how well items fit. Kaiser-Meyer-Olkin values of .846 and .897 for the lower and higher groups respectively (Kaiser, Reference Kaiser1970, Reference Kaiser1974), and significant Bartlett's Test of Sphericity (Bartlett, Reference Bartlett1954) results supported the factorability of the correlation matrix. Cattell's (Reference Catell1966) scree test and Parallel Analysis (Watkins, Reference Watkins2000) suggested that up to six components could be retained; however, in accordance with personality theory only five components were extracted.
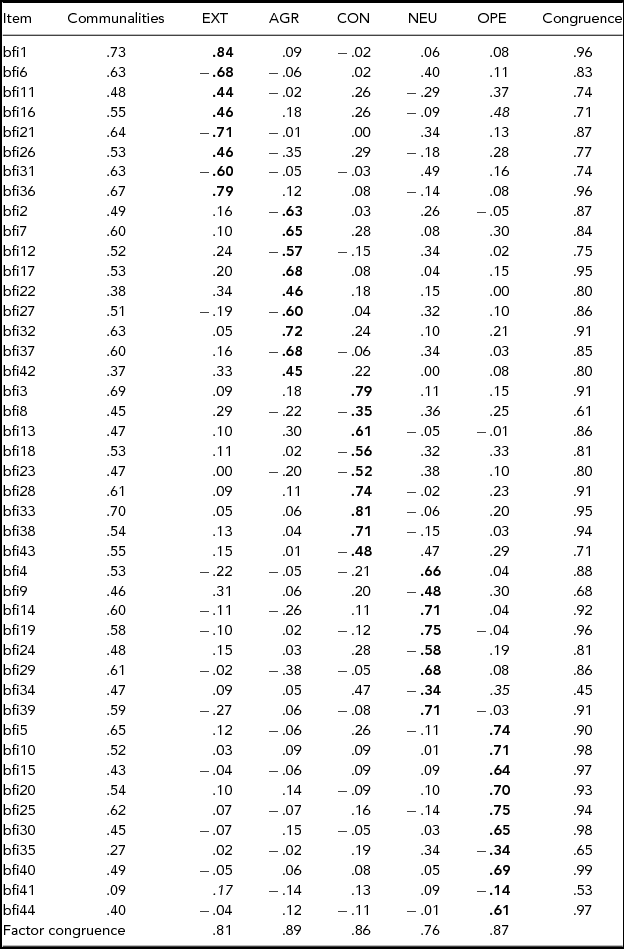
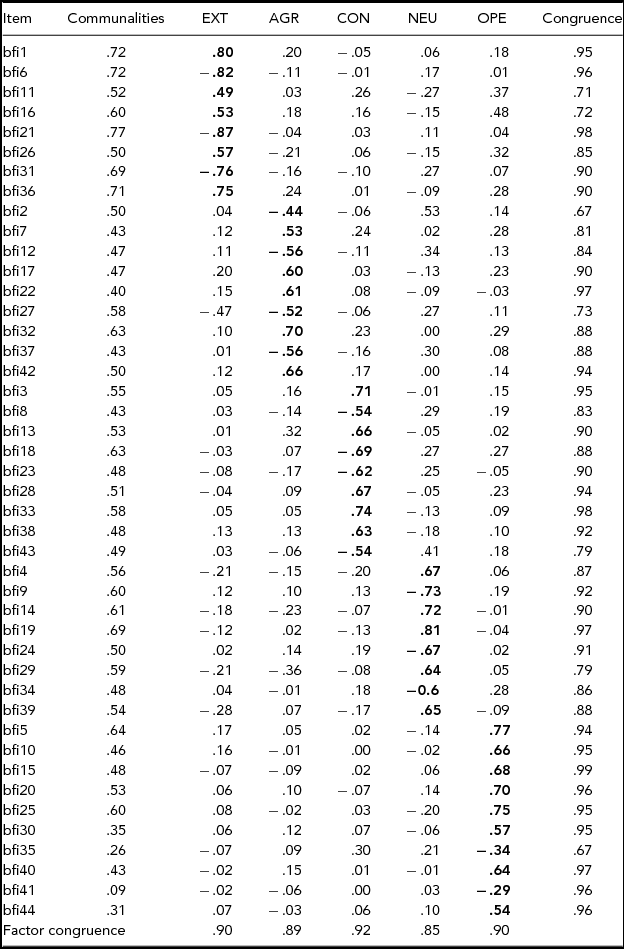
The five-factor models explained 52.61% and 52.69% of the variance in the data for the lower and higher groups respectively. Following Procrustes rotation using Orthosim version 2.01 (Barrett, Reference Barrett2006), the overall model fit was .84 for the lower group and .89 for the higher group. Factor level congruences were also considerably better for the higher education group, with the facets of Extraversion and Neuroticism demonstrating the highest increase. At the item level, the lower education group had 13 items with less than adequate congruence, while the higher education had 7 items. While item level congruences can be somewhat lower, factor congruence and overall congruence values of .85 and above indicate similarity between the actual factor matrix and the hypothesised ideal factor matrix (Barrett, Reference Barrett and Beauducel2005; Hastie, Tibshirani, & Friedman, Reference Hastie, Tibshirani and Friedman2009; Mulaik, Reference Mulaik1972; ten Berge, Reference ten Berge1986). The communalities, loadings, and congruences can be found in Tables 6 and 7.
PCA With Varimax and Procrustes Congruences for Lower Education Group (N = 265)
Note: Theorised primary loadings are bolded; where an actual primary loading differs it has been italicised.
PCA with Varimax and Procrustes Congruences for Higher Education Group (N = 407)
Note: Theorised primary loadings are bolded.
Discussion
The aim of the study was to investigate the role of education in trait acquiescence. Given that participants’ highest level of education achieved was confounded by age, acquiescence was considered after the effects of age had been controlled. As level of education increased, the variance in acquiescence reduced, with the most noticeable change occurring between TAFE education (such as certificates, diplomas and trade qualifications) and postgraduate qualifications (such as postgraduate diplomas and honour degrees). As expected, when the factor structure of the BFI was compared between the lower and higher educational achievement groups, poorer model fit, factor congruence, and item congruence was noted in the lower group compared to the higher group.
Soto et al. (Reference Soto, John, Gosling and Potter2008) investigated the change in acquiescence from 10 to 20 years of age and found that acquiescence variance reduced with age. In comparison, the current study found that while age did significantly correlate with acquiescence, only 7.29% of the variance was shared overall. The age-acquiescence variance differed across educational achievement groups, and the removal of age-related variance allowed for a more thorough investigation of the influence of education alone. While Soto et al. found a relationship between age and acquiescence, the current study demonstrated that age contributed relatively little to acquiescence, and after the removal of the influence of age, education continued to play a significant role in acquiescence.
With the current study, increases in formal education were associated with a decrease in the absolute magnitude of acquiescence variance. The most notable decrease occurred between completion of high school and postgraduate levels. There was a marginal increase between those who had not completed high school and those who had completed a TAFE qualification, and further increases in education led to a reduction in acquiescence variance. The trend towards a reduction in variance slowed as education progressed beyond bachelor to postgraduate degrees, which offers valuable insight into the impact of education on acquiescence. The change in trend suggests that there may be some inherent ceiling effect in the relationship between acquiescence and education. This reduction in variance doubtlessly contributed to the difference in model fit between the lower and higher education groups, demonstrating an inherent risk in the use of highly educated samples in psychometric research.
Interestingly, there was very little difference in mean acquiescence scores found across educational groups. Given that the mean acquiescence scores deviated little from zero, this suggests that there is no real tendency towards a prevalence of acquiescence or counter-acquiescence across groups. While a significant mean difference was noted between the TAFE group and higher degree group, the implications for this difference are only likely to be evident when administering an instrument developed and validated solely in one of these populations for the other. For example, an instrument with balanced positive and negative items that was developed for use in a higher degree population (who have a slight tendency to counter-acquiesce) will likely demonstrate inflated mean results in a TAFE population (who have a slight tendency to acquiesce).
The factorial validity of the BFI was shown to be less in the lower education group compared to the higher group. This is consistent with previous research by Rammstedt et al. (Reference Rammstedt, Goldberg and Borg2010), who found that the hypothesised Big Five factor structure emerged well in samples with university entrance qualifications and higher, and poorly in samples of lower education. In the current study, the overall fit of the lower education group to the hypothesised model was marginal at best, with a high number of items demonstrating poor fit. The higher education group demonstrated much better fit to the hypothesised model despite the confounding influence of acquiescence in the data. This demonstrates the risk posed by psychometric validation of instruments using samples drawn from higher educated populations — when variables such as response bias are not accounted for, even a robust and well validated instrument such as the BFI will not necessarily perform as intended. The results of the lower education group in the current study are likely to be inflated, given that the group also included individuals who had completed high school. Due to sample size limitations, it was deemed necessary to include those who had completed high school in this group; however, it is likely that had the sample size been sufficient and a qualitatively different lower group able to be selected, the factorial validity would have been even lower.
Is the difference in variance between educational groups actually due to underlying differences in cognitive abilities rather than education? It is beyond the scope of this study to comment definitively; however, some discussion is warranted. Early research by Messick and Frederiksen (Reference Messick and Frederiksen1958) found that the relationship between acquiescence and education was moderated by reading ability. To investigate this further, Rammstedt and Kemper (Reference Rammstedt and Kemper2011) tested acquiescence using a verbally administered version of the BFI to eliminate any effects of reading ability. Acquiescence was found to be larger in both magnitude and variance in the lower education group compared to the higher education group, which was consistent with the results in the current study, suggesting that reading ability does not play a substantial role in acquiescence. Hatch et al. (Reference Hatch, Feinstein, Link, Wadsworth and Richards2007) suggested that there was a somewhat circular relationship between cognitive abilities and educational achievement, and from the perspective of psychometric investigations, the fact that a relationship between educational achievement and acquiescence has been identified may serve as a functional explanation at this time. However, the extent to which acquiescence may be shaped by education or cognitive ability is not able to be inferred from the current study.
One of the challenges with determining a value for acquiescence is the influence of differences in item-pair responses, which is derived from meaningful differences between items within a construct. For example, an individual's acquiescence score of -1 for one item-pair may suggest a tendency to acquiesce, or it may reflect a meaningful difference on items within that construct. To a considerable extent, this was managed in the current study through the averaging of 15 pairs of opposing items, which was found to form a reliable measure of acquiescence. However, the extent to which meaningful construct differences confound a nested measure of acquiescence is yet to be quantified.
Quantifying educational achievement remains a challenge for researchers. Within the current sample, slightly more than 12% of the participants stated that they were students, and for this subset, the highest educational level attained does not necessarily reflect the highest level that will be attained in the future. Similarly, the current highest level of education attained is not a limiting factor of potential achievement for any participant. If formal education itself plays a role in shaping acquiescence, we believe that any confounding impact of including students was at least minimal in the current study, given the relatively small number of participants who indicated that they were currently studying.
The order in which educational achievement groups were presented is worthy of further comment. It is a challenging concept to accept that education can be agglomerated in a manner that depicts a linear progression from lower to higher levels. For example, the time taken to achieve similar educational standards may vary considerably, such as the student who undertakes a double degree part time over a number of years, compared to the diligent student who completes a conventional degree within 3 years. Within the TAFE and vocational qualification group, courses may vary from several weeks up to 2 years, and therefore equivalency within the educational groups is somewhat limited. However, given the limited sample sizes so commonly encountered in research, it was necessary to apply some degree of agglomeration for the purposes of improving interpretability. Future research with access to larger samples may improve on this process, and aid in further understanding the impact of education on acquiescence.
Similarly, in the current study, the levels of education were separated into two groups to investigate the model fit of the BFI. Due to the current sample size, the groups were separated at the completion of secondary school level. Given the trend in acquiescence scores, it would have been preferable to investigate the model fit by comparing three or more education groups, with a more clearly defined lower education group. This is a limitation in the current study, and future research will seek to address this by investigating model fit across a more homogenous lower education group.
The implications of acquiescence affect both researchers and clinicians alike. For researchers engaged in the development of psychological assessment tools, the current study serves to highlight again the importance of developing scales that allow for the measurement of acquiescence, as well as highlighting the risk to generalisability of research that has focused on more highly educated populations such as university students. The extent to which constructs are confounded by acquiescence varies across levels of education, and what may operate as a sound measure in a highly educated population may be considerably less valid in a different population. For clinicians, the knowledge that education plays a discrete and measurable role in response style can be used to better aid interpretation of psychological instruments. The results of the current study may serve to highlight risk factors that challenge the validity of an instrument; specifically, the education of the instrument rater.
The tendency to agree or disagree with questionnaire items regardless of directionality or content has been shown to be a reliable individual difference that is related to formal education, although the exact mechanism remains unclear. As formal education increases, acquiescence decreases, becoming less problematic and demonstrating some evidence of a ceiling effect in individuals who have reached a postgraduate level of education. For this knowledge to be of use, researchers are challenged to consider the use of appropriate item-pairs in instruments so as to allow for individual acquiescence scores to be calculated. Building on this practice will allow for greater evaluation and better practices in interpretation, perhaps through controlling or removal of acquiescence prior to calculating normative values for clinical use. In the immediate absence of such values, clinicians are challenged to ensure that they are aware of client educational achievement as a screen for likelihood of exhibiting response bias.
Financial Support
This research received no specific grant from any funding agency, commercial, or not-for-profit sectors. The data used in this research was collected in the course of a Doctor of Philosophy program, for which the first author receives an Australian Postgraduate Award scholarship.
Conflicts of Interest
None.
Ethical Standards
The authors assert that all procedures contributing to this work comply with the ethical standards of the relevant national and institutional committees on human experimentation and with the Helsinki Declaration of 1975, as revised in 2008.