Introduction
Plastic waste has become a global problem due to its persistence in the environment, especially marine ecosystems. Approximately 99% of plastics are produced from non-renewable resources, including coal, petroleum, and natural gas (Censi et al. Reference Censi, Saiano, Bongiorno, Indelicato, Napoli and Piazzese2022). This material is widely used industrially in packaging production due its advantages, such as flexibility and degradability, which allow manufacturing flexible bags, packages, or rigid containers in various shapes and sizes (Oyervides-Muñoz et al. Reference Oyervides-Muñoz, Oyervides-Muñoz and Garcia-Lobato2023). However, widespread use has led to severe environmental consequences, with humans producing an estimated 34 million tons of plastic annually (Shah et al. Reference Shah, Rajhans, Pandya and Mankad2021). Strict regulations are being introduced globally, driving the plastics industry towards a shift to more sustainable products and processes (Peydayesh et al. Reference Peydayesh, Bagnani and Mezzenga2021). One of the alternatives to reducing the impact of these materials on the environment is the use of bioplastics, which, due to their physical properties being similar to fossil-based polymers, can be used to manufacture various products (Atiwesh et al. Reference Atiwesh, Mikhael, Parrish, Banoub and Le2021; Costa et al. Reference Costa, Encarnação, Tavares, Todo Bom and Mateus2023).
Biopolymers and their derivatives are varied, plentiful, and important for life. They are increasingly important for various applications, and they have characteristics such as being natural renewable materials and many decompose naturally in the environment (Hassan et al. Reference Hassan, Bai and Dou2019). Important to note that all bioplastics are biopolymers, but not all biopolymers are considered bioplastics (Gamage et al. Reference Gamage, Thiviya, Liyanapathiranage, Wasana, Jayakodi, Bandara, Manamperi, Dassanayake, Evon, Merah and Madhujith2024). Bioplastics, therefore, form three broad groups of polymers: those that are both bio-based and biodegradable, those that are only bio-based, and those that are only biodegradable (Di Bartolo et al. Reference Di Bartolo, Infurna and Dintcheva2021; Endres Reference Endres, Wagemann and Tippkötter2017). According to the European Bioplastics Association bioplastics are biologically based material that may or may not be biodegradable and constituted, totally or partially, by renewable biomass (Ghasemlou et al. Reference Ghasemlou, Barrow and Adhikari2024). The European Bioplastics states that 43% of bioplastic production in 2023 was destined to produce packaging, which is the largest market segment within the bioplastics industry.
Among the advantages of using bioplastics is the environmental contribution of the material, since each ton of green polyethylene produced captures and fixes up to 2.5 tons of CO2 in the atmosphere, helping to reduce greenhouse gas emissions and prevent global warming (Braskem 2025). Information on the biological content of bioplastics is important as a market driver for these products entering the conventional plastics market. In addition, environmental decomposition criteria need to be established and disclosed to ensure the biodegradation capacity of these bioproducts for end users and consumers (Amaral et al. Reference Amaral, Borschiver and Vaz Morgado2019).
In Brazil, green polyethylene (PE) stands out in producing biopolymers. This material uses ethylene derived from sugarcane a raw material and is being widely integrated into the production of plastic packaging. The “I’m green” seal that identifies products manufactured using 51% green plastic in their composition (Braskem 2025). To obtain this seal, the manufacturer must submit the product to analysis following globally accepted standards such as ASTM D6866-24. The technique used is to quantify radiocarbon present in the sample to determine its biogenic fraction. Since oil is of fossil origin, formed more than 10 million years ago, it is considered radiocarbon-free. Bioplastic, made from sugar cane, has a modern concentration of radiocarbon. Therefore, the biogenic fraction is proportional to the amount of radiocarbon in the sample. In addition to the radiocarbon technique, it is possible to quantify the biogenic fraction of the bioplastic using isotope ratio mass spectrometry, where the carbon 13 value (δ13C) is analyzed. However, this technique is only possible when the bioplastic sources are from plants in the Hatch-Slack or C4 cycle (e.g., corn, sorghum, and sugarcane) (Rogers et al. Reference Rogers, Turnbull and Dahl2021; Santos et al. Reference Santos, Macario, Jou, Oliveira, Cardoso, Anjos and Alves2019). The isotopic values of δ13C in these plants vary, on average, between –10.0 to –15.0‰. Petroleum, which gives rise to fossil plastics, has δ13C values ranging from –25.0 to –30.0‰. With these differentiated values, it is possible to establish a mixing equation. From the δ13C measurement of the pure bioplastic and the pure fossil plastic, it is possible to determine the amount of each in the sample and establish the biogenic fraction (Wang et al. Reference Wang, Guo, Li and Wang2012).
Moreover, even though biopolymers have the “green” seal of biogenic origin, materials in circulation are still not inspected in Brazil, which does not prove that the discarded or circulating material is bioplastic. As the radiocarbon technique is considered more expensive than conventional mass spectrometry, an alternative to improve this scenario would be to use stable isotope analysis to determine the biogenic fraction of bioplastics depending on the photosynthetic pathway, as previously shown by Santos et al. (Reference Santos, Macario, Jou, Oliveira, Cardoso, Anjos and Alves2019).
The Laboratory for the Preparation of Samples for Radiocarbon Analysis called LAPA14C-UFBA, was recently installed at the Federal University of Bahia (UFBA) in the Northeast of Brazil, in partnership with the Radiocarbon Laboratory of the Fluminense Federal University (LAC-UFF), it is conducting intercomparison tests and sample preparation protocols implementation and the graphite samples are being measured at LAC-UFF Single Stage Accelerator Mass Spectrometry System (SSAMS; Santos et al. Reference Santos, Zucchi, Costa, Oliveira, Macario, Lopes, Santos, Azevedo and Gomes2025).
This study used two distinct methodologies to determine the biogenic fraction of the analyzed samples. These analyses were performed using the Elemental Analyzer- Coupled Isotope Ratio Mass Spectrometry (EA-IRMS) techniques for δ13C and Accelerator Mass Spectrometry (AMS) for 14C determination, which allow accurate and reliable measurements of the carbon isotopes present in the materials. The main focus of this work is to implement the sample preparation for the radiocarbon biogenic fraction determination in bioplastics at LAPA14C-UFBA and employ the isotopic ratio mass spectrometry method, as an alternative analysis of bioplastic materials from C4 plants, which may represent a lower-cost way to inspect these products.
Materials and methods
The samples selected for this study contained the seal “I’m green” or a “51% biogenic fraction” description on the packaging. The samples collected are from the metropolitan region of Salvador in Brazil and pertain to the 2023 production lot. All six samples analyzed were made of polyethylene (PE). Two samples were plastic tubes (T1 and T2), commonly used for storing cosmetic products, and were purchased in shops specializing in the sale of cosmetics. The other four samples (PB1, PB2, PB3 and PB4) were made up of plastic bags commonly used in establishments that sell food storage packaging. All selected samples have information on their labels that attests to the fact that they are bioplastics. In the case of plastic bags, the seal “I’m Green” provided by bioplastic companies indicates the material’s bio-based and sustainable origin. In turn, the tube-shaped packaging features an alternative seal indicating a raw material from the same origin.
The polyethylene samples were under a careful preparation process at the Stable Isotope Laboratory of the Physics Institute of the Federal University of Bahia (UFBA). This preparation process was essential to ensure that the analysis results were free from external interference, requiring rigorous physical pretreatment of all samples.
Initially, possible contaminants that could have adhered to the surface of the samples during transportation collection were removed. The samples were immersed in ultrapure water. After immersion, the samples were subjected to an ultrasonic bath, which generates high-frequency vibrations capable of effectively removing impurities adhered to the surface. This cleaning process was essential to eliminate any residues that could interfere with subsequent isotopic analyses.
Finally, after the cleaning procedure, the samples were subjected to an oven drying step (∼50°C), completely removing any trace of residual moisture. This drying method was performed under controlled conditions to avoid changes in the chemical or physical properties of the samples during preparation. These meticulous steps were essential to ensure that the data obtained accurately reflected the isotopic characteristics of the polyethylene samples analyzed.
AMS-14C
The sample preparation for radiocarbon analysis followed the procedures described in the reference studies by Jou et al. (Reference Jou, Macario, Carvalho, Dias, Brum, Cunha and Chanca2015) and Santos et al. (Reference Santos, Macario, Jou, Oliveira, Cardoso, Anjos and Alves2019), which detail methods widely accepted by the scientific community to ensure the quality and accuracy of the results obtained. The sample preparation steps were performed at LAPA14C-UFBA. The measurements of the radiocarbon content of the samples were carried out at the LAC-UFF.
For CO₂ conversion, 5 mg of material was used for each sample, inserted into vacuum-sealed quartz tubes containing preheated copper oxide (CuO) and silver wire (Ag). The tubes were then heated at 900°C for 3 hr to combust the samples (Macario et al Reference Macario, Oliveira, Carvalho, Santos, Xu, Chanca, Alves, Jou, Oliveira, Pereira, Moreira, Muniz, Linares, Gomes, Dos Anjos, Castro, Dos Anjos, Marques and Rodrigues2015). After CO2 conversion, the gas was purified in a vacuum system by means of cryogenic traps (Santos et al. Reference Santos, Zucchi, Costa, Oliveira, Macario, Lopes, Santos, Azevedo and Gomes2025). The CO2 graphitization is done through the zinc reduction method (Xu et al. Reference Xu, Trumbore, Zheng, Southon, McDuffee, Luttgen and Liu2007), where the CO2 is inserted into borosilicate tubes containing the reagents zinc (Zn) and titanium hydride (TiH), and a smaller tube inside containing iron (Fe) as catalyst, where the graphite will be formed. The tubes were vacuum sealed and heated at 550°C for 7 hr. The graphite obtained was pressed into aluminum cathodes and sent to LAC-UFF to be analyzed in the 250kV Single Stage Accelerator Mass Spectrometry System (SSAMS) from National Electrostatics Corporation (NEC). The results are expressed as pMC (percent Modern Carbon) corrected for the atmosphere of 1950 AD through the OXII standard (Stuiver and Polach Reference Stuiver and Polach1977).
For AMS, the biogenic fraction was determined using the percent Modern Carbon (pMC) according to the standard ASTM D6866-24. However, the actual pMC depends on the 14C atmospheric concentration of the year and the place of the vegetal source growth and has been decreasing since the maximum “bomb peak” in 1963–1964 (Hua et al. Reference Hua, Turnbull, Santos, Rakowski, Ancapichún, De Pol-Holz, Hammer, Lehman, Levin and Miller2021). In contrast, pMC for fossil-origin materials is assumed to be zero, as these matrices do not contain 14C atoms due to the half-life of the radioisotope compared to the geological scale.
For recent natural bio-based/plant-based material the 14C is well measurable with specific activity close to 100pMC. All pMC values have been adjusted by the current atmospheric correction factor, currently the correction factor is 1 according to ASTM D6866-24. The biogenic percent (%bio) can be obtained by Equation (1):
 $$\% bio = pMC$$
EA-IRMS (δ13C)
An elemental analyzer coupled to an isotope ratio mass spectrometer was used to determine the composition of the carbon 13C/12C ratio (δ13C) in the samples. The samples were directed to tin capsules inserted by the automatic sampler into the system (EA-IRMS) and to the combustion reactor maintained at 1020°C. A pulse of oxygen produces an exothermic reaction, reaching a temperature of approximately 1800°C. The gases formed in the process are transported by an ultrapure helium (He) flow and reduced by a copper (Cu) layer. The water resulting from the process is removed by a magnesium perchlorate (Cl₂MgO₈) filter. The gases are separated in a suitable chromatographic column, followed by the isotope ratio mass spectrometer, to determine the carbon-13 isotopic composition.
The biogenic fraction of the plastics can be determined through a two-component mixing model applied to the samples. This model measures the contribution of biogenic and petroleum-derived polyethylene (PE). Since the
 $\delta $
13C values of the matrix differ, the model can be used as an approximation for the biogenic fraction. The contributions of the samples are expressed as
 $$Fbio\; + Ffossil\; = \;1$$
By knowing the δ13C sources, the δ13C value of the sample can be defined by these components (Berto et al. Reference Berto, Rampazzo, Gion, Noventa, Ronchi, Traldi, Giorgi, Cicero and Giovanardi2017; Santos et al. Reference Santos, Macario, Jou, Oliveira, Cardoso, Anjos and Alves2019):
 $${\delta ^{13}}{C_{sample}} = {\delta ^{13}}{C_{bio}} \cdot Fbio\; + \;{\delta ^{13}}{C_{fossil}} \cdot Ffossil\;$$
Given the significant difference in 13C signatures between the matrices, this equation can also be used to determine the fraction from the sources. Using Equations (2) and (3), we obtain

In Equation (4), the biogenic and fossil sources are measured using the biogenic PE and petroleum-derived PE matrices.
Results and discussion
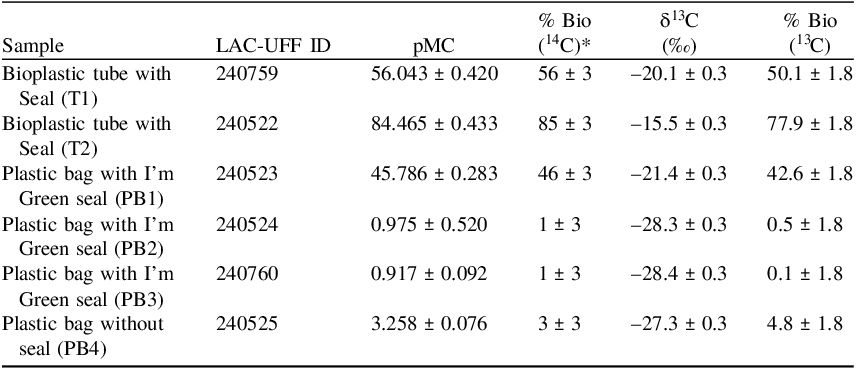
All the results were measured in AMS and EA-IRMS and are presented in Table 1. The results obtained for the AMS analysis show that the bioplastic tube (T2) presented a satisfactory biogenic fraction value for being considered bioplastic (> 80%). Regarding the plastic bags, it was possible to observe that all three samples analyzed presented values below 51%, contrasting the information on the packaging specifications for obtaining the “I’m green” seal. The values obtained indicate that most of the material’s composition is made of fossil material.
Modern fraction results and EA-IRMS results for collected plastics, the laboratory codes are provided by the (LAC-UFF)

Table 1 Long description
A table comparing bioplastic and plastic samples with various measurements. The table has six rows and six columns. The columns are labeled Sample, LAC-UFF ID, pMC, % Bio (14C), δ13C (‰), and % Bio (13C). The rows are labeled with different sample descriptions and their corresponding values. Row 1: Bioplastic tube with Seal (T1), 240759, 56.043 ± 0.420, 56 ± 3, -20.1 ± 0.3, 50.1 ± 1.8. Row 2: Bioplastic tube with Seal (T2), 240522, 84.465 ± 0.433, 85 ± 3, -15.5 ± 0.3, 77.9 ± 1.8. Row 3: Plastic bag with I'm Green seal (PB1), 240523, 45.786 ± 0.283, 46 ± 3, -21.4 ± 0.3, 42.6 ± 1.8. Row 4: Plastic bag with I'm Green seal (PB2), 240524, 0.975 ± 0.520, 1 ± 3, -28.3 ± 0.3, 0.5 ± 1.8. Row 5: Plastic bag with I'm Green seal (PB3), 240760, 0.917 ± 0.092, 1 ± 3, -28.4 ± 0.3, 0.1 ± 1.8. Row 6: Plastic bag without seal (PB4), 240525, 3.258 ± 0.076, 3 ± 3, -27.3 ± 0.3, 4.8 ± 1.8.
* The values for the biogenic fraction are the same as the pMC according to the standard, since the samples refer to the year 2023. Biogenic fraction errors were added according to the standard ASTM D6866-24 of ± 3.
The results obtained from the bio% by δ13C shown in Table 1 were calculated according to Equation (4), where the values of the biogenic and fossil matrices measured in the LAPA14C-UFBA laboratory were δ13Cbio = −12.5 ± 0.3‰ and δ13Cfossil = −28.9 ± 0.3‰ (primary material “I’m Green”).
The product must have a 51% biological fraction to obtain the “I’m green” seal. According to the δ13C analysis, only samples T1 and T2 presented satisfactory biogenic fraction results between 50% and 77% and could be considered bioplastic material. Only the plastic bags 1 analyzed presented a biogenic fraction value close to 50% after δ13C analysis, leading to the conclusion that most of the composition of these materials could be based on fossil material or other biobased material with non-expected δ13C signal.
In Table 1 the results of T2 (Bioplastic Seal) exhibit the highest biogenic fraction (84.5%), indicating a high content of renewable carbon. In contrast, Plastic Bags 2 and 3 (I’m Green Seal) show very low biogenic fractions (∼1%), suggesting that despite the label, they are primarily composed of fossil-based carbon. Plastic Bag 4 (No Seal) has a biogenic fraction of 3.3%, which remains relatively low. T1 (Bioplastic Seal) contains 56% biogenic material, above the 51% biogenic fraction expected according to I’m green.
The lack of specific and standardized regulations for the production of bioplastics in Brazil represents a significant challenge for the industry and researchers aiming to study these materials. This regulatory gap can allow potential changes to occur during the manufacturing process of different batches of bioplastics, which in turn can generate significant variations in the biogenic content of the final products. These variations directly affect the consistency and reliability of bioplastics as a sustainable alternative to conventional fossil-based plastics, compromising their efficiency in reducing environmental impacts.
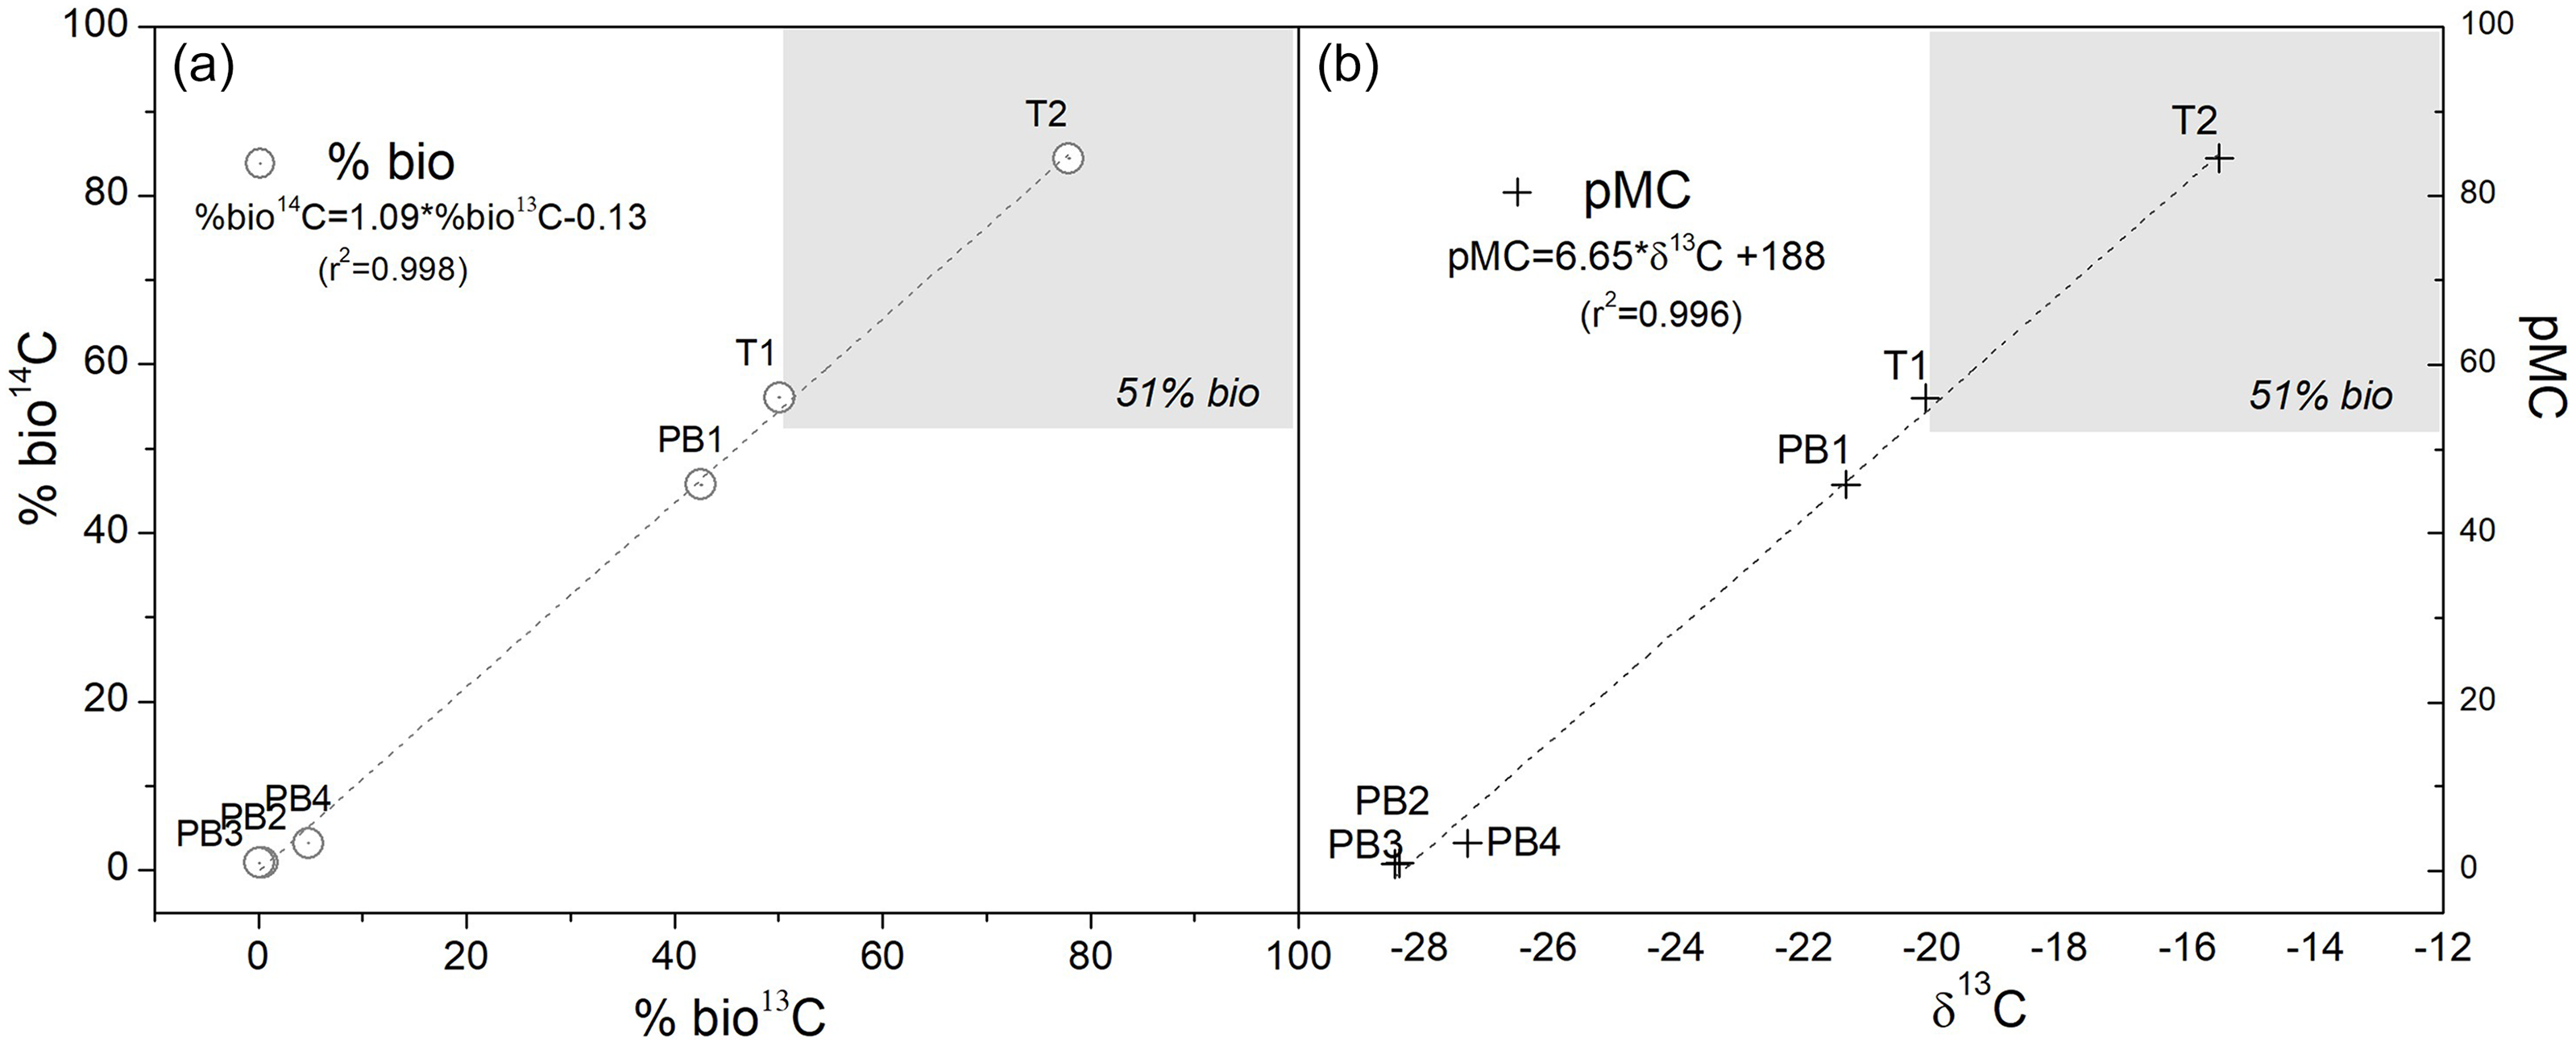
In Figure 1, the plot (a) illustrates the values in the graph exhibit a strong correlation with the equation %Bio14C = 1.09 * %Bio13C – 0.13, with a remarkably strong correlation coefficient (r2 = 0.998). Whereas the plot (b), shows the robust correlation indicates a clear relationship between radiocarbon content (pMC) and δ13C values, which the equation is pMC = 6.65 * δ13 C + 188, with a correlation coefficient (r2=0.996). These values are essential for assessing the proportion of biogenic carbon in the samples, further reinforcing the consistency and reliability of the data.
Correlation graphs of % bio14C versus % bio13C (a) and pMC versus δ13C (b). In both graphics, the horizontal dashed line is the biogenic fraction as specified by the current standard (ASTM D6866-24) and the vertical dashed line indicates the same fraction determined based on δ13C values.

It is possible to identify a linear relationship between the δ13C values obtained and the biogenic fraction values reported after AMS measurement, only when the sources are known. In the case of the sample described as Plastic Bag 4 exhibited divergent behavior compared to the other samples which can be due to the nature of its composition. According to the information on the product label, the sample did not have the “I’m Green” seal and did not confirm it is derived from C4 plants. Thus, the analysis performed using IRMS becomes inconclusive due to the specific characteristics of this sample. Nevertheless, since the AMS technique is expensive and is only applied to large producers, conventional spectrometry (EA-IRMS) can be considered an alternative for monitoring this product since its results could be equivalent depending on the renewable source to those found by AMS. Green polyethylene is the primary raw material used in the manufacture of these products. Sugarcane falls under the C4 plant classification, which makes the technique viable.
The δ13C, for example, is widely used to distinguish materials derived from plants with a C4 photosynthetic cycle from fossil sources. At the same time, the pMC indicates the percentage of recent carbon present in the material due to renewable sources. Thus, the joint analysis of these parameters provides a comprehensive view of the characteristics of the samples and the effectiveness of bioplastic production processes.
Therefore, implementing transparent and rigorous regulations for the production of bioplastics in Brazil is essential to minimize these variations and ensure that these materials truly represent a sustainable and reliable alternative in facing the environmental challenges related to the excessive use of conventional plastics.
Conclusions
With the increasing problem involving plastic waste, it is becoming increasingly important to encourage the use of bioplastics. Therefore, it is also necessary to monitor the products in circulation since, currently, only a single analysis is performed in Brazil to determine the biogenic fraction. Products manufactured after this analysis are not monitored, so it is impossible to confirm whether they are considered bioplastics. Among the samples analyzed in this study, the plastic bags did not obtain positive results, revealing initial inconsistencies between the labeling and the actual composition. The samples in tube form have the same manufacturer and presented positive results after analysis, which indicates that the company responsible for production is by the specifications and maintains production with a high percentage of biopolymer.
In sum, the implementation of the sample preparation for analyzing the radiocarbon biogenic fraction showed good results related to graphite produced at the Laboratory for the Preparation of Samples for Radiocarbon Analysis (LAPA14C-UFBA) LAPA14C-UFBA of the Federal University of Bahia (UFBA). All samples were measured at LAC-UFF and presented conclusive results, demonstrating the effectiveness of the sample preparation at LAPA14C-UFBA. Since the bioplastic manufactured in Brazil is derived from sugarcane, a C4 plant where δ13C values are different from those of petroleum-derived plastic, the analysis of δ13C by EA-IRMS, offers an efficient and cost-effective alternative for determining the biogenic fraction. The results showed a robust direct correlation (r2=0.996) between the fractions obtained by the two methods, indicating that δ13C analysis can be used, in this case, as an alternative and low cost approach to determining the biogenic fraction of plastics, when the sources are known. However, radiocarbon analysis is the best option because it is precise and does not depend on knowing the raw material sources of the samples, and it is the most widely used in the world to determine the biogenic fraction of the sample.
Acknowledgments
The authors would like to thank Brazilian financial agencies CNPq (National Council for Scientific and Technological Development), INCT-FNA, 464898/2014-5), FAPESB (Foundation for Research Support in the State of Bahia) (DCR n°0015/2024), the researchers from the Fluminense Federal University (UFF), the members of the postgraduate program in Petroleum Geochemistry and Environment (POSPETRO) and the members of the Laboratory of Applied Nuclear Physics (LFNA) who participated in the development of the work.