Introduction and geological setting
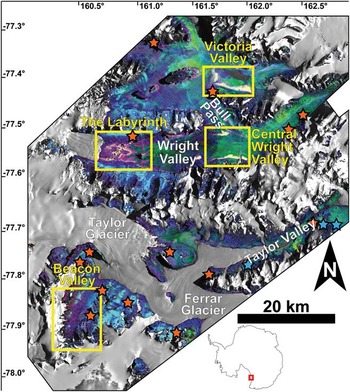
The McMurdo Dry Valleys (MDV) of Antarctica are a series of predominantly east–west trending valleys located c. 100 km to the north-west of McMurdo Station along the eastern flank of the Transantarctic Mountains (Fig. 1). The valleys are bordered to the west by the East Antarctic Ice Sheet and to the east by the Ross Sea and seasonal sea ice. The cold polar conditions and the glacioclimatic influences of the Transantarctic Mountains limit the mean annual water equivalent precipitation to < 50 mm yr-1, the majority of which is lost to sublimation prior to its incorporation in the local and regional hydrological system (Fountain et al. Reference Fountain, Nylen, Monaghan, Basagic and Bromwich2009). As a result of these hypo-thermal and hyper-arid conditions, the MDV are characterized by the absence of vascular vegetation and the abundance of coarse sediments, bedrock outcrops, and ephemeral meltwater channels originating from local alpine and outlet glaciers (Doran et al. Reference Doran, McKay, Clow, Dana, Fountain, Nylen and Lyons2002). Although subtle, the resulting differences in temperature and relative humidity produce local microclimatic variations that create diverse micro-, meso-, and macro-scale landforms (Marchant & Head Reference Marchant and Head III2007).
Spectral parameter map of the McMurdo Dry Valleys. Mafic band strength (MBS) is mapped in red, near-infrared (NIR) spectral slope is mapped in green, and the strength of the quartz emissivity peak is mapped in blue (Table III). Dark object subtraction and regression (DOS-R) locations are marked by orange stars, in situ spectral grid locations are marked by blue stars, and the locations of the four primary study regions in this work are outlined in yellow.

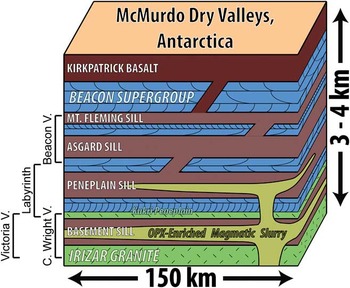
The valleys incise the Devonian-Triassic Beacon Supergroup, which are composed largely of sandstones, siltstones, and orthoquartzites, and the underlying Precambrian-Ordovician Granite Harbour Intrusives, composed of granites, granodiorites, gneisses, and orthogneisses (Isaac et al. Reference Isaac, Chinn, Edbrooke and Forsyth1995). Basaltic magmatism associated with the breakup of Gondwana at c. 180 Ma (Fleming et al. Reference Fleming, Heimann, Foland and Elliot1997) intruded both the Beacon Supergroup and the Granite Harbour Intrusives and was emplaced in four prominent sills (the Ferrar Dolerite) and as surficial basaltic flows (the Kirkpatrick Basalt) throughout the region (Elliot & Fleming Reference Elliot and Fleming2004, Marsh Reference Marsh2004) (Fig. 2). During emplacement, the magmatic system experienced crustal assimilation (Fleming et al. Reference Fleming, Foland and Elliot1995), complex differentiation processes (Bédard et al. Reference Bédard, Marsh, Hersum, Naslund and Mukasa2007), and multiple injections that delivered slurries of phenocryst-laden magmatic “mush” into the lowermost portions of the intrusions (Marsh Reference Marsh2004). Of the four major sills, the lower sills (Basement Sill and Peneplain Sill) exhibit the largest range of magmatic products and textures, whereas the upper sills (Asgard Sill and Mount Fleming Sill) are characterized by near-liquid compositions and largely sub-ophitic textures (Fleming et al. Reference Fleming, Foland and Elliot1995, Elliot & Fleming Reference Elliot and Fleming2004, Marsh Reference Marsh2004). The dolerites within the MDV are most closely related to the Mount Fazio chemical type (MFCT) lavas of north Victoria Land, which are characterized by intermediate Mg# (c. 40–50) and MgO contents (4.5–7.5 wt%), with higher values present where pyroxenes have accumulated (Fleming et al. Reference Fleming, Foland and Elliot1995). The emplacement, modification, and subsequent cooling of the Ferrar Dolerite has resulted in significant chemical and mineralogical variations, which can be identified in the well-exposed outcrops throughout the MDV (Marsh Reference Marsh2004, Bédard et al. Reference Bédard, Marsh, Hersum, Naslund and Mukasa2007).
Stratigraphy of the McMurdo Dry Valleys in the area of this study, adapted from Marsh (Reference Marsh2004). The stratigraphy of the four primary doleritic sills is shown in purple, whereas the approximate location of the opx-enriched magmatic slurry signatures are shown in yellow. The stratigraphic location of the four study regions are also approximated on the left side of the section.

Prior to cooling, additional pulses of magmatic intrusion occurred and injected orthopyroxene- (opx-) laden magmatic slurries into the two lowermost sills. These slurries, however, were unable to infiltrate the uppermost sills or reach the surface, resulting in mineralogical, chemical, and textural variations throughout the different outcrops of the Ferrar Dolerite (Marsh & Wheelock Reference Marsh and Wheelock1994, Heyn et al. Reference Heyn, Marsh and Wheelock1995, Marsh Reference Marsh2004, Bédard et al. Reference Bédard, Marsh, Hersum, Naslund and Mukasa2007). Outside the zone of opx-enrichment, dolerites exhibit an average MgO concentration of 7.0 wt%, whereas the MgO concentration can exceed 20 wt% within opx-rich zones (Marsh Reference Marsh2004). Additionally, exposures of the Basement Sill exhibit silicic segregations (Zavala et al. Reference Zavala, Leitch and Fisher2011) as well as massive cryptic layering that alternates between anorthosite (c. 14 wt% CaO, 10 wt% MgO) and pyroxenite (c. 8 wt% CaO, 16 wt% MgO) (Marsh Reference Marsh2004).
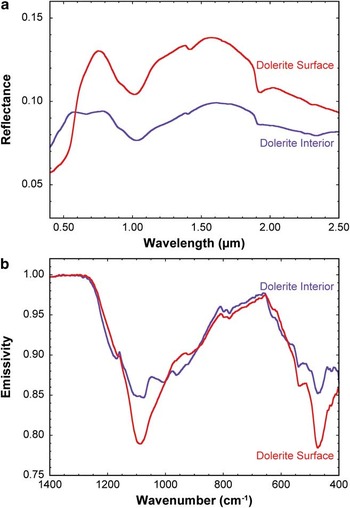
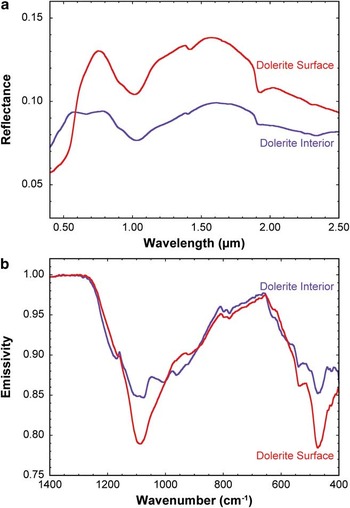
After emplacement of the dolerite sills, the Transantarctic Mountains underwent complex geological history that included deep burial and exhumation during the late Mesozoic and Cenozoic eras (e.g. Fitzgerald et al. Reference Fitzgerald, Baldwin, Webb and O'Sullivan2006). Following exhumation and upon exposure to the hyper-arid and hypo-thermal Antarctic environment, the dolerites have undergone chemical alteration and micro-structural modification (e.g. Glasby et al. Reference Glasby, McPherson, Kohn, Johnston, Freeman and Tricker1981, Head et al. Reference Head, Kreslavsky and Marchant2011). In particular, dolerites undergo rapid surface modifications in response to the oxidizing Antarctic environment. In Beacon Valley, the southernmost and highest of the MDV, chemical alteration results largely from these anhydrous oxidation processes (Salvatore et al. Reference Salvatore, Mustard, Head, Cooper, Marchant and Wyattin press). In response to a strong oxidation gradient, divalent cations are preferentially removed from the rock surface, which results in the oxidation of Fe2+ to network-modifying Fe3+ and creates metastable structural changes in the rock surface (e.g. Cooper et al. Reference Cooper, Fanselow and Poker1996). These alteration products, while difficult to identify using most laboratory techniques due to the minute chemical and mineralogical variations, are easily observed in visible/near-infrared (VNIR) and thermal-infrared (TIR) spectroscopic analyses due to the near-surface modifications and the sensitivity of these techniques to the minor variations. Oxidation of iron in pyroxenes and the formation of metastable structures in response to cation migration are responsible for unique VNIR and TIR spectral signatures respectively (Fig. 3). In the VNIR, a strong Fe2+-Fe3+ intervalence charge transfer absorption forms in the spectra of dolerite surfaces, with only subtle variations observed throughout the rest of the spectrum. No evidence for the formation of additional hydration features (e.g. sharp OH- vibrational absorptions between 2.0 μm and 2.5 μm) were detected in the VNIR. In the TIR, a substantial narrowing of the primary reststrahlen features centred near 1100 cm-1 (9.1 μm) and 465 cm-1 (21.3 μm) is observed in dolerite surfaces relative to their interiors, which is thought to reflect the production of minor amounts of metastable and immature alteration products. Under the current hyper-arid and hypo-thermal environmental conditions in Beacon Valley, more mature and crystalline alteration phases (including smectite clays) are unable to form. As a result, these metastable, incomplete, and immature alteration products, which are typically overprinted in most terrestrial environments, are uniquely preserved in Beacon Valley.
a. Visible/near-infrared, and b. thermal infrared spectra of averaged unaltered dolerite interiors (purple) and dolerite surfaces (red) from Beacon Valley. Dolerite surfaces are characterized by strong Fe2+-Fe3+ intervalence charge-transfer absorptions at wavelengths shorter than 0.7 μm and an overall higher albedo in the near-infrared. They are also characterized by narrow reststrahlen features in the thermal infrared centred near 1100 cm-1 (9.1 μm) and 465 cm-1 (21.3 μm), which represent the breakdown of silicate mineralogy into metastable alteration products.
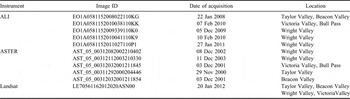
Understanding the spatial distribution of both primary and secondary mineralogies throughout the dolerite units will shed light on the geochemical evolution and alteration history of the MDV. In this study, we characterize the meso-scale (101–104 m) compositional and spectroscopic variability within the Ferrar Dolerite due to both primary and secondary processes using the Advanced Land Imager (ALI) and Advanced Spaceborne Thermal Emission and Reflection Radiometer (ASTER) orbital datasets (Table I). Orbital spectral datasets have not been widely utilized in compositional investigations of the MDV because of the difficulties associated with photometric calibration and atmospheric correction at such high latitudes. Additionally, spectral verification and ground truthing is challenging in remote and mountainous environments where not all lithologies or geographic regions may be easily accessible. As a result, a large component of this work has focused on the calibration and correction of these orbital datasets to obtain georeferenced and mosaicked surface reflectance and emission signatures that are acceptable for geological and geochemical investigations. Laboratory spectroscopy and chemical analyses were performed to further validate these data, to provide additional hyperspectral information on representative dolerite samples, and to determine the range of chemical variability observed due to primary magmatic evolution and secondary alteration processes. At spatial resolutions of 30 m pix-1 and 90 m pix-1 respectively, ALI and ASTER provide regional perspectives on the compositional nature of the Ferrar Dolerite across the majority of the ice-free portions of the MDV.
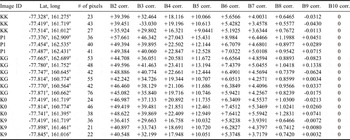
List of images and information used in the creation of the spectral map of the McMurdo Dry Valleys.

ALI = Advanced Land Imager, ASTER = Advanced Spaceborne Thermal Emission and Reflection Radiometer.
We focus on four main geographic regions within the MDV (Fig. 1). Samples from these locations have either been extensively analysed in previous studies or were collected by the authors and subsequently analysed for this study. These locations include Beacon Valley, the Labyrinth of upper Wright Valley, central Wright Valley (including the south-western portion of Bull Pass), and Victoria Valley. These locations highlight both the spectral and igneous diversity observed in the Ferrar Dolerite and help to limit our subsequent analyses to regions that have been well characterized.
Beacon Valley is the coldest (mean annual temperature of -22°C (Doran et al. Reference Doran, McKay, Clow, Dana, Fountain, Nylen and Lyons2002)), driest (mean annual water equivalent precipitation of less than 10 mm yr-1 (Schwerdtfeger Reference Schwerdtfeger1984, Fountain et al. Reference Fountain, Nylen, Monaghan, Basagic and Bromwich2009)), and highest (mean elevation of c. 1200 m above the World Geodetic System 1984 ellipsoid (Schenk et al. Reference Schenk, Csatho, Ahn, Yoon, Shin and Huh2004)) of the MDV. Exposed along the valley walls are outcrops of the Asgard and Mount Fleming sills in addition to a significant sedimentary component of the Beacon Supergroup. The valley floor, however, is composed almost entirely of doleritic clasts with only minor quartzitic and granitic components present in the northern half of the valley. The Labyrinth of upper Wright Valley is thought to have formed as a result of episodic and immense drainage of subglacial bodies of water (Lewis et al. Reference Lewis, Marchant, Kowalewski, Baldwin and Webb2006). The resultant canyon and plateau system exposes large outcrops of the Peneplain Sill of the Ferrar Dolerite. Upper Wright Glacier bounds this system to the west, the Dais of Wright Valley is present to the east, and large cliffs composed of the Beacon Supergroup flank both the northern and southern margins. Victoria Valley, in the region south of Lake Vida, hosts one of the most complete exposures of the Basement Sill and its contact with the underlying granitic basement. The shallow slope and large spatial extent reveal significant compositional diversity within the Basement Sill that is readily observable from orbit. The Basement Sill is also exposed in central Wright Valley and Bull Pass, which exhibit some of the strongest mafic signatures identified from orbit throughout the MDV. There is a significant amount of laboratory data from samples collected in this region as a result of studies by Marsh & Wheelock (Reference Marsh and Wheelock1994), Heyn et al. (Reference Heyn, Marsh and Wheelock1995), Fleming et al. (Reference Fleming, Foland and Elliot1995), Elliot & Fleming (Reference Elliot and Fleming2004), Marsh (Reference Marsh2004), Bédard et al. (Reference Bédard, Marsh, Hersum, Naslund and Mukasa2007), and others, making this region particularly appealing for orbital investigations.
Following radiometric and atmospheric calibration and correction of the orbital datasets, we use TIR orbital data to identify regions that are spectrally dominated by doleritic signatures. This task was performed by utilizing laboratory-derived spectral endmembers and a linear unmixing algorithm to differentiate between doleritic, quartzitic, and granitic compositions. We then assess the range of observed spectral signatures in the dominantly doleritic regions using an additional least-squares linear unmixing algorithm to identify the distribution of unique doleritic endmembers and spectral components. The distribution of these doleritic signatures throughout the MDV sheds light on the characteristics of magmatic intrusion as well as the production, distribution, and preservation of secondary alteration phases.
Methods
Laboratory spectral investigations
Spectra of 64 altered and unaltered dolerites, granites, granodiorites, and quartzites from throughout the MDV were collected in both the VNIR (Brown University Reflectance Experiment Laboratory (RELAB) Facility and FieldSpec-3 portable VNIR spectrometer developed by Analytical Spectral Devices Inc) and TIR (Stony Brook University Vibrational Spectroscopy Laboratory) spectral regions. Visible/near-infrared spectral measurements are sensitive to electronic transitions and vibrational processes within materials (Farmer Reference Farmer1974), whereas TIR spectral measurements measure the fundamental vibrational motions associated with a range of geologically pertinent anion groups (SiO4, CO3 etc.) (Christensen et al. Reference Christensen, Bandfield, Hamilton, Howard, Lane, Piatek, Ruff and Stefanov2000). RELAB measurements were made using a bidirectional reflectance (BDR) spectrometer, which acquires spectra between 0.32 and 2.55 μm at a 5 nm spectral sampling interval using a photomultiplier and InSb detectors (Pieters Reference Pieters1983, Mustard & Pieters Reference Mustard and Pieters1989). FieldSpec-3 measurements were made using an external light source and Spectralon white reference calibration targets. Both BDR and FieldSpec-3 illumination and emergence angles were fixed at 30° and 0° respectively. Thermal-infrared emission spectra were acquired using a Nicolet 6700 FTIR Spectrometer, which utilizes a deuterated L-alanine doped triglycine sulfate (DLaTGS) detector and CsI window. Measurements were made between 2000 cm-1 and 200 cm-1 (5 μm and 50 μm) at a sampling resolution of 4 cm-1 (variable depending on wavelength, 0.01 μm at 5 μm, 1.00 μm at 50 μm) using a CsI beamsplitter. All laboratory measurements were also re-sampled to orbital ALI and ASTER spectral bandpasses for direct comparison to these orbital datasets.
Bulk chemistry of 18 unaltered dolerite samples were obtained using inductively coupled plasma atomic emission spectroscopy (ICP-AES) via the flux fusion dissolution technique (Murray et al. Reference Murray, Miller and Kryc2000). To dissolve the materials into solution, powdered samples were divided into 40 mg aliquots, mixed with 160 mg LiBO2, and fused for ten minutes at 1050°C. The melts were quenched in 20 ml of 10% HNO3 and agitated for one hour. The samples were then filtered through 0.45 μm filters and diluted in additional 10% HNO3. The resultant liquids were analysed using a JY2000 Ultrace ICP Atomic Emission Spectrometer. Elemental abundances were calculated using a Gaussian peak search technique and the results were calibrated and converted to weight percentages using a series of blanks and geochemical standards that were processed in the same fashion as the samples (Murray et al. Reference Murray, Miller and Kryc2000). All samples, standards, and blanks were run in duplicate to increase the measurement statistics. Each sample was measured for Si, Al, Ca, Fe, Mg, Mn, Na, K, Ti, and P.
Orbital data acquisition, calibration, and atmospheric removal
Advanced Land Imager is a pushbroom imaging system onboard the Earth Observing-1 spacecraft. The data consist of ten spectral bands (Mendenhall et al. Reference Mendenhall, Bernotas, Bicknell, Cerrati, Digenis, Evans, Forman, Hearn, Hoffeld, Lencioni, Nathanson and Parker2000): nine multispectral bands ranging from 0.443–2.215 μm with an optimal spatial resolution of 30 m pix-1, and one panchromatic band centred at 0.585 μm with an optimal spatial resolution of 10 m pix-1 that is not used in this study. Five ALI scenes were obtained from the US Geological Survey (USGS) Earth Resources Observation and Science (EROS) Center website at glovis.usgs.gov (accessed 14 June 2011) (Table I). These data were then converted from their original raw digital number format (Q) to calibrated digital numbers (Qcal), followed by conversion to at-sensor spectral radiance (Lλ) using the methods discussed in Chander et al. (Reference Chander, Markham and Helder2009):
 $${{L}_\lambda }\: = \:{{G}_{rescale}}\:\times \:{{Q}_{cal}}\: + \:{{B}_{rescale}},\eqno\rm$$
where:
 $${{G}_{rescale}}\, = \,\frac{{LMA{{X}_\lambda }\,{\rm{ - }}\,LMI{{N}_\lambda }}}{{{{Q}_{calmax}}\,{\rm{ - }}\,{{Q}_{calmin}}}}\eqno\rm$$
and
 $${{B}_{rescale}}\: = \:LMI{{N}_\lambda }\:{\rm{ - }}\:\left( {\frac{{LMA{{X}_\lambda }\,{\rm{ - }}\,LMI{{N}_\lambda }}}{{{{Q}_{calmax}}\,{\rm{ - }}\,{{Q}_{calmin}}}}} \right){{Q}_{calmin}},\eqno\rm$$
where Lλ is the spectral radiance at the sensor's aperture (W/(m2 sr μm)), Qcal is the quantized calibrated pixel value (DN), Qcalmin (Qcalmax) is the minimum (maximum) quantized calibrated pixel value corresponding to LMINλ (LMAXλ) (DN), LMINλ (LMAXλ) is the spectral at-sensor radiance that is scaled to Qcalmin (Qcalmax) (W/(m2 sr μm)), Grescale is the band-specific rescaling gain factor ((W/(m2 sr μm))/DN), and Brescale is the band-specific rescaling bias factor (W/(m2 sr μm)).
Atmospheric contributions were then removed from the at-sensor spectral radiance through a hybrid dark object subtraction and regression (DOS-R) method (Chavez Reference Chavez1996, Lu et al. Reference Lu, Mausel, Brondizio and Moran2002). This method estimates the atmospheric contributions to a surface spectrum by measuring homogeneous surfaces over a range of illumination conditions. Assuming the last spectral band (band 10, 2.215 μm) is devoid of scattered downwelling radiance, the other spectral bands are plotted against this last spectral band and regressions are found to identify the atmospheric contributions where those bands project to zero solar input. Multiple iterations of this technique are performed over multiple spectral sampling locations in each image to derive the average atmospheric contribution for each ALI scene. Each DOS-R sampling location was selected based on the identification of a range of illumination conditions (from bright to dark, typically on slopes where a range of shadow conditions are present) as well as the verification of a geologically homogeneous surface (e.g. glacial tills on valley floors, slopes with single lithologies present). The average contributions from these spectral sampling locations are then subtracted from the previously derived at-sensor spectral radiance for each individual band in each individual image. The locations used for this DOS technique are shown in Fig. 1 (orange stars) and are provided, along with the derived average atmospheric contributions, in Table II.
Dark object subtraction and regression (DOS-R) information for the atmospheric correction in Advanced Land Imager data.

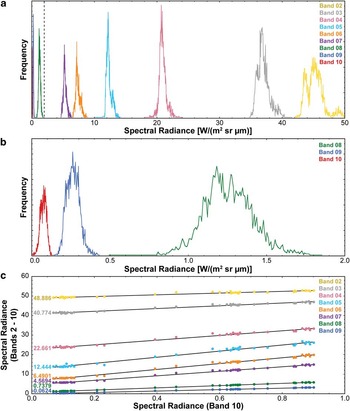
The assumption that ALI band 10 is devoid of scattered downwelling radiance is based on the Rayleigh equation, which predicts that the amount of scattered radiance at 2.215 μm is 0.03%. The paucity of scattered radiance and the relationship between band 10 and the other spectral bands is also shown in Fig. 4. The frequency distribution of spectral radiance in 3372 shadowed pixels measured in each band of ALI scene EO1A0581152008022110KG is shown in Fig. 4a and is scaled for each band. The high radiances measured in the lowest ALI bands represent the strong effects of scattering at the shortest wavelengths. However, at longer wavelengths, the contributions from scattered downwelling radiance become very small. Figure 4b is a magnified portion of Fig. 4a (marked by a dashed line) and shows the scaled radiance values for the three ALI bands at wavelengths beyond 1 μm. The majority of spectral radiance values measured in band 10 are less than 0.1 W/(m2 sr μm) and represent 0.057% of the scattered downwelling radiance. This example validates our assumption that band 10 is essentially devoid of scattered downwelling radiance.
a. Frequency distributions of measured spectral radiances in each Advanced Land Imager (ALI) band of image EO1A0581152008022110KG. Data are derived for 3372 pixels of shadowed regions within the scene, and the plotted frequencies are individually scaled to facilitate comparisons between bands. The measured radiances represent the effect of scattered atmospheric downwelling. Dotted vertical line at 2 W/(m2 sr μm) is magnified in b. b. Frequency distributions of ALI bands 8–10. The majority of pixels in band 10 record scattered downwelling radiances of less than 0.1 W/(m2 sr μm), which is the foundation for our assumption that the scattered radiance component in ALI band 10 is negligible. c. An example dark object subtraction and regression (DOS-R) regression scatterplot of 42 spectra. The y-intercepts of the modelled regressions for each band represent the scattered atmospheric downwelling radiance values. A total of 18 scattered downwelling radiance spectra were created using this method, which were used in the DOS-R atmospheric removal technique.

An example of a DOS-R regression scatterplot is shown in Fig. 4c, where 42 spectra (located near -77.75°N, 160.64°E) from a homogeneous surface under varying illumination conditions were extracted and plotted against their measured radiance values for band 10. Regressions modelled to these data exhibit good fits, and their y-intercept represents their theoretical radiance values when band 10 equals zero. In this example, the y-intercept value for band 8 is 0.7379 W/(m2 sr μm), which is equal to the scattered downwelling radiance estimated at 1.25 μm.
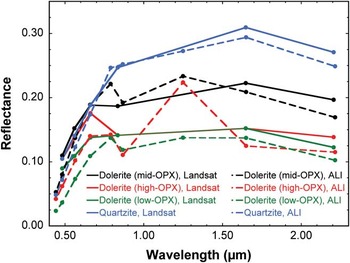
Three in situ VNIR calibration sites were identified and measured in November of 2010. A 100 m x 100 m grid was demarcated by GPS co-ordinates at three different locations of varying surface albedo. Spectral measurements between 0.35 μm and 2.50 μm were made using a FieldSpec-3 portable field spectrometer every ten meters throughout the gridded area, with calibration targets measured after every tenth measurement. These data were then averaged to produce a representative VNIR spectrum for each of the three calibration locations. However, two of the three calibration locations overlap with pixels that were excluded from our spectral map due to the presence of snow and ice in the only ALI image covering these locales. To make it possible to utilize this valuable dataset, a Landsat image (Table I) was calibrated (using the methods of Chander et al. (Reference Chander, Markham and Helder2009)) and atmospherically corrected using these three spectral grid locations. Spectra of four regions of overlap between the Landsat image and our multispectral map were acquired and compared to determine the agreement between the two datasets. The spectra of three doleritic regions and one quartzitic region are compared in Fig. 5, which confirms that the DOS atmospheric correction technique appropriately removes the majority of atmospheric contributions from our spectral map despite the exclusion of these three calibration grids. This exercise also demonstrates the advantage of ALI data over Landsat in the ability to better resolve the diagnostic absorption features associated with the dolerites.
Comparison between the dark object subtraction and regression (DOS-R) atmospheric removal technique used in our spectral mapping (dashed lines) and the use of in situ calibration targets to correct for atmospheric effects in a corresponding Landsat image (solid lines). Despite the different bandpass positions, the DOS spectra are comparable to the in situ calibration technique, emphasizing the utility of this in-scene atmospheric correction. The absorption features located near 1 μm and 2 μm are associated with the presence of opx and are resolvable only in Advanced Land Imager (ALI) data and not Landsat data.

The DOS-R atmospheric correction technique was chosen over more complex physically-based modelling (e.g. FLAASH, MODTRAN, ATCOR3) because of: 1) the amplification of scattering and aerosol contributions at high latitudes, 2) the difficulty in constraining atmospheric parameters for the remote and highly variable MDV, and 3) the good agreement between ground-truthed orbital datasets and the DOS-R-corrected ALI datasets. The longer atmospheric path lengths, due to the low solar elevations at high latitudes, significantly enhance the contributions of scattering and aerosols within an image. Small errors in aerosol estimates can also result in significant errors in retrieved surface reflection values as a result of these low solar elevations. Additionally, more sophisticated physically-based atmospheric modelling requires either the collection of considerable amounts of in situ atmospheric data (e.g. weather balloon observations) and/or complex atmospheric simulations. Unfortunately for studies of the MDV, the nearest site of frequent atmospheric data collection (McMurdo Station) is located 80–160 km to the east. Weather conditions within the MDV are also highly variable over both spatial and temporal scales (Doran et al. Reference Doran, McKay, Clow, Dana, Fountain, Nylen and Lyons2002), making modelling of atmospheric parameters extremely difficult. Lastly, our DOS-R-corrected ALI data are in good agreement with our already ground-truth corrected Landsat scenes. The results showed very good agreement, particularly at wavelengths greater than 0.6 μm where the effects of atmospheric scattering are less pronounced (Fig. 5). Further use of the DOS-R method on additional ALI scenes also resulted in good inter-scene spectral agreement, indicating that, for the purposes of our spectral and geochemical investigations, the DOS-R technique performs well.
Atmospherically corrected at-sensor spectral radiance is then converted to surface reflectance using the following equation (Chander et al. Reference Chander, Markham and Helder2009):
 $$ {{\rho }_\lambda }\: = \:\frac{{\pi \:\times \:{{L}_\lambda }\:\times \:{{d}^{\rm{2}}} }}{{ESU{{N}_\lambda }\:\times \:\cos {{\theta }_s}}}, \eqno\rm$$
where ρλ is the planetary reflectance (unitless), Lλ is the spectral radiance at the sensor's aperture (W/(m2 sr μm)), d is the Earth-Sun distance on the date of acquisition (astronomical units), ESUNλ is the mean exoatmospheric solar irradiance (W/(m2 μm)), and
 $$\[--><$>\rtheta<$><!--$$
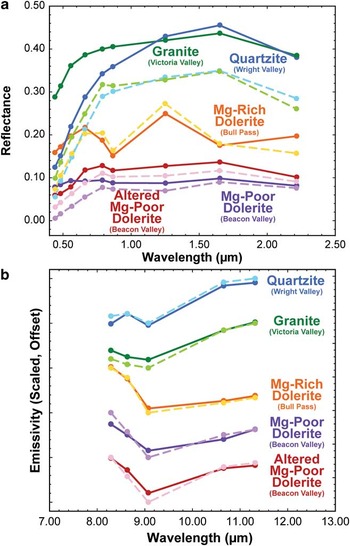
s is the solar zenith angle (degrees). Atmospherically corrected reflectance measurements of compositionally pure locations in the MDV are in good agreement with laboratory measurements (Fig. 6a), which confirms the efficacy of the DOS-R technique. Following the calculation of surface reflectance for each spectral band (after atmospheric correction, ρλ is equivalent to surface reflectance), the individual spectral bands were stitched and mosaicked using the Environment for Visualizing Images (ENVI) software developed by Exelis Visual Information Solutions.
a. Visible/near-infrared (VNIR) laboratory spectra (dark solid lines) and characteristic Advanced Land Imager (ALI) spectra (light dashed lines) of different lithological units. The spectral shapes are largely consistent between laboratory and orbital datasets, while offsets are probably due to sub-pixel mixing and imprecise atmospheric removal. b. Thermal-infrared (TIR) laboratory spectra (dark solid lines) and characteristic Advanced Spaceborne Thermal Emission and Reflection Radiometer (ASTER) spectra (light dashed lines) of different lithological units. Data have been scaled and offset for clarity. As with the VNIR data, minor offsets are probably due to sub-pixel mixing and imprecision in the Temperature/Emissivity Separation (TES) atmospheric removal algorithm.

Advanced Spaceborne Thermal Emission and Reflection Radiometer thermal infrared images consist of five spectral bands ranging from 8.3–11.4 μm, have an optimal spatial resolution of 90 m pix-1, and are acquired using a whiskbroom mechanism (ERSDAC 2005). Five ASTER scenes were utilized in the production of the spectral mapping product (Table I) and were acquired from the NASA Land Processes Distributed Active Archive Center (LP DAAC) at https://lpdaac.usgs.gov/lpdaac/get_data/wist (accessed 13 August 2010). Data were acquired as Level 2B AST_05 products, which have already been calibrated and converted to surface emissivity using the Temperature/Emissivity Separation (TES) algorithm described in Gillespie et al. (Reference Gillespie, Rokugawa, Matsunaga, Cothern, Hook and Kahle1998). These data were compared to laboratory derived emissivity measurements to ensure that the pre-calibration was effective. In all cases, the Level 2B AST_05 data of compositionally pure locales throughout the MDV were spectrally consistent with laboratory-derived spectra, confirming that further corrections or calibrations were not required (Fig. 6b). The five images were mosaicked with each other and to the five ALI images to create a single multispectral dataset.
The entire dataset was merged to accommodate the full spatial resolution of the ALI dataset. As a result, the ASTER dataset is highly pixilated in comparison to the ALI dataset, although no interpolation or data modification was applied during this process. The ten images were then geographically mosaicked in ENVI to produce a single image with fourteen spectral bands. All imagery was georeferenced prior to delivery, and coregistration was manually verified before mosaicking. Pixels containing water, ice, snow, clouds, and shadows were removed from the spectral mosaic through isolation of their unique spectral properties, as discussed below. The resultant product consists of 1.57 x 10⁶ multispectral data points over the ice-free MDV. A parameterization of this final spectral product is shown in Fig. 1.
High latitude mountainous terrains are influenced by considerable variations in illumination angle in addition to the presence of pronounced shadows. Topography and illumination angle have been shown to not influence remote spectral identifications (Domingue & Vilas Reference Domingue and Vilas2007), although they have been shown to have minor effects on mineral abundance estimations using non-linear modelling techniques (Cord et al. Reference Cord, Pinet, Daydou and Chevrel2005).
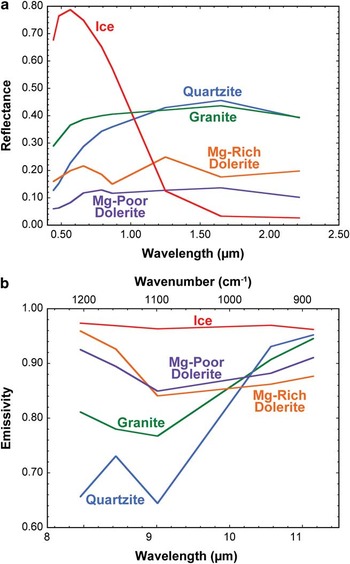
Water, ice, snow, and clouds are easily separated from rocky surfaces using atmospherically corrected surface reflectance data. In the VNIR, water and ice have reflectance maxima in the visible wavelengths and their reflectance decreases significantly at longer wavelengths (Fig. 7a). In contrast, rocky surfaces generally exhibit relatively low reflectance values in the visible wavelengths as compared to longer wavelengths. To exploit these spectral disparities, a spectral parameter was established to identify water- and ice-rich pixels. If the corrected surface reflectance value at 0.565 μm is more than twice that at 1.65 μm, the pixel was removed from the scene. In the TIR, water and ice exhibit relatively high emissivity values across the entire ASTER spectral range relative to rocky surfaces, which exhibit large variations due to the presence of diagnostic structural vibrations (Fig. 7b). To exploit this spectral characteristic, pixels were determined to be contaminated by water or ice if the average emissivity value over all five spectral bands was greater than 0.95. These pixels were identified and removed from the spectral mosaic.
a. Visible/near-infrared (VNIR), and b. thermal-infrared spectra of ice and assorted lithologies from throughout the McMurdo Dry Valleys, highlighting the ease of spectrally identifying regions influenced by significant abundances of ice, snow, water, and clouds.

Spectral parameters were also developed to identify shadowed regions following the removal of pixels contaminated by water and ice. In the VNIR, pixels dominated by rocky materials typically exhibit high reflectance values in the ALI band positioned at 1.65 μm. For example, the final spectral dataset has an average reflectance value at 1.65 μm of 0.183 with a standard deviation of 0.097. Shadowed regions, however, exhibit extremely low reflectance values following atmospheric correction. As a result, pixels exhibiting a reflectance at 1.65 μm less than 0.03 were identified and removed, as they are dominated by shadows. ASTER data were already corrected for the effects of shadows during TES processing and surface emissivity derivation (Gillespie et al. Reference Gillespie, Rokugawa, Matsunaga, Cothern, Hook and Kahle1998), and the algorithm is capable of calculating emissivity values regardless of time of day or extent of shadowing.
Identification of spectrally pure dolerite using ASTER TIR data
Assessing the spectral variability within purely doleritic terrains requires that the data be limited exclusively to regions composed of dolerites and lack significant abundances of other lithologies. Deriving the areal abundance of surface compositions is theoretically straightforward using TIR emission spectroscopy due to the extremely high absorption coefficients exhibited by most geological materials in this wavelength region. As a result, the observed spectral signal is derived from the uppermost surface and is a linear combination of the compositional constituents present on the surface (Ramsey & Christensen Reference Ramsey and Christensen1998). Deconvolving complex mixtures in the VNIR spectral region is more complex due to the significant contribution of volume scattering of rays that have been refracted into and out of individual mineral grains (Hapke Reference Hapke1981). However, mineral identification and parameterization in the VNIR spectral region is a widely used technique that has been verified through both field and laboratory validation.
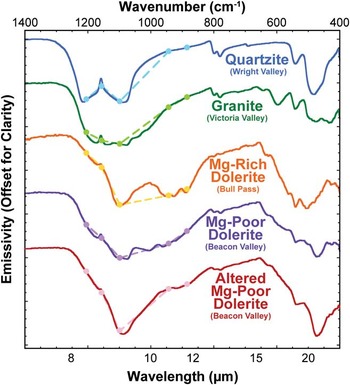
We ran a least squares linear retrieval algorithm (Ramsey & Christensen Reference Ramsey and Christensen1998) using spectral endmembers derived from laboratory measurements to identify regions that are spectrally dominated by dolerite in the TIR. Because this algorithm limits the number of endmembers to one fewer than the number of spectral bands, our library is limited to a maximum of four endmembers. The four selected endmembers highlight the extremes of lithological variation throughout the MDV (Fig. 8). Unaltered dolerites from Beacon Valley and Bull Pass were selected to represent the Mg-poor and Mg-rich endmembers of the Ferrar Dolerite, respectively, while a granite from Victoria Valley and quartzite from Wright Valley were chosen to represent the Si-rich lithological endmembers (e.g. the Granite Harbour Intrusives and the Beacon Supergroup respectively).
Laboratory thermal-infrared emissivity spectra of five rock endmembers in the McMurdo Dry Valleys. The spectra are also re-sampled to Advanced Spaceborne Thermal Emission and Reflection Radiometer (ASTER) bandpasses (dots and dashed lines) and plotted with the hyperspectral laboratory data. The top four lithologies were used as spectral endmembers in the linear unmixing algorithm to identify uncontaminated doleritic terrains. The bottom three doleritic spectral endmembers highlight the range of known spectral variation in the dolerite based on laboratory measurements and were used in the linear unmixing of pure doleritic pixels.

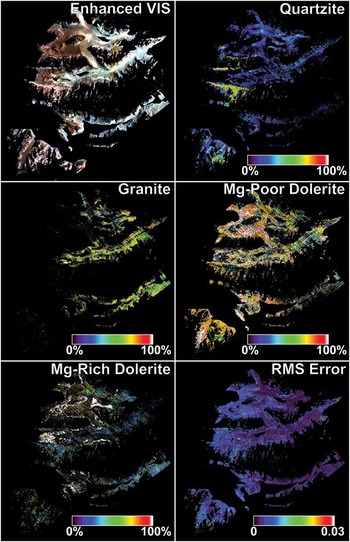
The results of this unmixing algorithm are reported in Fig. 9. The unmixing yields an average root-mean-squared (RMS) error of 0.0048±0.0033, indicating that the majority of the spectral diversity within the scene can be accounted for by these four spectral endmembers. The highest RMS error values (0.041) appear to be associated with atmospheric contamination and clouds that were not properly removed during calibration, as the spectra do not appear consistent with any known geological materials that are present within the MDV and are often tightly aggregated. The lack of areas with high RMS error associated with geographically coherent units indicates that no major lithologies are being excluded from our endmember library.
The results of a linear unmixing algorithm on the full spectral map of the McMurdo Dry Valleys. The root-mean-square (RMS) error, indicating the goodness of fit of the modelled spectra, shows an overall good fit to the data using the provided endmember spectra. However, slightly increased RMS errors are present in Beacon Valley and other doleritic regions and highlight regions of altered dolerite spectral signatures.

Areas identified as non-pure dolerite pixels (< 90% Mg-poor + Mg-rich dolerites, as modelled during linear unmixing) were removed from the rest of the spectral mapping product, leaving only those pixels mapped as having > 90% modelled dolerite. The sensitivity of thermal wavelengths to the presence of quartz makes the detection of even small amounts of granite and quartzite contamination possible. The 90% threshold for dolerite abundance was selected to minimize the spectral contribution of quartzites and granites. The number holds no geological or geochemical significance. As a result, we utilized this constraint to qualitatively select our regions of spectrally pure dolerite.
Identification of spectral variability within the Ferrar Dolerite using ASTER TIR data
Subsequent to subsetting pure dolerite pixels from the rest of the image, an endmember library containing unaltered Mg-rich dolerite, unaltered Mg-poor dolerite, and altered Mg-poor dolerite was used to unmix the pure dolerite pixels to assess the primary mineralogy and the extent of surface alteration contributing to these pixels (Fig. 8). An altered Mg-rich dolerite was not included in this endmember library because of its absence from our sample suite, which will be discussed below. Altered dolerite surfaces exhibit strong Fe3+ absorption features at visible wavelengths, but lack any diagnostic near-infrared spectral signatures. In contrast, altered dolerite surfaces exhibit a dramatic sharpening of the major TIR absorption feature centred near 9.1 μm as a result of the breakdown of micro-scale mineral structures (Salvatore et al. Reference Salvatore, Mustard, Head, Cooper, Marchant and Wyattin press). While considerably different from the unaltered dolerite spectra, the overall spectral shape of the altered Mg-poor dolerite is also different from that of granites or quartzites. Accordingly, in the previous unmixing algorithm, units containing substantial quantities of altered dolerites were mapped as unaltered dolerites with slightly higher RMS errors; this can be seen in Fig. 9f in southern Beacon Valley. To ensure that granitic or quartzitic components were successfully eliminated from the pure dolerite pixels assessed here, both granite and quartzite endmembers were alternated into this second unmixing model. Only 74 pixels were modelled as including more than 10% granite or quartzite, with the highest abundance being 15.14%. These pixels were removed to ensure that the pixels under investigation consist of spectrally pure dolerite surfaces.
Resultant spectral products
Two spectral products result from the assembly of these datasets. The first product is a 14-band multispectral image of pure dolerite pixels throughout the MDV, which provides the spectral data necessary to create summary parameters (e.g. Table III). The spatial resolution of the VNIR and TIR datasets are 30 m pix-1 and 90 m pix-1 respectively. The second product is a 5-band linear unmixing product, mapping the relative percentage of Mg-poor unaltered dolerite, Mg-poor altered dolerite, and Mg-rich unaltered dolerite throughout the scene, normalized to 100%. The other two bands consist of a modelled blackbody component, which is used to scale the endmember spectra to fit the measured ASTER data, in addition to a band containing the modelled RMS error for each pixel. These three-dimensional products (two spatial dimensions, one spectral dimension) provide the ability to assess the spatial distribution of these spectral components throughout the MDV. Additionally, spectral profiles can be generated to highlight the observed and modelled spectral variability along transects.
Spectral parameters used in the creation of the spectral mapping product featured in Fig. 1, including the Mafic Band Strength (MBS) parameter.

NIR = near-infrared.
Results
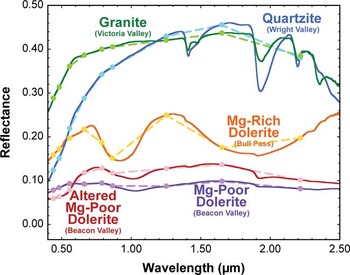
Granites, quartzites, and dolerites each have unique spectral properties that can be identified and measured in the VNIR (Fig. 10) and TIR (Fig. 8). Laboratory spectral measurements provide hyperspectral data with which to interpret our multispectral orbital datasets.
Visible/near-infrared (VNIR) laboratory spectra of different lithologies found throughout the McMurdo Dry Valleys. The spectra are also re-sampled to Advanced Land Imager (ALI) bandpasses (dots and dashed lines) and plotted with the hyperspectral data. The unique shapes of the spectra and positions and strengths of absorption features allows for the identification of individual mineral constituents as well as the discrimination between major lithological classes.

Laboratory spectroscopy
Laboratory VNIR spectra of samples from the Granite Harbour Intrusives (green spectrum, Fig. 10) show a relatively flat spectrum after a rapid increase in reflectance to c. 0.6 μm with several sharp vibrational absorption features associated with OH- and H2O. These absorption features can be explained by a combination of an Al-OH phyllosilicate (probably muscovite; 1.4 μm, 1.9 μm, 2.2 μm) in addition to varying amounts of prehnite (1.5 μm, 2.35 μm), a Ca-Al silicate hydroxide that forms in specific metamorphic environments (Ehlmann et al. Reference Ehlmann, Mustard, Swayze, Clark, Bishop, Poulet, Des Marais, Roach, Milliken, Wray, Barnouin-Jha and Murchie2009). The TIR is dominated by a broad absorption feature near 9 μm with variable quartz signatures and a lack of mafic mineral absorptions present at wavelengths between 10 μm and 12 μm. When convolved to orbital bandpasses, the VNIR spectra of granites and granodiorites are relatively featureless with a steady increase in reflectance to 1.65 μm, whereas the TIR exhibits low emissivity values short of 10 μm followed by a rapid increase in emissivity beyond 10 μm (green spectrum, Fig. 8).
Most outcrop-forming exposures of the Beacon Supergroup consist of quartzites with occasional shale, siltstone, and mudstone interbeds (Isaac et al. Reference Isaac, Chinn, Edbrooke and Forsyth1995). The quartzites exhibit a similar spectral shape to the granites and granodiorites in the VNIR, exhibiting a relatively flat spectrum that steadily increases in reflectance until a maximum at c. 1.7 μm (blue spectrum, Fig. 10). The vibrational absorption features associated with OH- and H2O are much stronger than those observed in the granites and can be explained by the presence of opaline silica (1.4 μm, 1.45 μm, 1.9 μm, 2.2 μm) and illite (1.4 μm, 1.9 μm, sharp 2.2 μm). The TIR emission spectra are dominated by the diagnostic quartz absorptions centred near 8.4 μm and 8.9 μm with an emissivity peak between the two absorptions near 8.62 μm. The remainder of the TIR spectrum is relatively featureless until c. 12.5 μm, where a second pair of absorption features unique to quartz is present. Convolved to the orbital bandpasses, the quartzites exhibit a similar VNIR spectral shape to that of granites and granodiorites, except that the increase in reflectance up to 1.65 μm and the decrease in reflectance beyond 1.65 μm are both typically of greater magnitude. In the TIR, the first three ASTER bands are able to capture the absorption doublet and emission peak unique to quartz, while the last two bands exhibit significantly higher emissivity values (blue spectrum, Fig. 8).
Two distinct classes of the Ferrar Dolerite are evident in the laboratory VNIR dataset. The first class of dolerites exhibits a low albedo and relatively weak 1 μm and 2 μm absorption features associated with opx (Adams Reference Adams1974) (purple spectrum, Fig. 10). Additionally, the presence of a relatively broad absorption feature at 1.2 μm due to the Fe present in the M1 site of pyroxenes (Klima et al. Reference Klima, Pieters and Dyar2008) causes the reflectance peak beyond 1 μm to be located at c. 1.6 μm. The second class of dolerites is characterized by strong 1 μm and 2 μm absorption features and a masking of the weaker 1.2 μm absorption feature that is present in the first class of dolerites, causing the local reflectance maximum to be located near 1.3 μm (orange spectrum, Fig. 10). When convolved to orbital bandpasses, the spectral shapes of these classes are easily distinguished by: 1) the strength of the broad 1 μm and 2 μm opx absorption features (regarded as VNIR mafic band strength (MBS), see Table III), and 2) the position of the local reflectance maximum at either 1.25 μm or 1.65 μm. The TIR signatures of these dolerite classes are also unique. The emissivity spectra from the first class of dolerites exhibit a broad and complex absorption feature between 8 μm and 12 μm with evidence for quartz, plagioclase, opx, and other minor phases (purple spectrum, Fig. 8). The second class of dolerites, however, exhibits stronger opx absorptions centred near 9.1 μm and 11 μm. When convolved to orbital bandpasses, the second class of dolerites exhibit a stronger decrease in emissivity between 8.6 μm and 9.1 μm, in addition to a less pronounced increase in emissivity between 9.1 μm and 10.65 μm, which reflect the additional opx contribution (orange spectrum, Fig. 8).
While plagioclase fractionation and variability has been previously studied (e.g. Fleming et al. Reference Fleming, Foland and Elliot1995), this component is difficult to assess using our spectroscopic techniques. In the VNIR, crystalline plagioclase exhibits a relatively weak and broad crystal field absorption near 1.25 μm due to the substitution of trace amounts of Fe2+ for Ca2+ (Adams & McCord Reference Adams and McCord1971). This feature, however, is commonly masked by the 1.2 μm pyroxene absorption feature (Klima et al. Reference Klima, Pieters and Dyar2008). The minor TIR spectral variations expected for varying degrees of plagioclase fractionation are also difficult to observe in our analyses due to the broad and complex absorptions caused by multiple overlapping silicate mineralogies. However, the strong and diagnostic pyroxene absorption features are readily distinguishable in both VNIR and TIR spectral regions.
The altered surfaces of many fine-grained dolerites exhibit unique TIR spectral signatures. These signatures are dominated by a strong decrease in emissivity between 8.6 μm and 9.1 μm, followed by a sharp increase in emissivity from 9.1 μm to 10.65 μm (red spectrum, Fig. 8). This spectral shape is diagnostic of the breakdown of mineral structures at the rock surface as a result of surface oxidation and alteration and will be discussed further below.
Lithological mapping from orbit
Laboratory spectra provide the necessary validation for interpreting orbital spectral signatures. Spectral parameters were heavily used to exploit unique spectral features (Table III). In Fig. 1, MBS is mapped in red, the intensity of the reflectance increase between 1.25 μm and 0.79 μm is mapped in green, and the height of the quartz emissivity peak at 8.62 μm relative to the depth of the two adjacent absorption features is mapped in blue. When combined into a single image, these parameters prominently highlight the lithological diversity throughout the MDV (Fig. 1).
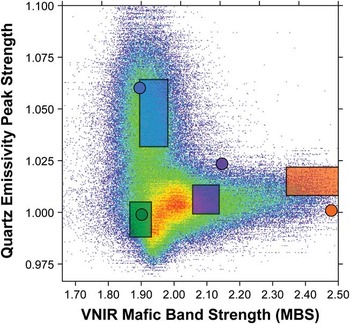
Figure 11 compares the MBS relative to the strength of the quartz emissivity maximum for all of the pixels in the final spectral mapping product. Dolerites plot towards stronger MBS, whereas granites and quartzites plot at intermediate and strong quartz emissivity maximum values, respectively. The dense data cloud representative of weak values for each parameter represents the widespread and homogeneous sediments present in the valley floors and along mixed talus slopes, which comprise most of the image. When values for representative in-scene endmembers (boxes with widths and heights of one standard deviation) are plotted, it is evident that the representative laboratory measurements (circles) accurately represent the lithologies present throughout the MDV. The largest offset between laboratory and in-scene endmembers is associated with the dolerites, although there is a slight offset with quartzite measurements as well. Sub-pixel mixing of quartz- and opx-rich material with the Mg-rich dolerites and quartzites, respectively, can explain the observed offset between laboratory and in-scene endmembers. The Mg-poor dolerite laboratory endmembers measured in this study were obtained from Beacon Valley, which is composed largely of quartz-normative dolerites, whereas portions of the lower sills are composed of hypersthene-normative dolerites (Fleming et al. Reference Fleming, Foland and Elliot1995). As a result, the Mg-poor dolerites selected for laboratory measurements are expected to be the quartz-rich dolerite endmembers, as is confirmed in Fig. 11.
Scatterplot derived from the spectral map, plotting the strength of the mafic band strength (MBS) versus the quartz emissivity peak strength. Values derived for representative rock samples measured in the laboratory are shown as coloured dots (colours identical to those in Fig. 10: quartzite in blue, granite in green, Mg-poor dolerite in purple, and Mg-rich dolerite in orange). Values derived from type-locations of these lithologies as observed in our spectral dataset are plotted as shaded boxes that are one standard deviation wide in both directions. The offset between the quartzite and Mg-rich laboratory- and orbital-derived values can be explained by sub-pixel mixing, while the offset for the Mg-poor dolerite can be explained by the measurement of quartz-normative dolerites in the laboratory.

Spectral variability of pure dolerite
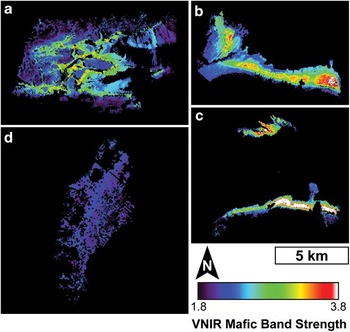
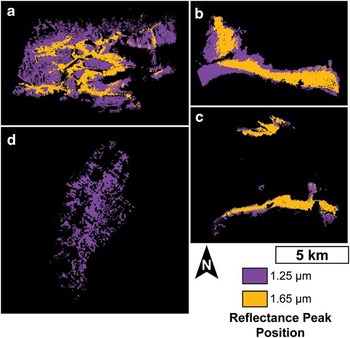
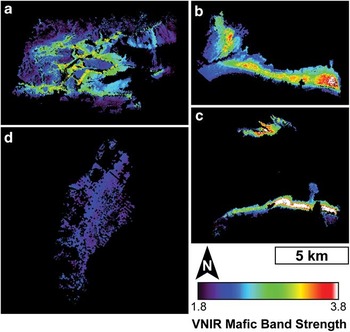
Purely doleritic pixels show a range of spectral variability associated with diagnostic compositional properties. Mapping the MBS in ALI reveals widespread variability throughout the Labyrinth, Victoria Valley, and central Wright Valley, whereas Beacon Valley exhibits uniformly low values with little variability (Fig. 12). The strong MBS values are restricted to the middle of the lower dolerite sills and are absent from any surfaces dominated by dolerites from the upper sills. A similar distribution can be identified by mapping the location of the local reflectance maximum at either 1.25 μm or 1.65 μm, which was shown earlier to be diagnostic of pyroxene content. The centres of the lower sills exhibit the reflectance maximum at 1.25 μm, whereas the margins of the lower sills and the entirety of the upper sills exhibit the reflectance maximum at 1.65 μm (Fig. 13).
Visible/near-infrared (VNIR) mafic band strength (MBS) maps of a. the Labyrinth, b. Victoria Valley, c. central Wright Valley, and d. Beacon Valley. The location of the opx-enriched zones are clearly defined by the areas containing stronger mafic signatures.
Mapping the position of the near-infrared (NIR) reflectance peak in a. the Labyrinth, b. Victoria Valley, c. central Wright Valley, and d. Beacon Valley. The position of this reflectance peak is associated with the enrichment of opx and nicely maps the distribution of the zones of opx-enrichment identified by Marsh (Reference Marsh2004).

While ALI only has one spectral band located in the region dominated by OH- combination tones (band 10, 2.215 μm), its broad full width at half maximum (0.135 μm) and the lack of other nearby spectral bands also make the identification of hydrated alteration phases difficult. As a result, in the absence of additional mineralogical information, ALI cannot be used to determine the presence or abundance of hydrated alteration phases. However, none of the dolerites investigated in this study exhibit vibrational absorption features between 2.0 μm and 2.5 μm. All dolerite surfaces instead exhibit strong absorption features at wavelengths shorter than 0.7 μm that are associated with Fe3+. Unfortunately, these features are also difficult to characterize using ALI due to the unavoidable influences of Rayleigh scattering in the remote investigations of high latitudes. As a result, we have not considered quantitatively assessing the degree of surface oxidation using this spectral region.
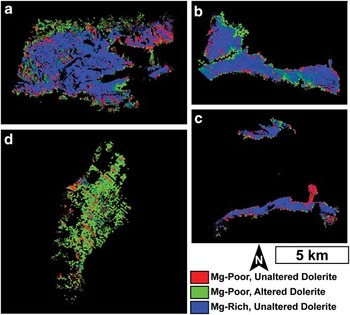
Significant variability in TIR spectra is observed throughout the Ferrar Dolerite, as is evident from the linear unmixing of purely doleritic pixels (Fig. 14). The low average RMS error (0.0043±0.0016) confirms the goodness of fit of the model. In Beacon Valley, the most significant spectral contributor is the altered Mg-poor dolerite, with only minor contributions from the unaltered endmembers. In the Labyrinth, unaltered mafic dolerite signatures dominate the central regions with perhaps the strongest signatures present along the scree slopes. Altered dolerite signatures are modelled along the western, northern, and southern margins. The Labyrinth shows the largest RMS errors associated with the unmixing algorithm, although the values still represent good spectral fits. These high RMS errors are likely to be a result of the Mg-rich dolerite endmember spectrum being derived from samples largely collected from Victoria Valley and Bull Pass, with only a few samples collected from the Labyrinth. Central Wright Valley and Bull Pass are also dominated by unaltered mafic dolerites, with less mafic dolerite contributing significantly to the dolerite lobe along the south-eastern portion of central Wright Valley and altered dolerite signatures modelled along the eastern edge of Bull Pass. Lastly, Victoria Valley is largely characterized by unaltered mafic materials, while substantial altered components are modelled along the north-western portion of Victoria Valley as well as along the central portion of the exposed sill.
Results of linear unmixing of Advanced Spaceborne Thermal Emission and Reflection Radiometer (ASTER) thermal-infrared data of the pure doleritic regions of a. the Labyrinth, b. Victoria Valley, c. central Wright Valley, and d. Beacon Valley. Altered doleritic signatures are extensively identified throughout Beacon Valley and are limited elsewhere throughout the McMurdo Dry Valleys.

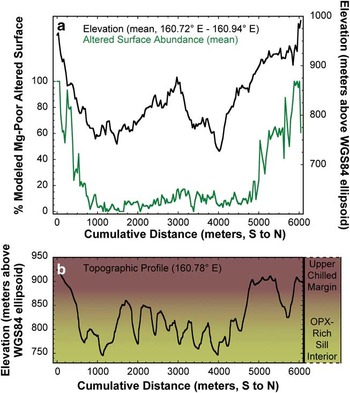
The alteration signatures observed in the Labyrinth are particularly intriguing due to their distribution only along the western, northern, and southern margins (Fig. 14d), where the current surface elevations are highest. To test the relationship between alteration signatures and surface elevation, an average of fifteen south-to-north profiles was made across the Labyrinth with the surface elevation (as measured by airborne LIDAR measurements (Schenk et al. Reference Schenk, Csatho, Ahn, Yoon, Shin and Huh2004)) and the modelled abundance of altered dolerite values extracted. There is a clear relationship between higher elevations and higher modelled abundances of altered dolerites (Fig. 15a). The Pearson correlation coefficient of the relationship between these two parameters is 0.56, with a Student's t-test value confirming to a 95% confidence level that the elevation of the surface provides information to the prediction of the modelled altered surface abundance. In addition, the sum of the chi-square value is equal to 35.5 with 181 degrees of freedom, verifying that there is a probability of < 1% that the data can be explained by randomness alone. Together, these statistical tests conclude that areas of higher elevation in the Labyrinth are correlated with regions of higher modelled altered dolerite abundances. A single representative topographic profile is provided in Fig. 15b to highlight the topographic variability within the Labyrinth and along its margins. Background colours are consistent with the stratigraphic profile in Fig. 2 and demarcate the approximate locations of the sill chilled margins and the opx-enriched interior.
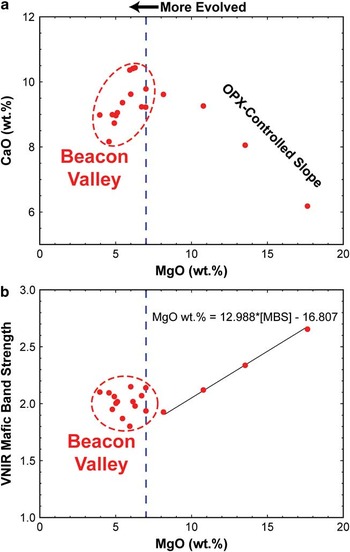
a. CaO vs MgO concentrations in rock interiors, as measured by ICP-AES. Samples from the upper sills (represented by the Beacon Valley samples) consistently contain < 7 wt% MgO and display a positive relationship with CaO, representing more evolved magmatic chemistries. However, in the portions of the lower sills that are influenced by the addition of opx-enriched magmatic slurries, the MgO concentration increases and the relationship with CaO becomes negative, indicating the contribution of more primitive magmatic components. These trends were originally observed by Marsh (Reference Marsh2004). b. Visible/near-infrared (VNIR) mafic band strength vs MgO concentration. With the addition of a more primitive magmatic component, a linear relationship exists between the strength of the 1 μm and 2 μm VNIR mafic bands and the concentration of MgO.

Chemical variability within the Ferrar Dolerite
Bulk rock MgO and CaO concentrations follow similar trends to those identified in Marsh (Reference Marsh2004), with more evolved magmas showing an increase of CaO with increased MgO below c. 7 wt% MgO, representing the near-liquid compositions of the upper sills and the sill margins of the lower sills (Fig. 16a). At MgO concentrations greater than c. 7 wt%, CaO decreases with increasing MgO concentration, representing the addition of more primitive opx-bearing magmas. A similar relationship is also seen when plotting the MBS against MgO (Fig. 16b). Below c. 7 wt%, the strength of the MBS remains relatively constant, whereas samples with MgO concentrations greater than 7 wt% show a systematic increase in MBS. Because ALI bandpasses were used to calculate the MBS in laboratory data, this relationship can be used in the analysis of orbital datasets to approximate the MgO concentration in different doleritic regions throughout the MDV by applying the equation in Fig. 16b to the map shown in Fig. 12. This equation converts the low and high MBS values identified in Fig. 12 to 6.6 wt% MgO and 32.5 wt% MgO, respectively, which are broadly consistent with MgO abundances measured in rocks from central Wright Valley presented by Marsh (Reference Marsh2004). These values should be regarded as estimates, as several potential sources of error exist, including the effects of topography, illumination angle, and shadows, although these effects are likely to be minor (Cord et al. Reference Cord, Pinet, Daydou and Chevrel2005, Domingue & Vilas Reference Domingue and Vilas2007).
a. Mean topographic and mean modelled altered surface abundance profiles of the Labyrinth of upper Wright Valley. A strong correlation exists between the elevation and the modelled altered surface abundance. b. A representative topographic profile through the Labyrinth. Background colours are consistent with Fig. 2 and represent the approximate elevations and exposures of the Peneplain Sill upper chilled margin and opx-rich interior.

Discussion
Identification and distribution of doleritic signatures
The spectral signatures of purely doleritic regions of the MDV can be effectively characterized using an endmember library derived from laboratory measurements of dolerite samples documented and collected in key areas of the MDV. Variations in both primary mineralogies and secondary alteration products are identified in laboratory measurements, which can then be linked to spectral signatures observed from orbit. For example, TIR orbital data indicates that the majority of the variability in the lower sills is due to variations in the primary mineralogy of the dolerite (Fig. 14a–c). However, in the upper sills, the presence and abundance of alteration products account for the majority of the observed spectral variability (Fig. 14d). In the VNIR, the lower sills exhibit a range of MBS values that are associated with the presence and abundance of opx-rich dolerites (Fig. 12a–c). However, the upper sills exhibit little variability in MBS, as these dolerites consist largely of fine-grained dolerites of minimal chemical variability (Fig. 12d).
Variations in primary igneous compositions are in good agreement with previous studies that have identified major chemical variations within the Ferrar Dolerite exposed throughout the MDV. The zones of opx-enrichment identified by Marsh (Reference Marsh2004) are clearly visible in VNIR orbital data as the regions of heightened MBS values. Significant exposures of opx-rich dolerites that were not detailed in Marsh (Reference Marsh2004) can also be observed and characterized from orbit, particularly in Victoria Valley and the Labyrinth (Fig. 12). The identification of these variations in primary mineralogy add spatial context to the studies of Marsh (Reference Marsh2004), Bédard et al. (Reference Bédard, Marsh, Hersum, Naslund and Mukasa2007), and other works that use laboratory investigations to identify local mineralogical and chemical heterogeneities. Spectral effects associated with silicic segregations were not observed in our orbital datasets due to their small spatial scales and extents (typically ≤ 2 m thick (Zavala et al. Reference Zavala, Leitch and Fisher2011)).
The distribution of secondary alteration products is also in good agreement with previous studies of chemical weathering in the MDV. The VNIR and TIR spectral signatures of dolerite surfaces from Beacon Valley exhibit unique spectral signatures, as compared to their unaltered interiors (Fig. 3), that represent anhydrous oxidation in response to the oxidizing Antarctic environment (Salvatore et al. Reference Salvatore, Mustard, Head, Cooper, Marchant and Wyattin press). While Fe3+ absorption features in the VNIR are difficult to characterize from orbit, the shape and characteristics of ASTER TIR spectra are consistent with the presence of altered dolerites throughout Beacon Valley (Fig. 6). These signatures are strongest along the valley floor and weakest along the western walls, suggesting that the exposed walls of Beacon Valley are younger and less altered than the floors, which have had sufficient time to develop and preserve alteration products.
Why are TIR chemical alteration signatures almost exclusively concentrated in Beacon Valley? The development of alteration products is not likely to be limited to certain rock chemistries. Opx-rich lithologies are just as (if not more) susceptible to chemical alteration than those of near liquid composition (Lasaga Reference Lasaga1984). The maturation and preservation of alteration products is more likely to be related to variations in sill properties as exposed in the different valleys. The upper sills, which are devoid of mafic intrusions and were intruded into cold sedimentary rocks, are characterized by fine-grained igneous textures. As suggested by Glasby et al. (Reference Glasby, McPherson, Kohn, Johnston, Freeman and Tricker1981), fine-grained dolerites are the best hosts for alteration rinds due to their resistance to physical weathering. The lower dolerite sills were both intruded at a greater depth and were subject to multiple episodes of magmatic injection, providing a heat source and ample time for prolonged crystal growth. Whereas some coarse-grained dolerites do effectively preserve alteration rinds and their associated spectral signatures, most coarse-grained dolerites are easily weakened by aeolian abrasion, thermal cycling, freeze-thaw cycling, and other means of physical breakdown and erosion (Reference Marchant, MacKay, Lamp, Hayden and HeadMarchant et al. in press). As a result, alteration products that form on coarse-grained dolerites are easily lost to flaking or disintegration before they can become significant spectral components of the rock surfaces.
The western, northern, and southern margins of the Labyrinth also show evidence of altered dolerite signatures in ASTER data (Fig. 14a). These areas are associated with the upper margin of the Peneplain Sill, which is relatively fine-grained (as compared to the central regions of the Peneplain Sill) and has a composition similar to the near liquid dolerites from Beacon Valley (Marsh & Wheelock Reference Marsh and Wheelock1994). Transitioning to lower elevations and into the opx-enriched portion of the Peneplain Sill, alteration signatures are modelled at lower abundances due to the difficulties associated with preserving alteration rinds (Fig. 16).
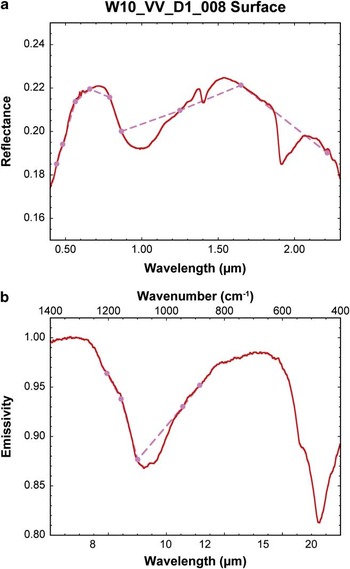
The other localized area of altered TIR signatures includes portions of Victoria Valley. The exposure of the Basement Sill in Victoria Valley is bisected by a narrow valley that connects the topographically higher Bull Pass to Lake Vida in Victoria Valley (Fig. 1). The margins of this valley exhibit TIR alteration signatures that may be associated with erosion from this ancient channel, which masks the underlying mafic compositions. However, no samples were collected from this location and so identifying the cause of the narrow reststrahlen bands is purely speculative. The north-western margin of Victoria Valley also exhibits narrow reststrahlen bands typical of altered dolerites (Fig. 14b). This locale appears to be a portion of the lower margin of the Basement Sill, which is thought to be associated with finer-grained rocks of near liquid compositions. As a result, these signatures are likely to be associated with the preferential preservation of alteration rinds on fine-grained dolerites. Lastly, a portion of the centre of the Basement Sill exhibits evidence of TIR alteration signatures where the MBS values are particularly high (Figs 12c & 14c). No samples were collected from this particular region in Victoria Valley, and only one sample collected from Victoria Valley exhibits both alteration signatures in the TIR as well as a strong 1 μm opx absorption feature, although the 2 μm feature is absent (W10_VV_D1_008, Fig. 17). This sample, although coarse-grained, has a well-preserved alteration rind on its surface. A possible explanation for these orbital VNIR and TIR signatures is that the surface is dominated by rocks similar to W10_VV_D1_008, where alteration rinds are able to develop and remain preserved on the surfaces of mafic, coarse-grained dolerites. Why this portion of Victoria Valley is unique, however, has yet to be constrained and will probably require future in situ investigations.
a. Visible/near-infrared (VNIR), and b. thermal-infrared (TIR) laboratory measurements of the surface of sample W10_VV_D1_008. Spectra downsampled to Advanced Land Imager (ALI) and Advanced Spaceborne Thermal Emission and Reflection Radiometer (ASTER) bandpasses are also shown. Despite the relatively strong VNIR mafic band strength, TIR data show significantly altered doleritic signatures. These spectral signatures are also found throughout a large portion of central Victoria Valley, which might indicate a region of uniquely altered Mg-rich dolerites.

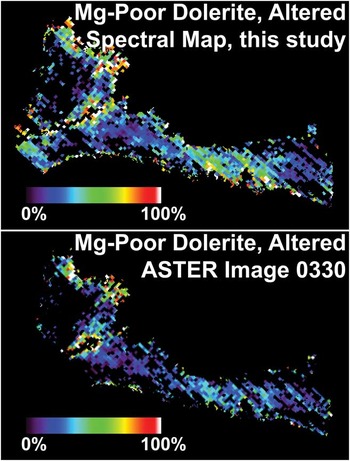
The spectral signatures in Victoria Valley were further investigated using a second ASTER scene obtained over Victoria Valley. This additional scene is in agreement with the one used in the MDV spectral map regarding the distribution of altered dolerites (Fig. 18). This observation confirms that the identification of alteration signatures is not an instrumental artefact or due to the presence of transient sub-pixel ice, snow, or clouds. Rather, these spectral signatures represent fundamental mineralogical and structural properties of the doleritic surfaces.
Comparison of two different Advanced Spaceborne Thermal Emission and Reflection Radiometer (ASTER) scenes of Victoria Valley, showing the consistency between modelled alteration signatures. This test confirms the spectral variability throughout this region and proves that these signatures are not the result of spectral artefacts present in one particular ASTER image.

Geochemical evolution of the Ferrar Dolerite
The geochemical and mineralogical signatures associated with the emplacement of dolerite sills, and the chemical weathering following exposure to the Antarctic environment, both produce distinct spectral signatures that can be identified from orbit. During emplacement, the parental magmas of the Ferrar Dolerite were intruded into the subsurface at various depths, resulting in a range of cooling histories and initial grain sizes (e.g. Marsh Reference Marsh2004, Bédard et al. Reference Bédard, Marsh, Hersum, Naslund and Mukasa2007, Elliot & Fleming 2008). The lower sills were then intruded with additional, more primitive magmatic slurries of liquid and opx crystals, which also acted to reheat the surrounding doleritic material and create unique crystallization patterns and cryptic banding within these sills (Marsh & Wheelock 1995, Heyn et al. Reference Heyn, Marsh and Wheelock1995). The two upper sills were never modified by subsequent injections of magmatic slurry, resulting in a preservation of the initial stages of magma intrusion, near-liquid compositions, rapid quenching, and the resultant fine-grained crystals (Marsh Reference Marsh2004). As we have shown in our spectroscopic investigations, the influence and distribution of these primary magmatic processes can be readily observed from orbit using both VNIR and TIR multispectral datasets due to the spectrally unique signatures of opx. These spectral data provide valuable information regarding the spatial distribution of opx enrichment and chemical variability throughout the sills.
Long after emplacement, burial, and exhumation (Fitzgerald et al. Reference Fitzgerald, Baldwin, Webb and O'Sullivan2006), the dolerite sills were exposed throughout the MDV through a series of physical processes dominated by fluvial and glacial erosion (Sugden et al. Reference Sugden, Denton and Marchant1995, and references therein). Once exposed to these hyper-arid and hypo-thermal environmental conditions (Marchant & Head Reference Marchant and Head III2007), chemical alteration of the dolerites was able to commence. Recent studies suggest that anhydrous alteration products dominate dolerite surfaces (Salvatore et al. Reference Salvatore, Mustard, Head, Cooper, Marchant and Wyattin press). These processes, which can proceed in the absence of liquid water, are the only known explanation for the observed geochemical and spectral signatures. Whereas the majority of the VNIR spectral modifications are difficult to quantify due to the residual effects of Rayleigh scattering, TIR spectral variations are very sensitive to these alteration processes and readily capture their variability and distribution throughout the MDV. Localized aqueous alteration has also been observed throughout the MDV (e.g. Allen & Conca Reference Allen and Conca1991, Head et al. Reference Head, Kreslavsky and Marchant2011), although the preservation of mature alteration products on rock surfaces appears to be the exception rather than the norm.
The products of this chemical alteration are best preserved on fine-grained dolerites, which are less susceptible to physical erosion, and result in unique spectral and chemical signatures. In contrast, coarse-grained dolerites, including most of the opx-rich dolerites that underwent slow cooling at depth, lack alteration signatures because of their susceptibility to physical erosion. Regardless of grain size, rock ventifaction and disintegration as a result of freeze-thaw and thermal cycling (Glasby et al. Reference Glasby, McPherson, Kohn, Johnston, Freeman and Tricker1981, Reference Marchant, MacKay, Lamp, Hayden and HeadMarchant et al. in press) are widespread throughout the MDV and confirm the dominance of physical erosion over chemical alteration.
Conclusions
We have presented the results of a combined laboratory and orbital investigation to identify and interpret geochemical signatures of the Ferrar Dolerite throughout the MDV. Our analyses conclude that:
-
1) Dolerites exhibit unique VNIR and TIR spectral signatures as a result of both primary geochemical properties as well as secondary chemical alteration.
-
2) Linear unmixing of ASTER data using a laboratory-derived endmember library is able to identify spectrally pure dolerite pixels in orbital datasets based on their diagnostic TIR spectral signatures.
-
3) Laboratory investigations reveal an association between the strength of the opx absorption features in the VNIR and the bulk MgO content of the dolerites. When applied to ALI data, the measured MgO contents throughout the dolerite sills are consistent with previous studies. Additionally, this analysis is the first complete assessment of the spatial distribution of exposed opx-rich sill interiors throughout the MDV.
-
4) Thermal-infrared signatures of altered dolerites are largely restricted to Beacon Valley and the margins of the Labyrinth. Only fine-grained dolerites are capable of preserving mature alteration rinds that result in these spectral signatures. This observation explains the scarcity of altered Mg-rich dolerites in our collected sample suite.
Future use of additional multispectral and hyperspectral datasets can provide critical information regarding the presence, nature, and distribution of crystalline alteration products throughout the MDV. For example, ASTER shortwave-infrared (SWIR) datasets can provide additional spectral resolution between 2.0 and 2.5 μm, which could help to identify the presence and distribution of phyllosilicates, sulfates, and carbonates throughout the MDV. These data were excluded from this study largely due to the incomplete spatial coverage of cloud-free images. While absorption features have not been identified in this wavelength region as a result of dolerite alteration processes, the analysis of glacial till and the other prominent lithologies may benefit greatly from the addition of these spectral bands. The acquisition of additional cloud-free ASTER SWIR imagery would be beneficial to these types of studies. Additional in situ reflectance and emissivity measurements of doleritic surfaces would help to reduce some of the short wavelength scattering and aerosol contributions associated with remote sensing at high latitudes. These in situ measurements may help to better study the nature and distribution of Fe3+ phases and could help to assess the effects of oxidation outside of Beacon Valley.
Our analyses demonstrate that multispectral orbital datasets can be used to better characterize the magmatic, climatic, and alteration histories of the Ferrar Dolerite within the MDV. The identification and characterization of pure doleritic terrains throughout the MDV has helped to constrain the spatial distribution of complex magmatic and alteration products, which has significant implications for the geological and weathering histories within the Transantarctic Mountains.
Acknowledgements
This work was funded by the National Science Foundation Antarctic Science Division (Office of Polar Programs) through grants to James W. Head (ANT-0739702) and David R. Marchant (ANT-0944702), which are gratefully acknowledged. Logistical support for this project was provided by the US National Science Foundation through the US Antarctic Program. The authors would also like to thank Raytheon Polar Services Company, the United States Air Force 62nd Airlift Wing, and PHI Inc, for their assistance and support during the 2009–10 and 2010–11 summer field expeditions. We thank James Dickson, Laura Kerber, Gareth Morgan, Brandon Boldt, Sylvain Piqueux, David Hollibaugh Baker, J.R. Skok, Sean Mackay, Jennifer Lamp, Jack Seeley, Sandra Wiseman, Tim Goudge, Rebecca Greenberger, Kevin Cannon, Paul Morin, Tim Glotch, Deanne Rogers, Takahiro Hiroi, Dave Murray, Joe Orchardo, Andrea Weber, the Keck/NASA Reflectance Experiment Laboratory (RELAB) at Brown University, and the Vibrational Spectroscopy Laboratory at Stony Brook University for their assistance with fieldwork, orbital analyses, and laboratory measurements. This manuscript benefitted greatly from the reviews by Christian Haselwimmer, Teal Riley, and Alan Vaughan, for which we are sincerely grateful.