INTRODUCTION
The increasing demand of food globally (Godfray et al., Reference Godfray, Beddington, Crute, Haddad, Lawrence, Muir, Pretty, Robinson, Thomas and Toulmin2010; Ray et al., Reference Ray, Mueller, West and Foley2013) is particularly pertinent in developing countries where the population as well as the per capita food consumption is growing much faster than in developed countries (Kearney, Reference Kearney2010). An evident example is Ethiopia whose population has increased from about 53.5 million in 1994 to 74 million in 2007 (Central Statistics Authority (CSA), 2007), and it is projected to reach about 180 million by 2050 (Admassu et al., Reference Admassu, Getinet, Thomas, Waithaka, Kyotalimye, Waithaka, Nelson, Thomas and Kyotalimye2013). So far, increase in food production to feed the growing population has been mainly achieved through the expansion of cultivated land (Abate and Lemenih, Reference Abate and Lemenih2014; Dessie and Kleman, Reference Dessie and Kleman2007; Tsegaye et al., Reference Tsegaye, Moe, Vedeld and Aynekulud2010). For example, in Ethiopia, the area under maize and wheat cultivation has increased by 3.1 × 10⁴ ha yr−1 and 5 × 10⁴ ha yr−1 respectively between 1993 and 2012 (Food and Agriculture Organisation (FAO), 2013). Fertile land for agricultural expansion is becoming scarce (Garedew et al., Reference Garedew, Sandewall, Söderberg and Campbell2009; Gebrelibanos and Assen, Reference Gebrelibanos and Assen2015; Zeleke and Hurni, Reference Zeleke and Hurni2001), but productivity growth in Ethiopia is low, and the national average yield of most cereals is well below 2 t ha−1 (FAO, 2013). A declining resource base (Ali et al., Reference Ali, Descheemaeker, Steenhuis and Pandey2011), degraded soils (Meshesha et al., Reference Meshesha, Tsunekawa, Tsubo and Haregeweyn2012), erratic climatic conditions (Ayenew, Reference Ayenew2002; Kassie et al., Reference Kassie, Rötter, Hengsdijk, Asseng, Van Ittersum, Kahiluto and Van Keulen2014a) and nutrient-depleted soils (Haileslassie et al., Reference Haileslassie, Priess, Veldkamp, Teketay and Lesschend2005) are severely constraining cereal yields in rainfed systems. Due to financial and market access problems, current fertilizer and other input use across the country is low and the adoption of yield-increasing production technologies by farmers is limited (Spielman et al., Reference Spielman, Davis, Negash and Ayele2011).
The Central Rift Valley (CRV) of Ethiopia is a typical example of such on-going processes. Grazing land has been gradually converted into cropland, and currently there is little scope for further expansion in crop area (Getnet et al., Reference Getnet, Hengsdijk and Van Ittersum2014). Hence, the focus should be on increasing productivity and improving resource use efficiency (RUE) based on a better understanding of climate and biophysical resource base as well as the socioeconomic–institutional context in which local farming systems operate.
Quantitative understanding of temporal and spatial variation in actual and potential crop productivity is lacking, and information on the difference between the two (the so-called yield gap (Y g)) is only partially available for part of the CRV, and based on limited actual yield (Y a) data (Kassie et al., Reference Kassie, Van Ittersum, Hengsdijk, Asseng, Wolf and Rötter2014b). However, there is a large amount of yield data that is regularly collected from farmers’ fields for all major crops to estimate annual production. In addition, there is experimental data collected from federal and regional research stations as part of crop improvement programs. Until now, these databases have not been used beyond their original purpose, i.e. to improve the quantitative understanding of yield gaps across crops and locations.
The physical environment affects the inputs required to realize a particular production level (Van Ittersum and Rabbinge, Reference Van Ittersum and Rabbinge1997). Resource use efficiencies are therefore highly variable as a result of soil variability and weather conditions, but also farmers’ management decisions affect crop responses to applied nutrients (Tittonell et al., Reference Tittonell, Vanlauwe, Leffelaar, Shepherd and Giller2005). Moreover, yield-reducing factors, such as pest, disease and weed infestation, can result in strong reductions in the use efficiency of resources (Giller et al., Reference Giller, Rowe, Ridder and Keulen2006). The lack of information on RUEs and the scope for their improvement hampers the identification of strategies for the development of alternative/improved land use systems. RUE is important from an economic and environmental point of view (De Wit, Reference De Wit1992). Understanding the resource use and RUEs of current production systems helps to identify possibilities of producing more with the available resources and to understand variations across farming zones and years.
The objective of this paper is to quantify the gaps between actual (farmers’ average) and experimental (water-limited potential) yield levels of maize and wheat in different farming zones of the CRV. We bring together and analyse a large amount of data from farmers’ fields (>10,000 unique observations) and experimental data, and use these empirical data for (yield gap) calculation. We quantify yield gaps of both average and the top 5% farmers (hereafter ‘best performing farmers’) and seek relationships across years between yield gaps on the one hand and rainfall and nutrient application rates on the other. Moreover, we analyse the RUEs (nutrient and water) of maize and wheat in different farming zones to assess the spatial variation in RUE and scope for improvements. Finally, we discuss the performance of current maize and wheat systems and the theoretical potential for intensification.
MATERIAL AND METHODS
Description of the study area
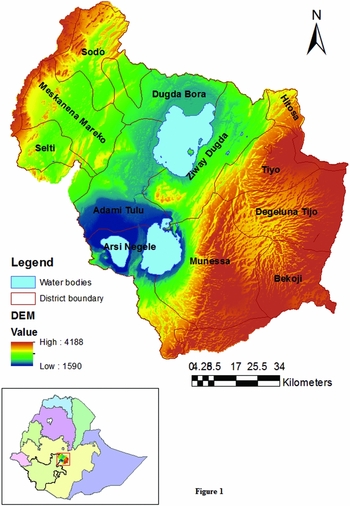
The CRV basin is situated at the border of two regional states of Ethiopia, Oromia and Southern Nations, Nationalities and Peoples (SNNP). A total of 11 districts (corresponds with Weredas) are part of the CRV basin (between 38°81′ E and 39°8′ E, and between 7°10′ N and 8°30′ N) (Figure 1).
Location map of the Central Rift Valley of Ethiopia.

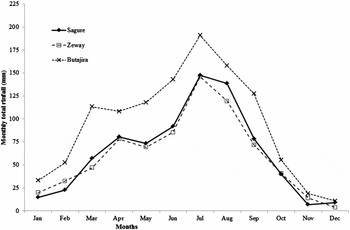
Rainfall increases from approximately 600 mm yr−1 at the bottom of the Central lowlands to about 1600 mm yr−1 in high altitudes of the Eastern and Western highlands following an altitude gradient. The bimodal rainfall distribution is characterised by a short rainy season (Belg) in March and April and a long rainy season (Kiremt), which begins in April/May in the Eastern and Western highlands (e.g. Sagure and Butajira, respectively) and in June in the Central lowlands (e.g. Zeway) (Figure 2). The long rainy season ends almost uniformly across the CRV in October. The length of growing period (LGP) is shorter in the lowlands than in the highlands due to the later onset of the long rainy season. Rainfall in the short rainy season is generally insufficient to produce a crop, and the long rainy season is therefore the main production season for most farmers. About 70% of the annual rainfall precipitates in the main rainy season. The annual average daily temperature varies from about 16 °C in the Eastern and Western highlands (3000 metres above sea level (m.a.s.l.) to 21 °C in the Central lowlands (1600 m.a.s.l.).
Monthly rainfall distribution of Sagure, Zeway and Butajira weather stations representing the Eastern highlands, Central lowlands and Western highlands, respectively, of CRV in Ethiopia (Data source: National Meteorological Agency, 1990–2009).

The main part of the CRV (ca. 54%) is located on relatively flat land with slopes of less than 8%, potentially allowing both rainfed and irrigated agriculture. The remainder, ca. 20%, of the CRV is characterized by slopes of 8–16%, potentially suitable for rainfed agriculture and pressurized irrigation. Approximately 18% of the CRV is on slopes of more than 16%, which are not suitable for sustainable arable farming without making huge investments in conservation structures, and the remaining 8% is covered by lakes.
Eight major soil types are found in the CRV, Luvisols (42%) are the most dominant soil type, while Nitisols (12%), Andosols (10%), Cambisols (10%) and Vertisols (8%) also cover large areas in the CRV.
Cultivated land is the dominant land use (ca. 70%) in the CRV, while ca. 17% comprises natural and semi-natural vegetation (e.g. forests and grasslands) and 13% is not suitable for agriculture (e.g. built-up area and degraded land; Getnet et al., Reference Getnet, Hengsdijk and Van Ittersum2014). Cereals are the dominant crops in the CRV with maize and wheat occupying ca. 26% and 24% of the total cultivated area respectively (International Food Policy Research Institute (IFPRI), 2006).
Concepts and the methodological approach
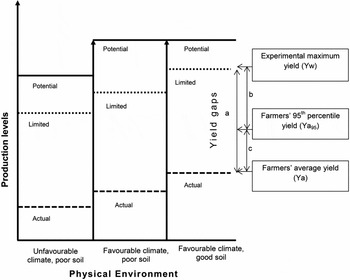
We followed the production–ecological approach to analyse yield gaps (Van Ittersum and Rabbinge, Reference Van Ittersum and Rabbinge1997). The approach explains potential, limited and actual production levels (the levels of primary output per unit area) as function of yield defining, yield limiting and yield reducing factors respectively (Figure 3).
The production–ecological approach that explains potential, limited (Y w) and actual (Y a) production levels and the yield gap (a = between Y w and Y a; b = between Y w and Y a95 and c = between Y a95 and Y a) as function of yield defining, limiting and reducing factors under various physical environments based on Van Ittersum and Rabbinge (Reference Van Ittersum and Rabbinge1997).

Potential yield (Y p) is the theoretical yield obtained for yield defining factors (radiation, temperature and crop characteristics) of a given physical environment while water and nutrients are supplied optimally and pests and diseases are fully controlled.
Water-limited (Y w) and/or nutrient-limited (Y n) production levels are attained at lower levels than the potential levels because of suboptimal supply of water and/or nutrients respectively. Both Y p and Y w are calculated for optimum or recommended sowing dates, planting density and variety (Van Ittersum et al., Reference Van Ittersum, Cassman, Grassini, Wolf, Tittonell and Hochmand2013). Sowing dates and the maturity period of varieties should fit with the dominant cropping system and the feasible growth duration, particularly in tropical and semi-tropical environments, where the length of the growing season shows a strong spatial variation.
The actual production level (Y a) is determined by the degree to which a crop is exposed to yield reducing factors (weeds, diseases and pests) together with the effects from yield defining and yield limiting factors. The Y a is influenced by the actual agronomic management practices to overcome the impacts of yield limiting and yield reducing factors.
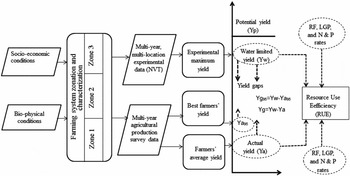
The yield gap can be defined as the difference between Y p (modelled or measured in well-managed irrigated experiments) and Y a. In rainfed systems, Y w is the most relevant benchmark to calculate yield gaps (Van Ittersum et al., Reference Van Ittersum, Cassman, Grassini, Wolf, Tittonell and Hochmand2013). While Y a can be estimated from the mean or median of farmers’ average production (Van Ittersum et al., Reference Van Ittersum, Cassman, Grassini, Wolf, Tittonell and Hochmand2013), maximum yields under controlled conditions (on-station, under optimum conditions with no nutrient limitation and yield reduction due to pests and diseases) can represent Y w (Tittonell and Giller, Reference Tittonell and Giller2013; Van Ittersum et al., Reference Van Ittersum, Cassman, Grassini, Wolf, Tittonell and Hochmand2013). The average yield from such experiments over many years reflects a typical range of climate variation, and thus represents a robust estimate of Y w (Lobell et al., Reference Lobell, Cassman and Field2009). Therefore, yield gaps and RUEs were determined for multiple years using a framework of analysis (Figure 4). Similar to the use of Y a and Y w for the calculation of yield gaps, RUEs of rainwater, nitrogen (N) and phosphorus (P) fertilizers have been determined at two levels: the actual production level, which is represented by farmers’ average yield, and the water-limited production level, which is derived from experiments.
Framework of analysis of yield gaps and RUE in the CRV. NVT: national variety trial; RF: rainfall; LGP: length of growing period; N: nitrogen; P: phosphorus.

As yield gaps and RUEs vary across locations because of the interactions between genotype, environment and management (G × E × M), we cannot treat the entire CRV as one unit of analysis. We therefore distinguish farming zones with relatively homogeneous environmental and management characteristics (Homogenous Farming Zone (HFZ)).
Data
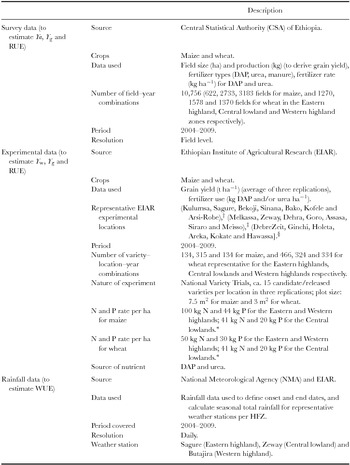
For the farming zonation, the socioeconomic information of the 11 districts of the CRV was obtained from the Atlas of Ethiopian rural economy (IFPRI, 2006). Rainfall and temperature data from 17 weather stations were obtained from the National Meteorological Agency (NMA) (Table 1). These data were interpolated and district-level averages were used in the farming zonation (Table 2). Daily rainfall data (2004–2009) from three representative weather stations (Zeway, Sagure and Butajira) was used for calculating seasonal rainfall and rainfall water use efficiency (WUE) per HFZ (Table 3).
Description of data used to estimate yield gaps of maize and wheat and related RUE of actual and water-limited yield.

†Research centres/experimental sites that usually target varieties and other agricultural technologies to the Eastern highlands of CRV.
‡For the Central lowlands.
§For the Western highlands.
*Application rates on experimental fields based on recommendations for similar environmental conditions in Ethiopia.
RUE: resource use efficiency; WUE: rain water use efficiency.
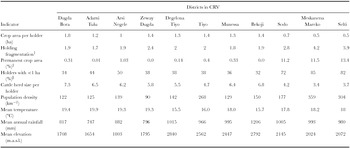
Socioeconomic and physical indicators used to group districts into relatively homogeneous farming zones. The first six socioeconomic indicators are district level averages (IFPRI, 2006), the last three indicators are calculated averages of raster values per district.

†The average number of parcels per holding.
‡Permanent crop area as a percentage of cropped area.
§Percentage of holders who have land holding size of 1 ha or less.
m.a.s.l.: meters above sea level.
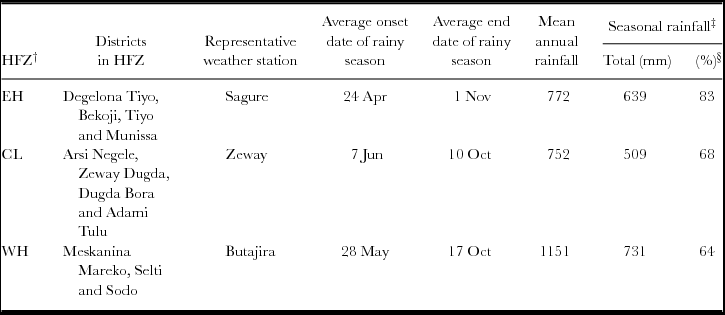
Agro-meteorological characteristics of three HFZs.
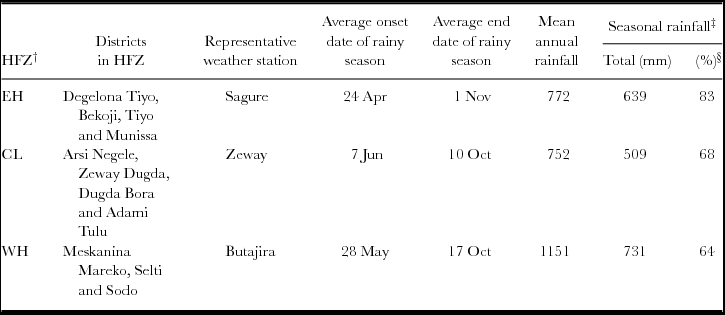
†EH: Eastern highlands, CL: Central lowlands, WH: Western highlands.
‡Seasonal rainfall refers to the rainfall between the mean onset and the end date.
§Seasonal rainfall as a percentage of annual total rainfall.
Experimental yield data (at grain moisture content of 12.5%) of National Variety Trials (NVTs; 2004–2009) of the Ethiopian Institute of Agricultural Research (EIAR) were obtained from various sites representative for the study area (Table 1) to estimate Y w (see below for justification and more information). The NVT data are averages of three replications and comprise yields of about 12 candidate varieties and three released (control) varieties.
Farm data to estimate Y a were acquired from CSA. The agricultural database contains annual information on ca. 1800 farmers’ fields of wheat and maize from 2004 to 2009 (total of 10,756 fields over six years) within our study area. Besides the field location, the information includes the area and grain yield of surveyed fields (measured at harvest), type and amount of fertilizer applied, and farmers’ perceptions on the presence or absence of erosion (yes/no) of each surveyed field. The survey data by CSA are based on a stratified two-stage sampling design in which enumeration areas (smallest boundaries used by CSA to administer surveys and censuses) are primary sampling units, and agricultural households are secondary sampling units. Data on field size are obtained by physically measuring the fields of sampled households. Yield data are collected from a 4 × 4-m quadrant that is laid in the middle of sampled fields using pegs, immediately after planting. The quadrant receives similar farmer's management as the rest of the field, whereas farmers agree not to harvest any plants at green stage (particularly for maize) from or within the quadrant. The harvested crop is threshed, sundried and regularly weighed until a constant weight is attained for reporting. Sundried moisture content may slightly differ from the 12.5% grain moisture content at experimental fields, although the error is expected to be small. Data on input use are obtained by interviewing the sampled households about their farm operations during the season. Input rates are calculated on a hectare basis based on the measured field size.
Since district boundaries and variable names in the CSA survey data had changed over the years, we improved the consistency of the data to enable time series analysis by (1) spatially reassigning farm data to districts using consistent district boundaries; and (2) standardizing variable names using the field code books used in each survey year by CSA.
Farming zonation
Although the CRV is a small basin relative to the larger Rift Valley Lakes Basin and other basins in Ethiopia, biophysical and socioeconomic conditions are heterogeneous, especially related to altitude and climate, which necessitates a zonation. Raster maps were produced for rainfall, temperature and altitude of CRV, based on which the average rainfall, temperature and altitude were calculated as physical indicators for each of the 11 districts using ArcGIS10. A hierarchical cluster analysis was conducted using nine physical and socioeconomic indicators (Table 2) to classify the districts in the CRV into relatively HFZs.
Estimation of yield gaps
Yield gap analysis was performed for rainfed maize and wheat in the identified HFZs for each year from 2004 to 2009 to capture climate variability, and then the average yield gap per HFZ across the six years was computed. We considered maize and wheat crops for three reasons. Firstly, both crops grow across different landscapes of the CRV, facilitating the comparison of yield levels between the three HFZs. Secondly, they are the most important cereals in terms of land use in the CRV. Thirdly and related to the previous two issues is the data availability of both crops.
We estimated Y a as the average yield (t ha−1) from farmers’ fields per HFZ based on the CSA survey data for every year from 2004–2009. We conducted descriptive statistics and mean comparison of Y a and associated nutrient use (N and P) across HFZs. The Kruskal–Wallis test for non-normally distributed data was used to test the significance of the difference in Y a between three HFZs. We used the Mann–Whitney U test (non-parametric) to compare two groups, i.e. (1) yields of fertilized and unfertilized fields, (2) yield as well as N application rates of fields with and without perceived erosion problems. Furthermore, a Chi-square test was applied to understand the association between fertilizer application (0 = no, 1 = yes) and perceived presence of soil erosion (0 = no, 1 = yes). We also calculated the 95th percentile of farmers’ yields (Y a95) for the same period as a yield indicator of best performing farmers. We compared the yield and mean nutrient applications at Y a95 with those of Y a production levels. Since the sample size of the latter group was much larger, we randomly selected the same number of observations as in the Y a95 sample to enable a t-test for nutrient use on equal sample size. Finally, we selected all farmers’ fields that received N input rates greater or equal to the recommended rates, computed the average yields from these fields by HFZ and compared these with the yields from fields that received less than the recommended rates.
The NVT yield data from representative locations in HFZs (Table 1) were pooled for each of the years 2004–2009. The maximum of the experimental yield from each year in each HFZ is used to represent Y w of that particular year and HFZ. The annual Y w values were plotted to show the Y w trend over six years. We also computed the variation in Y w across HFZs.
The annual yield gap is computed as the difference between Y w and Y a levels of corresponding years, and the average (2004–2009) is presented by crop and HFZ to represent yield gap of an average year. Similarly, we computed the difference between Y w and Y a95 as an indication of the yield gap between water-limited potential and best farmers’ yield across HFZs (Y g95; Figure 4). Finally, we compared Y w with Y a of fields receiving at least the recommended N application rate to assess the single effect of N input on narrowing the yield gap.
Our assumption that the maximum trial yield (average from three replications) for any given HFZ represents Y w is based on the fact that the varieties tested include the optimum varieties for the region, and the input use is assumed close to optimal. Also, the agronomic management aspects are optimized: sowing dates and planting densities are such that maximum yields may be expected, weeds are controlled by intensive and timely hand weeding (using skilled, hired labour) and herbicides, whereas diseases and pests are controlled by chemical spraying. However, two reservations must be made regarding the assumption about Y w. Firstly, the fertilizer application is limited to DAP and urea, so only N and P are applied, while other nutrients may have limited production. Secondly, the NVTs received a locally recommended N and P rate, which is a blanket recommendation for large areas regardless of the soil fertility status of individual fields. Therefore, the applied N and P rate in some of the NVTs may have been suboptimal for achieving Y w, and thus the calculated yield gap might underestimate the real yield gap. On the other hand, farmers use a range of varieties, including open-pollinated and hybrids, but some of the new varieties in the NVT may not be available to the farmers in the same year. This may be a reason for an overestimation of real yield gap using NVTs.
Estimation of resource use efficiencies
The survey database from CSA lacks data on planting and harvesting dates, impeding the calculation of the growing season rainfall. Therefore, the start and end of the main rainy season were calculated for the years 2004–2009 for three weather stations, Butajira, Zeway and Sagure, which are representative of the Eastern highland, Central lowland and Western highland zones respectively. The start of a growing season is the first day of the year when cumulative rainfall from three consecutive days is 20 mm or more and is not followed by a dry spell of eight consecutive days or more during the subsequent 30 days (Segele and Lamb, Reference Segele and Lamb2005; Sivakumar, Reference Sivakumar1988). The end of the season is defined as the first day of a dry period (<0.1 mm day−1) of at least 20 days occurring after onset of the season. The total rainfall received between the start and end of the season (RFLGP) was calculated for each year.
The rain WUE (kg ha−1 mm−1) for each year from 2004–2009 is estimated corresponding to Y w and Y a as follows:
 $$\begin{equation}
{\rm WUE} = Y/{\rm RF}_{{\rm LGP}} ,\end{equation}$$
where Y = grain yield (kg ha−1) – either Y w or Y a; and RFLGP = total rainfall (mm) within the growing season.
We are aware that the actual planting of some fields is usually done after the onset of rainy season because inputs (e.g. fertilizers) and labour may not be available to timely plant all fields at the same moment. Yet, we assume also that the rainfall (after the onset of the season) that is received before actual planting is available for the crop as soil moisture. Therefore, any delay in planting for whatever reason is attributed to the inefficiency of the farmer in using the available moisture; hence, we used RFLGP to allow a consistent comparison of WUE between the farmers’ and experimental situations.
The survey database comprises data on the amount (kg) of DAP, urea or both applied on each field. We expressed fertilizer use in terms of N and P based on the relative percentage of these nutrients in the fertilizers. For few fields, i.e. ca. 7% of the 10,756 maize and wheat fields, the total amount of DAP and urea applied per field is presented as one aggregated value in the database. In these cases, a 2:1 ratio of DAP and urea (based on the blanket recommendation of N and P in most parts of CRV) was assumed to calculate the applied amounts of N and P.
The Y a levels from fields with and without N application are compared as an indicator of the agronomic N use efficiency. Fields that received organic fertilizer (manure) are excluded from this analysis, as quantitative information on the amount and quality of the manure was lacking, whereas it may have influenced yields.
RESULTS
Homogenous farming zones
The major heterogeneity within the CRV was captured by grouping the 11 districts (Table 2) into three relatively HFZs (Table 3), facilitating the analysis of yield gaps and RUEs.
The districts of Degelona Tiyo, Bekoji, Tiyo and Munessa are grouped in the Eastern highland zone with a relatively early onset of rainy season and the highest proportion of seasonal to annual rainfall (Table 3). This zone is a cereal mixed farming zone at high altitude characterized by relatively low temperatures. Major cultivated crops include wheat (Triticum spp.) and barley (Hordeum vulgare), whereas faba bean (Vicia faba), maize (Zea mays), sorghum (Sorghum bicolor), rape seed (Brassica campestris), flax (Linum usitatissumum) and mustard (Brassica juneca) are also grown. The latter three crops are mostly grown in rotation with wheat and barley.
The districts of Arisi Negele, Zeway Dugda, Dugda Bora and Adami Tulu are in the Central lowland zone with the latest onset of the season and the lowest annual and seasonal rainfall (Table 3). Temperatures are relatively high at this low altitude zone around the lakes Zeway, Langano and Abyata. In the dominant mixed farming systems, maize, tef (Eragrostis tef) and wheat are major staple crops, while haricot bean (Phaseolus vulgaris) is often grown as a cash crop.
The districts of Maskanena Mareqo, Silti and Sodo are grouped in the Western highland zone, which is characterized by the lowest proportion of seasonal to annual total rainfall (and highest seasonal total rainfall) with a relatively early onset of rainy season (Table 3). The Western highland is an Enset (Ensete ventricosum)-based mixed farming zone where tef, wheat, maize, faba bean, haricot bean and chilli (Capsicum fructescens) are mono-cropped or intercropped with Enset.
Current maize and wheat yields and fertilizer use
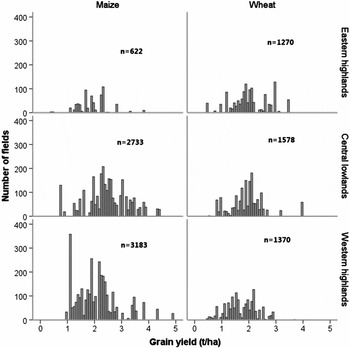
Median maize yields recorded on farmers’ fields are highest in the Central lowland zone (2.43 t ha−1), relative to the Western highland (2.02 t ha−1) and Eastern highland zones (1.89 t ha−1) (Figure 5). Median wheat yields are similar in the Eastern highland (1.93 t ha−1) and Central lowland zones (1.94 t ha−1), whereas they are lowest in the Western highland zone (1.65 t ha−1).
Frequency distribution of the actual yield levels of maize and wheat in the three HFZs based on the survey data from CSA for 2004–2009 (n = 10,756). Grain yield is measured after sun-dried to a constant weight level.

Relatively more maize than wheat fields received organic fertilizers (dominantly manure, and in a few cases compost). Out of the surveyed maize fields over six years in the CRV (n = 6527), 32% received only organic fertilizers, 17% only mineral fertilizers, and 5% received both. Of the surveyed wheat fields during 2004–2009 (n = 4213), 5% received only organic fertilizers, 66% only mineral fertilizers, 2% received both. A large proportion of maize (46%) and wheat (27%) fields did not receive any fertilizer.
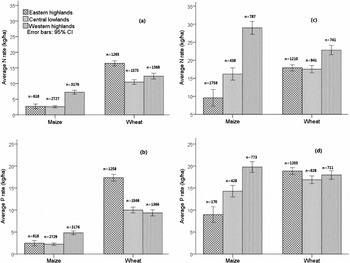
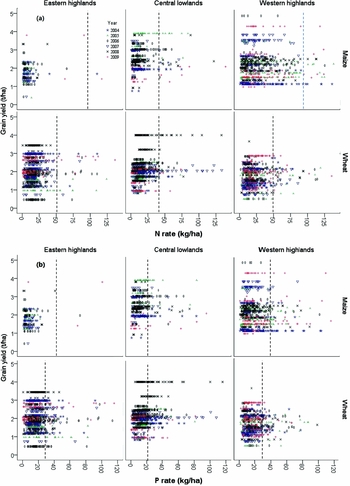
The overall average N and P mineral fertilizer application rates on maize and wheat fields in the CRV were generally low (2.6–16.5 kg N ha−1 and 2.2–17.3 kg P ha−1 across HFZs and crops), but relatively higher for wheat than for maize across HFZs (Figures 6a and b). The N and P application rates on maize were highest in the Western highland zone, while for wheat the rates were highest in the Eastern highland zone (Figures 6a and b). Taking into account only those fields that received mineral fertilizers, the average N rates were below 30 kg ha−1, which is much less than the recommended rate of 100 kg ha−1 for maize in Eastern and Western highlands. Actual P application rates in the fields that received mineral P were near 20 kg ha−1 across HFZs and crops (Figures 6c and d), which is close to the recommendation (Table 1).
Farmers’ N and P fertilizer rates in maize and wheat in the three farming zones of CRV based on survey data (CSA, 2004–2009): (a) Average N rate based on all fields; (b) average P rate based on all fields; (c) average N rate of fields that received N fertilizer; and (d) average P rate of fields that received P fertilizer.

Yield gap
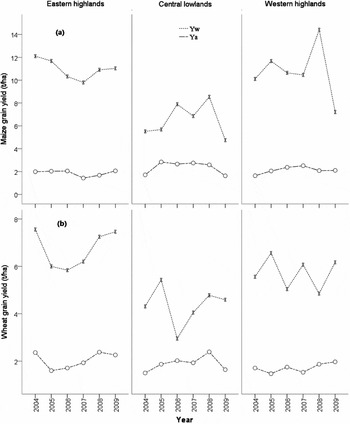
Trends in Y a, Y w and Y g: For both crops, Yw, estimated from NVTs, was more variable across years than Y a (i.e. CVs of Y w were ca. 28% for maize and 22% for wheat, and that of Y a were ca. 20% for maize and 16% for wheat; Figure 7). We did not find a significant association between seasonal rainfall and Y w (data not shown).
Trends in actual and water-limited yield of (a) maize and (b) wheat in the three homogeneous farming zones of CRV from 2004–2009.

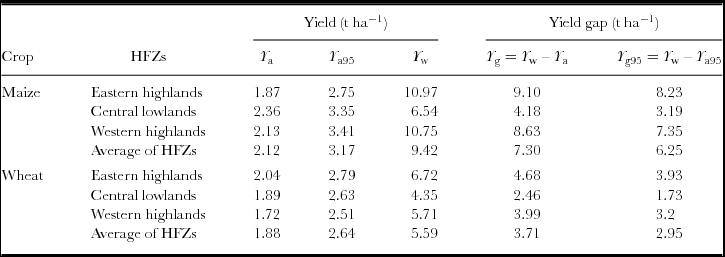
The CRV average Y a (Table 4) of maize (2.12 t ha−1) was close to the national average (Central Statistics Authority (CSA), 2007), and that of wheat (1.88 t ha−1) was larger than the national average for the same period (2004–2009), i.e. 2.10 and 1.62 t ha−1 for maize and wheat respectively. The percentage of Y a relative to Y w in the CRV was generally low, indicating a wide yield gap. This percentage was highest in the Central lowland zone (36% and 43% for maize and wheat respectively) compared with 17% (maize) and 30% (wheat) in the Eastern highland, and 20% (maize) and 30% (wheat) in the Western highland zones. The Central lowland zone is characterized by the lowest Y w and Y g for both crops (Figure 7; Table 4). Average maize yield from the best performing farmers (Y a95) was about 1 t ha−1 higher than Y a in all HFZs, whereas for wheat, the difference was about 0.8 t ha−1. This indicates that for both crops there is much scope for yield improvement also for the best performing farmers.
Average actual yield (Y a), yield of best performing farmers, water-limited yield (Y w) (2004–2009) and yield gaps (Y g) for maize and wheat in three HFZs of CRV in Ethiopia.
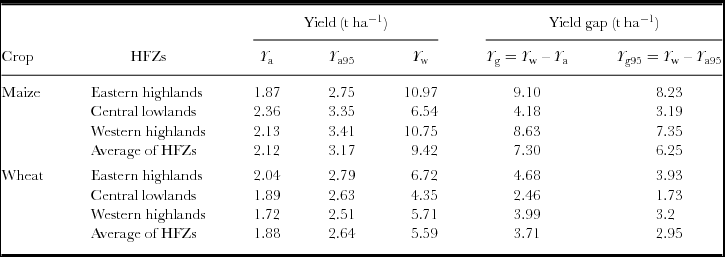
Y a95: 95th percentile of farmers’ yield; Y g: yield gap between water-limited and actual yields; Y g95: yield gap between water-limited and best farmers’ yield (represented by 95th percentile of farmers’ yield) levels.
Resource use efficiency
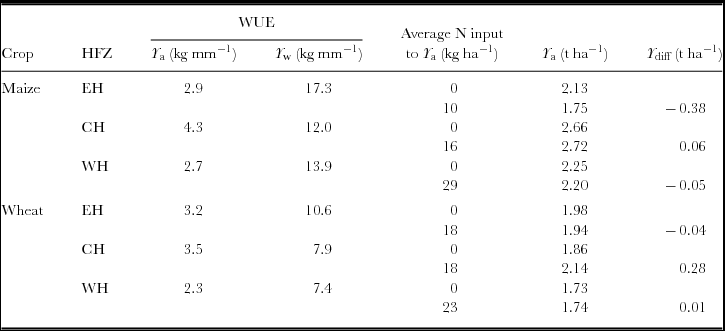
The WUE of Y a across HFZs ranged between 2.7kgha−1mm−1 and 4.3 kg ha−1 mm−1 of seasonal rainfall for maize, and between 2.3 kg ha−1 mm−1 and 3.5 kg ha−1 mm−1 for wheat. Compared with this, the WUE associated with Y w was much higher, i.e. 12–17.3 kg ha−1 mm−1 for maize and 7.4–10.6 kg ha−1 mm−1 for wheat (Table 5). The WUE of Y a was higher in the Central lowland zone, where seasonal rainfall was lower, than in Eastern and Western highland zones.
Rain water use efficiency for actual (Y a) and water-limited (Y w) maize and wheat yields, and actual maize and wheat yields of fields with and without N application in three HFZs of CRV in Ethiopia.
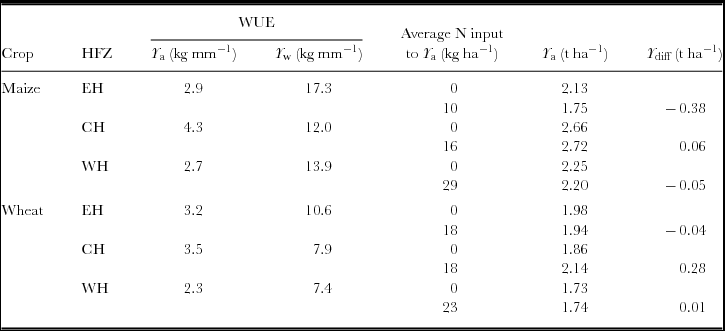
The yield difference between fields with mineral N application and fields without N application was very small in most HFZs, and even negative in some HFZs (Table 5). Approximately 95% of the wheat and maize fields that received mineral fertilizer received less N than the recommended fertilizer rate, whereas ca. 80–93% (ranging between HFZs) of maize and 75–85% of wheat fields received less P than the recommended rate (Figure 8). There was a large variation in nutrient application rates and yield within and between years, and no clear relationship between mineral N and P application rates and yields (Figure 8). However, farmers who applied the locally recommended N rate or more (right of the vertical line in Figure 8) obtained some yield gain in most HFZs. The yield gain was 22% in Eastern highlands and 6% in Central lowlands for maize; and 28% in Central lowlands and 7% in Western highlands for wheat as compared with the farmers that applied less than the recommended rate. There was no yield increase for maize in Western highlands and wheat in Eastern highlands.
Scatterplots of actual nutrient application rates and grain yields of maize and wheat in three HFZs of CRV in Ethiopia. (a) N, and (b) P. Dashed vertical lines indicate the N and P application rates used in experimental plots of NVTs across HFZs based on the ‘blanket recommendation rates’ of N and P.

The average mineral N and P application rates of Y a95 were significantly higher than the rates used by the average farmer population (p < 0.001) for both maize and wheat fields. On average, best performing farmers applied ca. 8–20 kg N ha−1 and 5–21 kg P ha−1 (ranges across HFZs and crops). For example, on wheat, the N application rate was ca. 20 kg ha−1 for Y a95 as compared with 12 kg ha−1 for Y a.
Out of the maize and wheat fields for which the erosion status was recorded (n = 8494), about 60% were perceived by farmers to have soil erosion problems. Furthermore, about 67% of the maize and wheat fields that received mineral N were reported to have soil erosion problems, indicating that N application may be confounded with the perceived erosion status of the field, i.e. farmers prioritize fertilization of fields with erosion problems.
DISCUSSION
Yield gaps and scope for production increase
Our estimates of Y a, ranging across HFZs between 1.9 t ha−1 and 2.4 t ha−1 for maize and 1.7 t ha−1 and 2.0 t ha−1 for wheat, are in a good agreement with other estimates (Adimassu et al., Reference Adimassu, Kessler, Yirga and Stroosnijder2013; GYGA, 2014; Howard et al., Reference Howard, Crawford, Kelly, Demeke and Jeje2003; Kassie et al., Reference Kassie, Van Ittersum, Hengsdijk, Asseng, Wolf and Rötter2014b). Average yield gaps in maize (7.3 t ha−1) and wheat (3.7 t ha−1) in the CRV are large. Yield gap varies across years and HFZs in the CRV, which is mainly associated with the variable Y w (rather than Y a). In NVTs, nutrients and pests and diseases are controlled so that the effects of seasonal rainfall variability on Y w are more pronounced. Furthermore, Y a is the average of a large number of fields (Table 1), whereas Y w is derived from a limited number of experiments. There was no relationship between rainfall and Y w, which may be because climate parameters were derived from a single representative weather station per HFZ, whereas yield data from several experimental stations were used (Table 1).
Lower rainfall and higher temperature in the Central lowlands result in lower Yw, and hence lower yield gap for both crops as compared with other HFZs. Furthermore, maize Y a (also as a percentage of Y w) is relatively high (Table 4), as in this zone, maize is the major food crop (Table 6) that receives relatively good management, such as weed control.
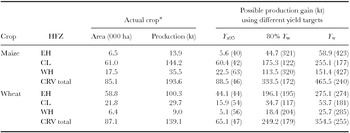
Potential for production increase of maize and wheat in three HFZs of CRV in Ethiopia as a result of achieving different target yields, i.e. best farmers’ yield (Y a95), 80% of the water-limited yield (80% Y w) and water-limited yield (Y w). The percentage gain values relative to actual production are given in parentheses.

*Actual crop area is the total area allocated to maize and wheat in each HFZ of CRV, and the total production from the respective area (IFPRI, 2006).
Possible production gains at various target yield levels are calculated based on the respective yield gap (Table 5).
The ‘80%’ of Y w is the so-called exploitable yield gap (Cassman et al., 2003; Van Ittersum et al., Reference Van Ittersum, Cassman, Grassini, Wolf, Tittonell and Hochmand2013).
Maize yield gap for the Central lowlands in this study (4.2 t ha−1) was a bit lower than 4.7 t ha−1 and 5.5 t ha−1 at Melkassa and Zeway, respectively, estimated from a model and average farm yields from reports (Kassie et al., Reference Kassie, Van Ittersum, Hengsdijk, Asseng, Wolf and Rötter2014b). Our estimated maize yield gap (Table 4) is within the range of calculated yield gap in the Global Yield Gap Atlas (GYGA: www.yieldgap.org; 6.4–10.4 t ha−1) except for the Central lowlands, for which yield gap is considerably lower in our study. Our estimated yield gap for wheat (Table 4; 2.5–4.0 t ha−1) is lower in all HFZs than in GYGA (5.2–7.6 t ha−1), pointing at sub-optimal conditions in the NVT trials, particularly with respect to fertilization, both in terms of types of nutrients (only N and P) and quantities (see Material and Methods section).
Across the HFZs, Y a is only ca. 17–36%, and 30–43% of Y w for maize and wheat respectively. Increasing Y a to a level equivalent to Y a95 narrows the yield gap of both maize and wheat by ca. 10–15%. Although the percentage looks small, the difference between Y a and Y a95 is significant, and is related to a higher N and P input use in Y a95 fields for both crops (p < 0.001). For example, the N application rate for wheat was ca. 20 kg ha−1 for Y a95 as compared with 12 kg ha−1 for Y a.
Applying locally recommended N rates or more under current farmers’ management (right of the vertical line in Figure 8) narrowed the maize and wheat yield gap by less than 5% in most HFZs. For wheat in the Central lowlands, ca 22% of the yield gap can be narrowed by applying the recommended N rate (or more). For maize in the Western highlands and wheat in the Eastern highlands, where the actual N rates were relatively larger (Figure 6), the yield gap remained the same for farmers who applied the locally recommended N rate or more, and for farmers who applied less than the recommended N rate.
The large remaining part of the yield gap results from differences between farmers’ fields and experimental fields in terms of crop management practices, including differences in varieties, seed, planting (date, method and density), weeds, pests and disease control, and timing of farm operations. Unlike experiments with improved open pollinated (OPV) and hybrid varieties from good quality seed, most farmers use local varieties, a few farmers use improved OPV (mostly recycled seed), and very few use hybrids. Contrary to experiments with timely and row planting, farmers typically broadcast seeds (particularly wheat) and delay sowing because of competition for scarce resources (e.g. family labour and draught power), and the fear for early season dry spells. Such delay in planting often reduces the yield and RUE, and farm resource limitations (e.g. labour, equipment, capital) further impede overcoming yield reducing factors (e.g. weeds, pest and diseases) compared with the experimental fields where skilled labour and chemicals are used for crop protection. In this respect, the best performing farmers, who achieve significantly smaller yield gaps than their ‘average neighbours’ may illustrate how higher nutrient input and better crop management raise yields. Taking the actual crop area (IFPRI, 2006), and maize and wheat yields in each HFZ as a benchmark, lifting Y a to Y a95 or to the exploitable yield level (80% of Y w; Cassman et al., Reference Cassman, Dobermann, Walters and Yang2003; Van Ittersum et al., Reference Van Ittersum, Cassman, Grassini, Wolf, Tittonell and Hochmand2013) would result in a 50 to 175% production gain respectively. Attaining the Y w level would result in a production increase of 240% for maize and 255% for wheat (Table 6) in the CRV. Enormous investments are required in human capacity, infrastructure and agricultural technology to attain this increase. This, however, remains difficult under the current socioeconomic conditions in which more than 50% of the crop farmers own less than 1 ha of land (IFPRI, 2006), ca. 90% of the fields are cropped with local seed, 50–60% of the households are illiterate and many farmers have limited financial capacity to purchase inputs (IFPRI, 2013). Clearly, under variable rainfall conditions it is also risky to increase input levels.
Resource use and resource use efficiency
The rain WUE of Y a is much lower than that for Y w in the CRV. Although the rainfall amount available for NVT fields and farmers’ fields may be the same, better crop management in NVT fields (e.g. timely operations and input use; proper drainage where necessary) favours crop growth, and thus efficient use of water. Hence, if nutrient and other crop management practices are improved to the level of experimental plots, the WUE could be approximately three to six times higher for maize, and two to three times higher for wheat, depending on the HFZ. The Central lowlands is characterized by lower Y a levels but higher associated WUE than the highlands, where water is less limiting. In the lowlands, any additional water results in a higher yield increase compared with the high rainfall areas.
Probably associated with financial and access problems (Adimassu et al., Reference Adimassu, Kessler, Yirga and Stroosnijder2013), many farmers’ fields did not receive mineral fertilizers. However, the yield difference between fields with and without mineral fertilizer input is very small, and even negative in some HFZs. The first reason for this could be potassium (K) or sulphur (S) limitation causing a poor response to N and P (Astatke et al., Reference Astatke, Mamo, Peden and Diedhiou2004; Mengistu and Waktola, Reference Mengistu and Waktola2014). Secondly, non-fertilized fields may have a higher intrinsic soil fertility than fertilized fields. Farmers’ fertilizer allocation might have compensated this difference, leading to the apparent absence of a nutrient response. This hypothesis is supported by a significant (p < 0.001) association between perceived soil erosion problems and fertilizer application, i.e. fields with perceived erosion problems received more fertilizer than fields without erosion. Soil erosion is a major cause of nutrient depletion (Haileslassie et al., Reference Haileslassie, Priess, Veldkamp, Teketay and Lesschend2005), leading to partial loss of the applied N and P, and some other nutrients (e.g. K), indicating the third reason for small yield response to fertilizer. Therefore, information on erosion status should be utilized in nutrient recommendations and management. The fourth reason is that mineral N rates were far below the recommendation (Figure 8), i.e. 10–40% (depending on HFZs) of the recommended rate for maize, and 35–45% for wheat, whereas the average P application is closer to the recommended rate (60–90%). For achieving current yield levels (Y a in Table 4) without further depleting soil nutrient stocks, an application of at least 95–118 kg N ha−1 and 28–40 kg P ha−1 is needed, assuming an average harvest index of 0.4 (Worku and Zelleke, Reference Worku and Zelleke2007) and recovery fractions of 0.4 (N) and 0.17 (P) for maize and wheat respectively. This application rate corresponds with the recommendation of Molla (Reference Molla2013), who estimated that 100–130 kg N ha−1 and 10–30 kg P ha−1 is needed for wheat production in the Central highlands of Ethiopia.
Data for yield and resource use analysis in Ethiopia
Within the Ethiopian agricultural research system, an enormous amount of crop and variety data are collected annually from NVTs and demonstration plots across the country. The management of collected data, however, is poor and is left in the hands of individuals, resulting in data loss and poor accessibility. In this study, we were able to retrieve some of these data from different sources and used the same to assess yield gaps and benchmark agricultural production. The research system in Ethiopia, therefore, (1) needs to establish a database management system so that the available data can be exploited for various purposes, in addition to the purpose for which they were initially designed; and (2) should conduct non-nutrient-limited NVTs with more site-specific fertilizer rates so that yield truly represents Y w.
In spite of its comprehensiveness, the CSA survey data suffered from changes in administrative (district and zonal) boundaries and inconsistencies in variable names across years, hampering automatic data queries and time-series analysis. In this study, we improved data consistency to enable time series analysis through spatial reassignment of farm data, and standardized variable names using the original CSA field books. Due to lack of capacity or access problems, data in the region are underutilized (Coe and Stern, Reference Coe and Stern2011). Therefore, with careful handling of aforementioned data-related limitations, the annual CSA survey data covering a range of crops and production areas can be used for similar analyses on other crops and agro-ecologies in Ethiopia.
We cannot rule out the possibility of errors related to data collection methods: (1) Data on type and quantity of fertilizer were obtained through a survey; and (2) farmers use local measurement tools/units to allocate fertilizers to small plots. The yield is normally measured by harvesting a quadrant by trained data collectors. Hence, we expect that errors are larger for fertilizers than for yield data.
CONCLUSIONS AND RECOMMENDATIONS
There is an enormous yield gap and huge opportunity for yield increase through intensification and improved agronomic management in the CRV. The scope for production increase is generally higher in the Eastern and Western highlands than in the Central lowlands. Since the current rates of fertilization are far below the recommendations, the potential to improve yields through higher fertilizer use seems obvious. However, the fact that our data reveal limited response to increasing nutrient application illustrates the importance of interacting management and environmental factors.
The experimental research data and the survey data can be used for yield gap and related farming system analysis. We recommend that the CSA includes some agronomically important variables such as planting and harvesting dates, more complete fertilization information, varieties and plant density and crop protection details for better informed decision-making.
While the potential for yield gap closure seems large in the CRV, future studies are required to explore the effects of different agronomic management options and their combinations on yield gap closure. Furthermore, enormous investments are required in human capacity, infrastructure and agricultural technology. In addition, land use change in CRV has already affected the basin water balance (Getnet et al., Reference Getnet, Hengsdijk and Van Ittersum2014), and therefore the hydrological consequences of production increase through intensification need to be analysed carefully, and especially management options that combine high productivity and high WUE need to be identified.
Acknowledgements
This project has been financed through the partnership program of the Dutch Ministry of Foreign Affairs/General Directorate for International Cooperation and Wageningen University and Research Centre as part of the project ‘Improving livelihood and resource management in Central Rift Valley of Ethiopia’. We acknowledge the Ethiopian Institute of Agricultural Research (EIAR) and the maize and wheat researchers, in particular, for sharing experimental data and their support. We thank the Central Statistical Authority in Ethiopia for providing agricultural survey data, and the National Meteorological Agency for providing climate data.