Implications
Blending two feeds that, when combined in variable ratios, met the requirements of pigs throughout their entire growing–finishing period was successfully used to implement a daily-phase feeding system. Feeding growing–finishing pigs with daily multiphase feeding systems can reduce, without limiting growth, feed costs by 1.0%, N intake by 7.3% and N excretion by 12% in comparison with three-phase feeding systems. Further studies are required to properly estimate animal requirements and the pigs’ ability to maintain mineral retention without any effect on feed intake and body growth.
Introduction
The concentration of much of the feeder hog industry in certain geographical areas can markedly increase the environmental load, given the application of excessive levels of manure to the land. The environmental impacts of the land application of manure involve the risk that soil and water will be polluted by nitrates, P, organic matter, microorganisms and trace elements, as well as the risk that the greenhouse gases carbon dioxide, methane and nitrous oxide will be released into the air (Lesschen et al., Reference Lesschen, van den Berg, Westhoek, Witzke and Oenema2011). Excessive application of some of these elements and their subsequent concentration in soil and water have reached marked levels in some Canadian regions, especially Quebec and Ontario, as well as in the United States and some European areas (Brittany in France, western Belgium, southeastern Netherlands, etc.). Restrictions on manure application are being introduced in many Canadian areas, forcing the livestock industry to balance the amount of nutrients applied to soils against the amount extracted by crops.
Reducing the excretion of excess nutrients such as N and P and restricting the use of non-renewable resources are essential components in the development of sustainable pig production (Jondreville and Dourmad, Reference Jondreville and Dourmad2005). How much N or P is excreted depends mainly on how much N or P is ingested, how metabolically available the N or P is and how the N or P supply by the feed is balanced against the animals’ requirements. To minimize excretion, it is essential to properly characterize the composition of the raw materials, their nutritional potential and the animals’ requirements, and to accurately adjust the nutritional content of the feed to these requirements (Pomar and Pomar, Reference Pomar and Pomar2012).
Given that the optimal concentration of nutrients in the diet progressively decreases during the growth period (National Research Council (NRC]) 1998), one way to reduce N and P excretions is to concomitantly adjust the dietary concentration of nutrients to match the animals’ requirements (Bourdon et al., Reference Bourdon, Dourmad and Henry1995). The economic and environmental benefits of this concomitant nutrient adjustment increases with the number of feeding phases, as simulated by Letourneau Montminy et al. (Reference Letourneau Montminy, Boucher, Pomar, Dubeau and Dussault2005) and Brossard et al. (Reference Brossard, Quiniou, Dourmad, Salaün and van Milgen2010) and demonstrated by Beers et al. (1991, cited in van der Peet-Schwering et al., Reference van der Peet-Schwering, Jongbloed and Aarnink1999), Bourdon et al. (Reference Bourdon, Dourmad and Henry1995), van der Peet-Schwering et al. (Reference van der Peet-Schwering, Verdoes and Beelen1996) and others. However, increasing the number of feeding phases complicates feed management and sometimes increases facility costs. The development of feeding systems that allow blend feeding and the automatic distribution of two feeds that, when combined in variable ratios, can meet the requirements of pigs throughout their growing period (Feddes et al., Reference Feddes, Ouellette and Leonard2000) makes the phase-feeding technique promising again, because nutrient excretion can be significantly reduced without increasing feeding costs (Letourneau Montminy et al., Reference Letourneau Montminy, Boucher, Pomar, Dubeau and Dussault2005). The feeds can be complete diets formulated to satisfy the requirements of pigs at the beginning and at the end of their growing period (Bourdon et al., Reference Bourdon, Dourmad and Henry1995). Feeding with two feeds may also be seen as a promising option for feed companies, as it means that there are just two feeds to prepare, with only the proportions changing between the feeding phases and between farms (Pomar and Pomar, Reference Pomar and Pomar2012).
Therefore, the objective of the present study was to assess, under experimental conditions, the animal responses and environmental impacts of a daily multiphase feeding system in comparison with those of a traditional three-phase feeding (3PF) system. In addition, feed costs, nutrient ingestion and nutrient excretion for the average experimental pig fed under the two feeding strategies were simulated to evaluate potential economic and environmental impacts.
Material and methods
Animal experiment
Animals and management
For this experiment, 104 female synthetic-line pigs (F20×V-300; Genetiporc Inc., Saint-Bernard, QC, Canada) weighing ~18.0±2.0 kg BW were received at the Agriculture and Agri-Food Canada research center in Sherbrooke, QC, Canada. The animals were kept together upon their arrival and were fed a commercial medicated starter diet. One week after their arrival, the pigs were weighed and randomly assigned to 1 of 8 pens, each housing 13 animals. The pens were randomly assigned to treatments at the beginning of the experiment, which started ~15 days after the pigs’ arrival (day 1) and ended 83 days later (day 84). One pig per pen was removed on day 56 to bring pen size to the standard value of 12. Owing to operational reasons, only 10 of these 12 animals of each pen (randomly chosen at the beginning of the experiment) were used for body composition measurements. The two extra pigs stayed in their pens until the end of the experiment to maintain the standard pen size. Room temperature was set at 22°C upon the pigs’ arrival and was reduced by ~0.5°C every week until 18°C was reached. The pigs had free access to feed and fresh water throughout the experiment and were cared for according to a recommended code of practice (Agriculture and Agri-Food Canada, 1993) and the guidelines of the Canadian Council on Animal Care (1993).
Feed intake was measured for each animal daily throughout the experiment using an automated recording system (IVOG system; Insentec B.V., Marknesse, The Netherlands), and the animals were weighed without fasting every 2 weeks. Total body fat, lean, bone mineral content and bone mineral density were measured by dual-energy X-ray absorptiometry (DXA) (DPX-L; Lunar Corp., Madison, WI, USA). The pigs were scanned in a lateral position in slow mode according to the manufacturer’s recommendations. Data from the scans were analyzed using the adult program (DPX-L version 4.7e), with most of the body placed in the leg region as previously suggested (Pomar and Rivest, Reference Pomar and Rivest1996). The pigs were fasted for no less than 6 h and no more than 12 h before the scan to prevent vomiting. The pigs were anesthetized by intramuscular injection of atropine sulfate at 0.05 mg/kg, xylazine (rompun) at 2 mg/kg, and ketamine (rogarsetic) at 20 mg/kg. Isoflurane was applied by mask at the maximum dose of 2% to maintain anesthesia. After scanning, the pigs were awakened in a quiet room and then placed in their respective pens. Because of the duration of these measurements and to avoid manipulating pigs from all pens every day, only the 10 selected pigs from each pen were measured the same day, and therefore each pen started the experiment on a different calendar day. The experiment started for each pen on the day after the first DXA measurement (experimental day 1) and ended after the second DXA measurement (experimental day 84) for a total experiment length of 83 days. The DXA measurements were taken from Monday to Thursday for 2 weeks in succession, ensuring that treatment pens were measured alternatively. At the first and last day of the experiment, pens were scanned by DXA in the same order to ensure that the experiment lasted 83 days. On days 1, 28, 56 and 84 of the experiment, backfat thickness and muscle depth were measured using a B-mode ultrasound device (Ultrascan 50; Alliance Médicale Inc., Montreal, Canada; 120 mm, 3.5 MHz) at the Canadian carcass classification site, that is, between the third-last and fourth-last ribs at 5 cm from the midline. The pigs were slaughtered after the experiment in a commercial slaughterhouse.
Diets
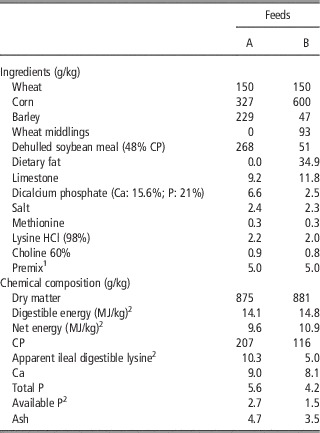
The experiment used two feeds (A and B; Table 1), which were prepared according to the formulation method proposed by Letourneau Montminy et al. (Reference Letourneau Montminy, Boucher, Pomar, Dubeau and Dussault2005). In this method, the two feeds are formulated simultaneously, minimizing feed costs and ensuring that the blend of these feeds can satisfy the pigs’ requirements throughout the growing period. No environmental constraints were included in the formulation of feeds. The total nutrient composition and digestible nutrient composition of the ingredients were those defined by the INRA-AFZ feedstuff tables (Sauvant et al., Reference Sauvant, Perez and Tran2004). The nutrient requirements of the pigs were calculated a priori by simulation for each day according to the method proposed by the NRC (1998). The simulated animals were female pigs with a protein growth potential adjusted to represent the growth performance observed for these pigs in a commercial environment (D. Boyaud; Aliments Breton Inc., Saint-Bernard, QC, Canada, personal communication). Feeds A and B were formulated using a fixed composition of 15% hard wheat (11% CP) to ensure a high-quality pellet. Soybean meal was used as the main source of protein, and wheat, corn and fat were the main sources of energy. Synthetic lysine and methionine were used to improve the amino-acid balance of the dietary protein. The mineral and vitamin contents were formulated to meet the animals’ requirements with a strong potential for protein deposition. The two feeds used in this experiment did not use feed by-products, so that nutrient composition variability and potential interactions with the experimental treatments would be reduced.
Ingredient composition of the experimental diets as fed basis

1 Per kilogram of feed A, the premix provided the following nutrients: vitamin A, 9900 IU; vitamin D, 990 IU; vitamin E, 30 IU; vitamin K (menadione), 0.78 mg; vitamin B12, 0.02 mg; niacin, 14 mg; pantothenic acid, 11.57 mg; pyridoxine, 0.83 mg; riboflavin, 3.17 mg; thiamine, 1.26 mg; choline, 480 mg; copper, 121 mg; iodine, 0.29 mg; iron, 361 mg; manganese, 85 mg; selenium, 0.3 mg; zinc, 164 mg. Per kilogram of feed B, the premix provided the following nutrients: vitamin A, 7500 IU; vitamin D, 750 IU; vitamin E, 22 IU; vitamin K (menadione), 0.68 mg; vitamin B12, 0.02 mg; niacin, 11 mg; pantothenic acid, 10.5 mg; pyridoxine, 0.4 mg; riboflavin, 2.68 mg; thiamine, 0.99 mg; choline, 400 mg; copper, 107 mg; iodine, 0.24 mg; iron, 247 mg; manganese, 65.5 mg; selenium, 0.3 mg; zinc, 133 mg.
2 Values calculated using INRA-AFZ tables (Sauvant et al., Reference Sauvant, Perez and Tran2004).
Feeds A and B were blended according to a 3PF program or a daily-phase feeding (DPF) program, In the 3PF program, feeds A and B were blended in the same proportions on each day of the three 28-day feeding phases in the following proportions: 100% and 0% in phase 1, 63% and 37% in phase 2, and 32% and 68% in phase 3 for feeds A and B, respectively. These feed proportions were calculated to meet the animals’ requirements at the beginning of each feeding phase.
The proportions of feeds A and B changed daily in the four pens assigned to the DPF program and were established in such a way that the pigs in each pen received a complete diet in which the minimum concentration of nutrients met the nutritional requirements that were calculated for the treatment group on that experimental day. Thus, on days 1, 28 and 56 of the experiment, the animals in both feeding programs received the same blend of feeds A and B.
The feeds for the two groups of animals were blended using an automatic blender and distribution system developed especially for this project (Performixx Robotic Inc., Coaticook, QC, Canada). Briefly, when the reservoir of a pen’s feeder reached a pre-determined minimum level, the feeder made a request to the blender, which then blended, when available, 10 kg of feed according to the treatment and the day of the experiment. An automatic distribution system then carried the mixture to the corresponding pen. The blend formula was changed every day at midnight when required.
Sampling and chemical analyses
All feed A and feed B required for the experiment were delivered to the research center shortly after the animals’ arrival. Representative samples of the feeds were taken upon delivery and once weekly throughout the experiment. The weekly samples were mixed together at the end of the experiment to obtain a representative composite sample. Once weekly, two different treatment feeders were sampled to verify that the correct mixture had been served to each pen. Dry matter and total N in the mixed diet were used to verify the accuracy of the mixer. The composite samples of feeds A and B were analyzed following Association of Official Analytical Chemists (AOAC) standard methods for lyophilization (Method 938.18) and for determination of total protein (Method 992.15), lipids (Extraction Method 991.36), dry matter (Method 950.46) and ash (Method 920.153) (AOAC, 1990). The Ca and P concentrations in the samples were obtained by colorimetric methods and atomic absorption (AOAC, 1990).
Statistical analyses
Daily or interval feed intake was obtained by adding the consumed feed per pig and per meal during each day or growth interval. Weight gain was obtained by determining the difference between the weights measured at the end and at the beginning of each growth interval. Total body protein and lipids at the beginning and at the end of the experiment were obtained by converting the muscle and fat values obtained with DXA into their protein and lipid chemical body components as proposed by Pomar and Rivest (Reference Pomar and Rivest1996). Body P was estimated by assuming that this element constitutes 25% of the bone mineral content according to previous observations from our group (unpublished data). All of these values together were then used to calculate the different conversion rates and feed efficiencies. All data were analyzed according to a completely randomized design using the MIXED procedure of the SAS software package (SAS Institute Inc., Cary, NC, USA). In all cases, pens were considered to be the experimental unit, but the results are reported on an animal base to facilitate interpretation.
Feed-cost simulation study
To compare feed costs in commercial conditions, new feed formulas were obtained using the list of feed ingredients and prices recorded at the beginning of each month from November 2010 to October 2011 by a feed manufacturer (Aliments Breton Inc). These feed ingredient costs were assumed to be representative of the costs in the North American economic context. For simplicity, feed fabrication, storage and transportation costs, as well as farm feed storage and distribution costs, were not considered in this study.
The ingredient composition values used in this feed-cost simulation study were taken from NRC (1998). Feeds were formulated to satisfy or exceed the a priori estimated animal requirements used in the animal experiment. Animal growth was therefore not expected to be affected by the nutrients provided by the proposed feeding alternatives.
Four feeding alternatives were obtained by combining the two feed-fabrication methods (complete and blended) with the two phase-feeding programs (3PF and DPF), which are described later in this paper. Complete feeds (CFs) were formulated to contain all the required nutrients, whereas the two feeds used for blend feeding were formulated to contain complementary amounts of nutrients in such a way that when blended, the feeds become complete diets.
In contrast with the previously described experimental feeds, the feeds in this simulation study included hard wheat, fats, meat meal, corn, barley, canola meal and wheat shorts to better represent the cost of commercial diets. However, these ingredients were limited to 40%, 5%, 3%, 60%, 60%, 5% and 25% in the feeds, respectively. Requirements for digestible energy, apparent ileal digestible essential amino acids, total Ca and available P were calculated. Digestible energy values were preferred in this feed-cost study to measure energy requirements, because the differences between treatments in the animal experiment were smaller for digestible energy intake than for net energy intake.
In this feed-cost simulation study, digestible energy concentration in feeds was fixed at 14.2 MJ/kg. It was also assumed that voluntary feed intake is driven primarily by the capacity of the animal to utilize dietary energy or, equivalently, to satisfy energy requirements for maintenance and growth. Although it is not evident whether requirements or metabolic capacity determine the final amount of feed consumed, this approach has been successfully used in earlier (Whittemore and Fawcett, Reference Whittemore and Fawcett1976) and more recent (van Milgen et al., Reference van Milgen, Valancogne, Dubois, Dourmad, Sève and Noblet2008) pig growth models and in the present study.
For calculation purposes, T is the number of feeding phases (T=3 for the 3PF program and T=84 for the DPF program) and x(t) the formulation at phase t, that is,
 $$x(t)=\left( {x_{1} (t),...,x_{n} (t)} \right)$$
, where x
j
(t) is the amount of the j
th ingredient in 1kg of feed. It was established that any complete or blended feed (BF) at phase t of this study must satisfy the estimated nutrient requirements. As well, S(t) is used to denote the set of all possible feeds that satisfy all the requirements at phase t. For this problem,
 $$x(t)\in S(t)$$
is equivalent to the following set of constraints on x(t):
 $$\left\{ \openup 5pt\matrix{ {x_{j} (t) \,⩾\, 0} \hfill & {(j=1,...,n)} \hfill \cr {\mathop{\sum}\nolimits_{j=1}^n {x_{j} (t)} =1} \hfill & {} \hfill \cr {\mathop{\sum}\nolimits_{j=1}^n {e_{j} x_{j} (t)} =3.4} \hfill & {} \hfill \cr {x_{i} (t)\,⩽\, \overline{{u_{j} }} (t)} \hfill & {(i\in \tilde{U})} \hfill \cr {\mathop{\sum}\nolimits_{j=1}^n {aa_{{l,j}}^{{{\rm dig}}} x_{j} (t)} \,⩾\, \overline{{aa}} _{l} (t)} \hfill & {(l\in \tilde{L})} \hfill \cr {\overline{b} _{{{\rm min},i}} (t)\,⩽\, \mathop{\sum}\nolimits_{j=1}^n {a_{{i,j}} x_{j} (t)} \,⩽\, \overline{b} _{{{\rm max},i}} (t)} \hfill & {(i\in \tilde{N})} \hfill \cr {\overline{{cp}} _{{{\rm min}}} (t)\,⩽\, {{\mathop{\sum}\nolimits_{j=1}^n {a_{{{\rm Ca},j}} x_{j} (t)} } \over {\mathop{\sum}\nolimits_{j=1}^n {a_{{{\rm Pdis},j}} x_{j} (t)} }}\,⩽\, \overline{{cp}} _{{{\rm max}}} (t)} \hfill & {} \hfill \cr } $$
where e
j
is the digestible energy concentration of ingredient j (MJ/kg);
 $$\overline{u} _{i} (t)$$
are, respectively, the restrictions imposed on the ingredient j in phase t;
 $$aa_{{l,j}}^{{{\rm dig}}} $$
and
 $$\overline{{aa}} _{l} (t)$$
are the l amino-acid composition of ingredient j and its requirement in phase t;
 $$\overline{b} _{{{\rm min},i}} (t)$$
and
 $$\overline{b} _{{{\rm max},i}} (t)$$
are the requirements and restrictions of nutrient i in phase t; a
i,j
is the nutrient i intake of ingredient j; and
 $$\overline{{cp}} _{{{\rm min}}} (t)$$
and
 $$\overline{{cp}} _{{{\rm max}}} (t)$$
are, respectively, the lower and upper levels of the Ca/P ratio, which can be expressed as the following two linear constraints
 $$\matrix{ {\mathop{\sum}\nolimits_{j=1}^n {(a_{{{\rm Ca},j}} {\minus}\overline{{cp}} _{{{\rm min}}} (t)a_{{{\rm Pdis},j}} )x_{j} (t)} \,\ges \, 0} \hfill \cr {\mathop{\sum}\nolimits_{j=1}^n {(a_{{{\rm Ca},j}} {\minus}\overline{{cp}} _{{{\rm max}}} (t)a_{{{\rm Pdis},j}} )x_{j} (t)} \, \les \, 0} \hfill \cr } $$
.
In addition,
 $\tilde{U}$
is the set of restricted ingredients,
 $\tilde{L}$
is the set of amino acids and
 $\tilde{N}$
is the set of nutrients. Pig feed can be obtained either by formulating a CF, which is a feed that will satisfy by itself all the specified nutrient requirements of the animals, or by formulating two (or more) feeds that when blended will provide the required nutrients. When formulating CF diets, a linear programming problem for each phase t has to be solved. Hence, for t=1, …, T, the problem is solved as follows:
 $$\left\{ {\matrix{ {z(t)=min \mathop{\sum}\nolimits_{j=1}^n {c_{j} x_{j} (t)} } \hfill \cr {\matrix{ {s.t.} \hfill & {x(t)\in S(t)} \hfill \cr } } \hfill \cr } } \right.$$
where c
j
is the unit cost of the jth ingredient. If q(t) represents the amount of feed intake using a mixture containing 14.2 MJ/kg in phase t, then the total cost is
 $$z=\mathop{\sum}\nolimits_{t=1}^T {q(t)z(t)} $$
. This is called CF-3PF for the formulated CFs in the T=3 phase-feeding formulation problem and CF-DPF for the formulated CFs in the T=84 daily-phase feeding problem. The CF-3PF alternative corresponds to the most common commercial feeding conditions in Canada and abroad. The CF-DPF alternative would likely minimize ingredient costs but is useless from a practical point of view, given that it requires T=84 different CFs. These feeding alternatives were included in the present simulation study for comparison purposes.
For the BF fabrication method, two feeds (
 $$A=\left( {A_{1} ,...,A_{n} } \right)$$
and
 $$B=\left( {B_{1} ,...,B_{n} } \right)$$
) were formulated, where A
j
and B
j
represent the amount of ingredient j in feeds A and B, respectively. Feeds A and B were formulated at minimum cost ($/kg). Feed A corresponded to the optimal diet for the 1st day of the growing period, and was the diet of the first phase or day for the CF-DPF alternative and the diet of the first phase for both the CF-3PF and BF-3PF alternatives. Feed B corresponded to the optimal diet for the last day of the growing period and was the diet of the last phase or day in the CF-DPF alternative. Then, for each feeding phase t,
 $$x(t)=\alpha (t)A{\plus}\left( {1{\minus}\alpha (t)} \right)B$$
with
 $$0\,⩽\, \alpha (t)\,⩽\, 1$$
, where the unknown is
 $$\alpha (t)$$
. Hence, T linear programming problems have to be solved, as follows:
 $$\left\{ {\matrix{ {z(t)=min \mathop{\sum}\nolimits_{j=1}^n {c_{j} \left( {\alpha (t)A_{j} {\plus}\left( {1{\minus}\alpha (t)} \right)B_{j} } \right)} } \hfill \cr {\matrix{ {s.t.} \hfill & {\left\{ {\matrix{ {0\,⩽\, \alpha (t)\,⩽\, 1} \hfill \cr {x(t)=\alpha (t)A{\plus}(1{\minus}\alpha (t))B\in S(t)} \hfill \cr } } \right.} \hfill \cr } } \hfill \cr } } \right.$$
The total feeding cost is
 $$z=\mathop{\sum}\nolimits_{t=1}^T {q(t)z(t)} $$
. The linear programming problems were formulated using AMPL (Fourer et al., Reference Fourer, Gay and Kernighan2002) and solved using the NEOS optimization server facilities (Czyzyk et al., Reference Czyzyk, Mesnier and More1998).
Results and discussion
Animal experiment
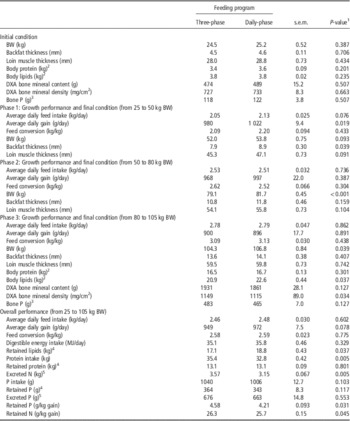
The pigs consumed feed and gained weight normally throughout the entire experiment. Three pigs were removed from the pens during the experiment for reasons not related to the treatments. On days 1, 28, 56 and 84 of the experiment the average BWs of the pigs were 24.8±1.0, 52.9±1.6, 80.4±1.7 and 105.5±2.1 kg, respectively. The automatic blender and distribution system provided to the pens the required feeds all over the trial. There was no significant difference (P>0.05) between the treatments at the beginning of the experiment with regard to BW, backfat thickness, muscle depth, and body and bone composition (Table 2).
Initial and final animal body condition and composition, animal growth performance, and calculated N and P excretions of growing–finishing pigs fed according to a three-phase or daily-phase feeding system

DXA=dual-energy X-ray absorptiometry.
1 ANOVA with two treatment groups analyzed as a randomized experimental design (MIXED procedure in the SAS software package) with pens considered the experimental units (13 pigs per pen, 4 pens per treatment). Results are reported in animal bases.
2 Estimated according to Pomar and Rivest (Reference Pomar and Rivest1996) from DXA measurements.
3 Estimated from DXA bone mineral content.
4 Calculated for each pig by determining the difference between final and initial body composition.
5 Calculated for each pig by determining the difference between intake and excretion.
Feed consumption
For the 83 experimental days of the experiment, there was no difference in feed consumption between the pigs in the 3PF program and those in the DPF program. However, during the first feeding phase, that is, between ~25 and 50 kg BW, the DPF pigs tended (P=0.08) to consume more feed (+1.0%) than the pigs in the 3PF program. This trend was not observed during the other two feeding phases.
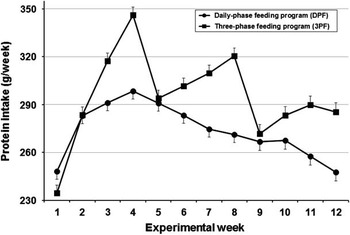
However, the feeding programs did affect the total consumption of certain nutrients. Digestible energy intake was not affected by the treatments, although the DPF group consumed on average 1.8% more digestible energy than the 3PF group. In contrast, the animals in the DPF group consumed 7.3% less protein (P<0.01) than those in the 3PF group, as a result of the progressive decrease in the amount of protein served during the course of the experiment (Figure 1). Furthermore, despite the fact that the concentration of total P in feed B was less than that in feed A (4.2 v. 5.6 g of total P per kilogram, respectively), the progressive decrease in P in the feed offered to the DPF pigs resulted in only a small difference in consumption (3.3%), which did not prove to be significant during the entire experimental period. However, the increased consumption of feed and energy during the first feeding phase in the DPF pigs, in comparison with the 3PF pigs, is more difficult to explain. It is generally accepted that pigs consume feed to maximize performance, but consumption may be restricted by gut capacity in pigs under 50 kg BW (Schinckel and de Lange, Reference Schinckel and de Lange1996; Möhn and de Lange, Reference Möhn and de Lange1998). In the present study, feed B had a higher energy concentration than feed A, and given that the DPF pigs tended to consume more feed than the 3PF group during the first feeding phase, with no effect on protein retention, these results do not seem to support the hypothesis that gastric capacity limits feed consumption in pigs that weigh <50 kg BW. Some authors (i.e. Emmans, Reference Emmans1981; Black et al., Reference Black, Campbell, Williams, James and Davies1986) suggested that pigs consume feed until the requirements of the most limiting nutrient is met. However, this ability to adjust feed intake has its limits, which are linked partly to the physical ability to ingest feed (Black et al., Reference Black, Campbell, Williams, James and Davies1986; Pomar and Matte, Reference Pomar and Matte1995; Whittemore et al., Reference Whittemore, Green and Knap2001). Increased feed intake by the DPF pigs as compared with the intake of the 3PF pigs would thus be the result of an essential nutrient being found in smaller quantities in feed B than in feed A, forcing the animals to overeat to meet their nutrient requirements. This same effect did not appear during the other two periods, and thus this hypothesis is unlikely. Other authors suggested that growing–finishing pigs have an appetite for energy-rich feeds and consume feed until their need for this nutrient is met (Pomar and Matte, Reference Pomar and Matte1995; NRC, 1998; Whittemore et al., Reference Whittemore, Green and Knap2001). The results of the present experiment do not corroborate this hypothesis either, because during the first feeding period, the DPF pigs consumed more feed and digestible energy (and net energy) than the 3PF pigs. Because the overeating of the DPF pigs in comparison with the intake of the 3PF pigs does not seem to be explained by the most frequently used mechanisms, other possible interpretations must be considered. The relationship between dietary energy and feed intake is governed by complex mechanisms that may vary between herds in interaction with many environmental factors (Beaulieu et al., Reference Beaulieu, Williams and Patience2009).
Total protein intake in experimental pigs fed according to a three-phase feeding (3PF) program or a daily-phase feeding (DPF) program.

Weight gain and body composition
Throughout the experiment, the animals fed according to the DPF program tended (P=0.08) to gain more weight (+2.4%) than those fed according to the 3PF program; this difference was mainly because of faster growth (P=0.02) during the first feeding phase. As for voluntary feed intake, BW gain was not affected by the treatments during the other two feeding periods. The DPF pigs were 2.5 kg heavier (P=0.04) at the end of the experimental period than were the 3PF pigs. This extra weight gain seems to have been in the form of lipids rather than protein. At the end of the first feeding phase, the DPF pigs had 0.9 mm more backfat (P=0.04) and 1.8 mm more muscle depth (P=0.09) than the 3PF pigs. At the end of the second and third experimental periods, the fat and muscle thicknesses were similar in both groups of pigs. Final body protein mass as estimated from DXA readings was not affected by the phase-feeding programs, but body lipid mass was 8% greater (P=0.04) in the DPF pigs than in the 3PF pigs. However, the feed conversion ratio was 2.58 on average and was not affected by the treatments during any of the feeding phases or the overall experimental period. The pigs fed in the DPF system ate 7.3% less protein than those fed in the 3PF system, and it has been shown that reducing CP intake in association with adequate amino-acid supplementation while providing similar levels of available balanced protein does not affect animal performance (Le Bellego and Noblet, Reference Le Bellego and Noblet2002). The reduced fatness observed in the 3PF pigs in relation to the DPF pigs may be explained partly by the reduced dietary energy available for body lipid synthesis in the 3PF pigs, which required more energy to catabolize excess dietary protein (Noblet et al., Reference Noblet, Henry and Dubois1987; Kerr et al., Reference Kerr, Yen, Nienaber and Easter2003).
Bone mineral and P content as estimated by DXA were not affected by the treatments. However, bone mineral density was lower (P=0.03) in the DPF pigs than in the 3PF pigs. Apart from the large variation between the animals, the pigs fed according to the DPF program had on average 3.6% less body minerals than the 3PF pigs, thus explaining the lower bone mineral density in the DPF pigs in relation to the 3PF pigs.
N and P excretions
Throughout the experimental period, the DPF and 3PF pigs retained a similar amount of N, which was 2.1 kg on average. However, given that the DPF pigs gained more weight than the 3PF pigs, the amount of N retained per kilogram of weight gain was 2.1% lower (P=0.04) in the DPF pigs than in the 3PF pigs. At the same time, the DPF pigs consumed 7.3% less N than the pigs in the 3PF group (5.2 kg for DPF v. 5.7 kg for 3PF), and as a result the DPF pigs also excreted 11.7% less N (P<0.01) than the 3PF pigs. This value is close to the 10% observed by Bourdon et al. (Reference Bourdon, Dourmad and Henry1995), the 14% observed by van der Peet-Schwering et al. (Reference van der Peet-Schwering, Verdoes and Beelen1996) and the 13% calculated by simulation by Letourneau Montminy et al. (Reference Letourneau Montminy, Boucher, Pomar, Dubeau and Dussault2005). The estimated 3.57 kg of excreted N produced during the entire growth period, that is, from 25 to 105 kg BW, is close to the amounts of 3.38, 4.12 and 4.26 kg/pig that were estimated by Dourmad et al. (Reference Dourmad, Sève, Latimier, Boisen, Fernández, van der Peet-Schwering and Jongbloed1999b) for the live weight interval of 28 to 108 kg in pigs raised in Denmark, France and the Netherlands, and to the 3.8 kg/pig proposed by the Comité d’ORientation pour des Pratiques agricoles respectueuses de l’ENvironnement (Groupe Porc) (CORPEN) (2003) for pigs with a live weight ranging from 30 to 112 kg. However, N excretion is the balance between N intake and retention, and in practice reducing dietary protein by reducing excess dietary N or balancing for amino acids decreases urinary and total N excretion (Le Bellego and Noblet, Reference Le Bellego and Noblet2002; Zervas and Zijlstra, Reference Zervas and Zijlstra2002), thus explaining the large variation in the amount of N that pigs can excrete during the growing period. For instance, N efficiency, which is the amount of N retained per 100 kg of N intake, can vary between 15% and 33% in commercial conditions (Dourmad et al., Reference Dourmad, Guingand, Latimier and Sève1999a; Niemann et al., Reference Niemann, Kuhla and Flachowsky2011). In the present study, N efficiency throughout the growth interval was 37% in the 3PF pigs and improved to 40% when the pigs were fed in a DPF program. Further improvements in N efficiency using commercial diets can be obtained only by using precision-feeding techniques in which each pig receives a daily-tailored diet containing the estimated amount of the required nutrients on the basis of the animal’s own real-time patterns of feed intake and growth. In precision-feeding systems, N efficiency can reach 48% (Pomar and Pomar, Reference Pomar and Pomar2012).
For P, the 676 g excreted by the 3PF pigs is consistent with the 630 g/pig suggested by CORPEN (2003) in a two-phase feeding program and close to the 560 g/pig observed by Pomar et al. (Reference Pomar, Dubeau, Letourneau Montminy, Mahé, Julien and Jondreville2004) in the BW interval of 20 to 105 kg, to the 920 g/pig observed by Dourmad et al. (Reference Dourmad, Guingand, Latimier and Sève1999a) in the BW interval of 28 to 108 kg, and to the 730 g/pig observed by van der Peet-Schwering et al. (Reference van der Peet-Schwering, Jongbloed and Aarnink1999) in the BW interval of 26 to 113 kg. In the present experiment, however, the effect of the treatments on P excretion was less significant than the effect observed on N excretion. The pigs in the DPF group consumed 3.3% less and retained 5.9% less P on average than the pigs in the 3PF group. As a result, the DPF pigs excreted only 1.9% less P than the 3PF pigs; this difference was not significant and can be explained mainly by the fact that the total P concentration in feed B did not differ enough from that in feed A (0.40 v. 0.53 g of total P per kilogram, respectively).
Feed-cost simulation study
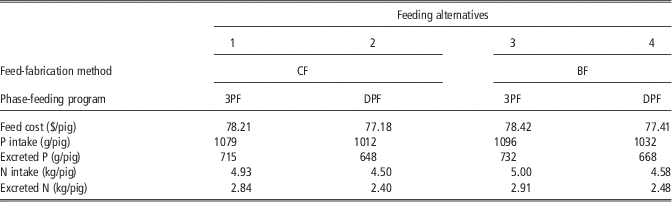
In this simulation study, growth conditions and animal performance were simulated to represent those observed in the animal experiment reported earlier in this paper. Total P intake and excretion estimated in this feed-cost simulation study were on average 4.3% and 5.1% higher than the respective values obtained in the animal experiment (Table 3). For N, the opposite happened: total N intake was 11.7% lower and N excretion was 19.1% lower in the simulation study than in the animal experiment. In fact, the experimental diets were formulated much earlier than those in the simulation study, and the utilization of by-products was avoided in the experimental diets to reduce nutrient composition variability and potential interactions with animal responses. The ingredient composition of the formulas used in the feed-cost simulation study was closer to those used by the pork industry, although they had similar nutrient composition that those used in the animal trial.
Simulated feed costs, N and P intakes, and N and P excretions of growing–finishing pigs fed from 25 to 105 kg BW according to feeding alternatives based on two feed-fabrication methods (complete feeds or blended feeds) and two phase-feeding programs (three phases or daily phases)

CF=complete feeds; BF=blended feeds; 3PF=three-phase feeding; DPF=daily-phase feeding.
For the pigs fed in the simulation study by blending two fixed feeds, the simulated amount of P consumed and excreted by the animals fed with the BF-DPF alternative were, respectively, 4.4% and 6.6% lower than those fed with the BF-3PF alternative. In addition, simulated N intake and excretion were 7.3% and 12.6% lower, respectively, in the BF-DPF group than in the BF-3PF group; these values were close to those observed in the animal experiment and in agreement with literature data (Bourdon et al., Reference Bourdon, Dourmad and Henry1995; van der Peet-Schwering et al., Reference van der Peet-Schwering, Verdoes and Beelen1996; Letourneau Montminy et al., Reference Letourneau Montminy, Boucher, Pomar, Dubeau and Dussault2005). However, P excretion was reduced by only <1.9% in the animal experiment, which was much lower than the 6.6% obtained in the simulation study. Because of the difficulty of estimating P retention in pigs fed with low-P diets, it was assumed that simulated P intake satisfied their requirements and that in these conditions, pigs retained similar amounts of P in their body. Such assumptions are frequently made to estimate P excretion in growing pigs (CORPEN, 2003). In the experimental study, P retention was modulated by available P intake, a fact that can explain the differences in P excretion observed between the experimental and simulated results.
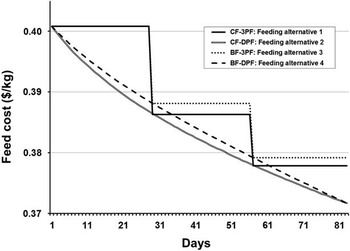
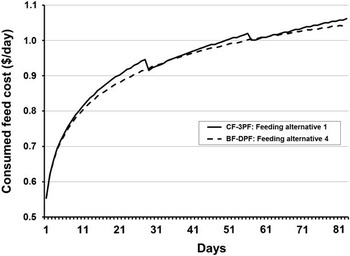
In terms of feed costs, moving from a BF-3PF program to a BF-DPF program reduced the cost of the total feed consumed during the overall growth period by 1.3%. This reduction in the cost of the consumed feed corresponds to the fact that even if the same feeds are used in these two feeding programs, feeds in a BF-DPF program are blended daily to follow the dynamic changes in the requirements of the growing population (Figure 2), and thus pigs consume less of the initial feed A, which is more expensive than feed B. Each day, a diet obtained using the BF-3PF system can be replaced by a diet obtained using the BF-DPF system at equal or lower cost. Therefore, feed cost ($/kg) and the cost of the consumed feed ($/pig) in the BF-DPF program was lower than that of the blend provided on the same day in the BF-3PF program, with the exception of the blends on days 1, 28 and 56 (Figure 3).
Feed cost ($/kg) of four feeding formulation alternatives based on two feed-formulation methods (CF, BF) and two phase-feeding programs (3PF, DPF). CF=complete feeds; BF=blended feeds; 3 PF=three-phase feeding; DPF=daily-phase feeding.

Cost of the simulated consumed feed ($/day) by pigs fed with complete feeds according to a three-phase feeding program (CF-3PF, feeding alternative 1) and those fed with blended feeds according to a daily-phase feeding program (BF-DPF, feeding alternative 4). CF=complete feeds; 3PF=three-phase feeding; BF=blended feeds; DPF=daily-phase feeding.

The total cost of the consumed feeds in the BF-3PF program was 0.3% higher than the cost of feeds in the CF-3PF program. Intakes of N and P were, respectively, 1.4% and 1.6% higher in the BF-3PF program than in the CF-3PF program. Between the same alternatives, excretions increased by 2.4% for both N and P (Table 3). This slight increase in feed costs observed when two feeds are blended to produce CFs results from the fact that formulating a CF is less restrictive than formulating feeds for blend feeding, with the exception of the first phase. During the second and third feeding phases, the cost of CFs was lower than the cost of blends, because feeds formulated to be blended have more formulation constraints than do those formulated for CF systems. The increases in N and P intakes were also because of blending. When feeding pigs in a limited number of feeding phases, and assuming that feed fabrication, transport and storage costs are low, CF systems will reduce feed costs as well as nutrient intake and excretion. In contrast, moving from a CF-3PF program to a BF-DPF program decreased the consumed feed cost by 1.0%, and the pigs consumed 4.4% and 7.3% less and excreted 6.6% and 12.6% less P and N, respectively.
Feeds A and B were formulated in this simulation study at minimum cost and feed A corresponded to the optimal diet for the 1st day of the growing period and feed B to the optimal diet for the last day of the growing period. However, the composition of feeds A and B does not need to be complete or be fixed to specific points in the growing period. Indeed, further feed-cost reduction can be obtaining by allowing feeds A and B be part of the optimization problem, but then a global bilinear problem would need to be solved (Joannopoulos, Reference Joannopoulos2012; Joannopoulos et al., 2014). Feed costs could be reduced further by using feeds with variable energy density, given that energy is by far the most expensive constituent of growing–finishing diets (Beaulieu et al., Reference Beaulieu, Williams and Patience2009). Considering the ability of the pigs to adjust their intake to the energy concentration of the feeds, varying this energy could further contribute to reduce feed costs. However, selecting the economically optimal dietary energy concentration in growing-pig diets remains a challenge (Beaulieu et al., Reference Beaulieu, Williams and Patience2009). Further research is needed to predict animal responses to changes in dietary energy concentration based on a free energy-density formulation. The modification of feed-formulation programs will liberate energy density to formulate diets that will minimize the consumed feed costs ($/kg of BW gain) rather the unitary cost of the feeds ($/kg) (Joannopoulos, Reference Joannopoulos2012; Joannopoulos et al., 2014).
Conclusions
Blend feeding and the automatic distribution of two feeds that, when combined in variable ratios, met the requirements of pigs throughout their entire growing–finishing period were successfully used to implement a DPF system. Feeds can either be formulated to satisfy the requirements of the pig population at the beginning (high-dietary concentration feed) and at the end (low-dietary concentration feed) of the growing period or be formulated simultaneously to minimize the cost of the feed that pigs will eat during this interval. In both formulation scenarios, moving from the traditional three phases to daily phases reduced N intake and excretion by 7.3% and 12%, respectively. The number of feeding phases did not affect average feed intake, daily gain or protein deposition, but the pigs fed daily-adjusted feeds retained 8% more lipids than the pigs fed in three phases.
Mathematical simulation and optimization procedures were used to evaluate the impact of phase-feeding systems and formulation methods on feed costs. It was demonstrated that in comparison with the cost in a three-phase feeding program, the cost of the feed eaten by pigs could be reduced by 1.0% when the feeds used for daily multiphase feeding are formulated to satisfy the requirements of the pigs at the beginning (high-dietary nutrient-concentration feed) and at the end (low-dietary nutrient-concentration feed) of the growing period.
Acknowledgments
The authors would like to thank C. Boucher for his help during the formulation stage, S. Méthot for his help with the statistics, N. Ouellet for his technical support and the staff at the swine complex for taking care of the animals. This project received financial support from Agriculture and Agri-Food Canada’s Matching Investment Initiative, Aliments Breton Inc., and the Canadian Swine Research and Development Cluster.