‘My own supposition is that most of us are “born” with discount functions. . . [but that] true discount functions become sublimated by parental teaching and social pressure.’ Strotz (Reference Strotz1956)
1. Introduction
The above quote by Strotz (Reference Strotz1956) highlights an interesting aspect of people's time preferences: they are influenced by nature and nurture. The same can be applied to risk preferences. In this paper, we show that facing uncertainty on an almost daily basis makes fishersFootnote 1 less averse to risk.
Fishing exhibits a risk pattern that is distinguishable from other professions. Roberts (Reference Roberts2010), for instance, reports that commercial fishing is the most dangerous occupation in the United Kingdom. It is widely agreed upon that fishers’ risk preference is a major determinant in their response to various changes in fishing stock, market, and weather conditions (Mistiaen and Strand, Reference Mistiaen and Strand2000). Therefore, understanding fishers’ risk preference is a key aspect of modeling and analyzing fishers’ decision-making behavior. The standard method of studying risk behavior is to estimate the parameter representing the concavity of the utility function under the expected utility framework. The more concave the utility function is, the more risk averse the agent is. This traditional approach, however, lacks an important aspect: loss aversion. This aspect of risk behavior is of great relevance to the fishing occupation in which receiving a negative profit for a fishing trip is not uncommon.
In this paper, we apply prospect theory, as an alternative framework to expected utility theory, to study the risk behavior of fishers. Prospect theory enables us to integrate the loss aversion aspect into risk behavior analysis. Since prospect theory provides a more comprehensive description of risk preferences, we are able to capture some insights that might otherwise be missed by using only the expected utility framework. To our knowledge, no studies to date in fishery economics have used prospect theory as the main analytical framework.
To be more specific, we are going to answer the question: Do fishers exhibit different risk behavior than workers in other professions? This paper contributes to the field of economics in several ways. First, it introduces the idea of combining experimental data and household survey data. The combination is made by matching information collected under a controlled environment (i.e., the field experiment) with information collected in a natural environment (i.e., the household survey). This combination allows us to make optimal use of both datasets. Data quality from the field experiment is enhanced since it is collected in a highly controlled environment. Furthermore, data from the experiments provide us with behavioral information that is not available in traditional household survey data. Meanwhile, data from the household survey provide us with a number of socioeconomic variables that can be used to explain risk behavior. The second contribution is that we are able to investigate the causal relationship between working in a fishery and risk behavior. As discussed below, the unique characteristic of Vietnam's fisheries makes this contribution possible by overcoming the potential endogeneity of occupational choice in the risk behavior equation that emerges in other studies. Finally, we integrate the loss-aversion aspect of risk behavior into the analysis and develop a practical method to estimate all three parameters of the utility function under prospect theory.
The paper further contributes in that it is probably the first study on risk preferences of fishers in the fishing villages of developing countries. These villagers are not only engaged in subsistence fishing (catch food for their families), but also in small-scale commercial fishing. Working as fishers under such circumstances involves risks in both income and other uncontrollable factors such as weather conditions. We are interested in how the working environment may affect the risk behavior of these fishers.
As Tanaka et al. (Reference Tanaka, Camerer and Nguyen2010) point out, Vietnam has some advantages as a field site.Footnote 2 The biggest advantage is our access to the 2002 Vietnam Household Living Standard Survey (VNLSS 2002) and the ability to link those survey responses to experimental responses. A few other studies also link field experiment and household survey data. In these studies, the household surveys are usually conducted by the researchers themselves. The quality and generality of those surveys are not verified by other independent researchers. In contrast, VNLSS 2002 is independently and jointly conducted by the World Bank and the General Statistical Office of Vietnam. Furthermore, VNLSS 2002 is considered one of the highest quality household surveys in Vietnam as indicated by its presence in numerous studies on Vietnam. Therefore, we can be confident in integrating VNLSS 2002 data into the field experiment data as well as using it as a reference point to test the external validity of the experimental results.
Vietnam is also a poor country – 45 per cent of the rural population lives below the poverty line (World Bank, 2005). So modest experimental payments go a long way and concerns about how people behave toward large experimental stakes (several days’ wages) are addressed at low cost. Furthermore, despite poverty, the Vietnamese have a high literacy rate (around 90 per cent),Footnote 3 which makes understanding instructions less challenging than field experiments in countries with lower literacy. The combination of poverty and literacy means the Vietnamese are good experimental subjects – they are highly motivated and easy to be reliably instructed.
We organize the paper as follows: we first discuss relevant literature on fishers’ behavior. Special attention is given to studies using experimental methods. Next, we elaborate on the data and methodology used in this study. In this section, we also discuss the method of simultaneously estimating parameters of the utility function under prospect theory. In section 3, we present the major findings and their interpretations. Finally, we conclude the paper and offer potential extensions of this research.
2. A literature review and a discussion of prospect theory
Sutinen's (Reference Sutinen1979) paper is one of the early studies that specifically integrates the role of risk preference in fishing decision-making behavior. In his study of remuneration practice in fishing, Sutinen assumes that fishers exhibit risk-averse behavior, just like people in other occupations. Following Sutinen, it has been taken relatively for granted that fishers are risk averse. Most empirical evidence on fishers’ risk behavior seems to support the hypothesis that fishers are risk averse. For instance, using the Random Parameter Logit framework to study location choice in the North Atlantic fishery, Mistiaen and Strand (Reference Mistiaen and Strand2000) find that 95 per cent of fishers are risk averse.
Only a few studies show results differing from Sutinen's assumption that fishers are risk averse. For instance, Bockstael and Opaluch (Reference Bockstael and Opaluch1983) were the first to test risk preferences empirically. They tested the special case of constant relative risk aversion, r = 1, which is U = lnx, that is, assuming risk aversion that they could not reject. Dupont (Reference Dupont1993) used a similar methodology and could reject risk aversion in three of four fisheries, but actually drew the incorrect inference that fishers were risk preferring (see further Mistiaen and Strand, Reference Mistiaen and Strand2000). Eggert and Tveteras (Reference Eggert and Tveterås2004), using revealed data, found that a substantial amount were not risk averse.
Most of the above studies utilize expected utility as the main framework and employ either survey data or logbooks. Instead of making initial assumptions or deriving general conclusions about risk behavior as the above studies did, we go a step further to directly measure the level of risk aversion. In other words, we are interested in parameterizing the level of risk aversion under the prospect theory framework, using data from field experiment. The benefit of field experiment, as Falk and Fehr (Reference Falk and Fehr2003) point out, is that it enables the researchers to generate truly exogenous variation in the data that would otherwise be unavailable in natural or empirical data. Furthermore, random assignment of participants by hand-picking may help in reducing selection bias and problems with omitted variables.
One of the first experimental studies on fishers’ risk behavior is likely that by Eggert and Martinsson (Reference Eggert and Martinsson2004). In their study, risk preferences of Swedish commercial fishers are estimated by using data from a choice experiment, or more specifically, from a stated preference experiment. The participants were asked to choose between pairs of fishing trips characterized by the mean and spread of net revenue. Risk is measured by the spread of net revenue and is assumed to follow a uniform distribution to make it easier for the experiment participants to make a choice (Johansson-Stenman et al., Reference Johansson-Stenman, Carlsson and Daruvala2002). Eggert and Martinsson find that 87 per cent of the respondents in their study are not risk neutral. Rabin (Reference Rabin2000), on the other hand, points out that expected utility theory predicts that people will be virtually risk neutral not only over modest stakes but also for quite sizable and economically significant stakes. As such, we can infer that almost 90 per cent of the experiment participants do not behave according to expected utility theory. Eggert and Martinsson also find that 48 per cent of the fishers can be broadly characterized as risk neutral and risk preferred, 26 per cent as modestly risk averse, while 26 per cent are strongly risk averse.
As Eggert and Lokina (Reference Eggert and Lokina2007) point out, while there is a growing interest in studying fishers’ risk preference, most studies involve commercial fisheries. To check the robustness of the results, following a similar approach, they investigate the risk preferences of artisanal fishers in Tanzania. They find that about 53 per cent of Tanzanian fishers can be broadly considered as risk loving or risk neutral, 25 per cent as modestly risk averse and about 22 per cent as strongly risk averse. About 19 per cent of fishers in their sample behave as expected return maximizers. According to Eggert and Lokina, this finding shows a marked difference from those in other commercial fisheries in which most fishers are risk averse.
The studies by Eggert and Martinsson (Reference Eggert and Martinsson2004) and Eggert and Lokina (Reference Eggert and Lokina2007) point out that expected utility theory may be appropriate in describing risk behavior regarding long-term decisions or decisions involving a large amount of money, such as purchasing a new boat, in which lifetime wealth is properly taken into account. However, most decisions in the fishery are made in view of immediate horizons. More importantly, as noted by Eggert and Martinsson (Reference Eggert and Martinsson2004), loss aversion may explain why only a small proportion of the fishers in their study are risk averse. As discussed below, prospect theory has increasingly proven to be a more useful description of risk preferences under a wide range of applications. A particular advantage of using prospect theory is that it allows us to integrate the loss aspect (negative profit) into the model. This aspect is of great relevance to fishing in which having a net loss for fishing trips due to uncontrollable factors, such as change in weather conditions, is not so uncommon.
2.1 A discussion on prospect theory
Expected utility theory has long been the standard approach in economic modeling. Due to its limitations, several alternatives to expected utility theory have been developed. Most notable is prospect theory, first developed by Kahneman and Tversky in Reference Kahneman and Tversky1979. The key difference between prospect and expected utility theory is that the former integrates the loss aversion aspect of risk behavior into the utility function. Utility is measured based on a comparison of the realized income and the reference income. If the difference is positive, the economic agent receives a gain in utility and vice versa. The basic premise is that people may be risk averse to gain and risk preferred to loss at the same time. The new aspect of loss aversion has enabled prospect theory to explain a wide variety of economic phenomena that were considered puzzles from the expected utility perspective. Examples include the equity premium puzzle, the status quo bias, various gambling and betting puzzles, intertemporal consumption, and the endowment effect.
As far as fishing is concerned, prospect theory is appealing for a number of reasons. Nguyen (Reference Nguyen2008) finds that the target revenue model, a version of prospect theory, can explain decision-making behavior in terms of trip length for a majority of Hawaii's longline fishers. Also, receiving a net loss in profit for a fishing trip is not unusual in fishing. Therefore, the loss aversion aspect is particularly relevant in fishery studies.
3. A brief introduction to Vietnam's fishery and fishers
Endowed with long coastlines and many rivers, Vietnam has a great potential for fishery development. ‘Com and Ca’, which can be translated in English as ‘Rice and Fish’, has been an important element of food consumption among the Vietnamese people for many centuries. According to recent statistics, the per capita annual consumption of fishery products was 13 kg in 2001 (VASEP, 2001). Fishing can be classified into two main branches: freshwater and ocean fishing. The former includes fishing in the rivers, lakes, and ponds. According to Nguyen (Reference Nguyen2002), there are about 550,000 fishers in Vietnam, of which 450,000 are ocean fishers and 100,000 are freshwater fishers. Freshwater fishing, characterized by simple boats and rudimentary equipment, requires much less financing and capital to operate than ocean fishing, which generally employs more advanced and expensive boats. In addition to fishing, most fishers are involved in farming or aquaculture activities to earn additional income for the family (Nguyen, Reference Nguyen2002).
A typical feature of Vietnamese fishers is a strong sense of community. The fishing village is an integral element of a fisher's lifestyle. Most men in fishing villages are fishers as fishing is expected to be the main occupation of men in the village. Consequently, men in a fishing village have little occupational freedom, regardless of an individual's risk behavior. This feature plays a key role in the subsequent regression analyses in which we can safely infer a causal relationship between the fishing occupation and risk behavior.
4. Data and methodology
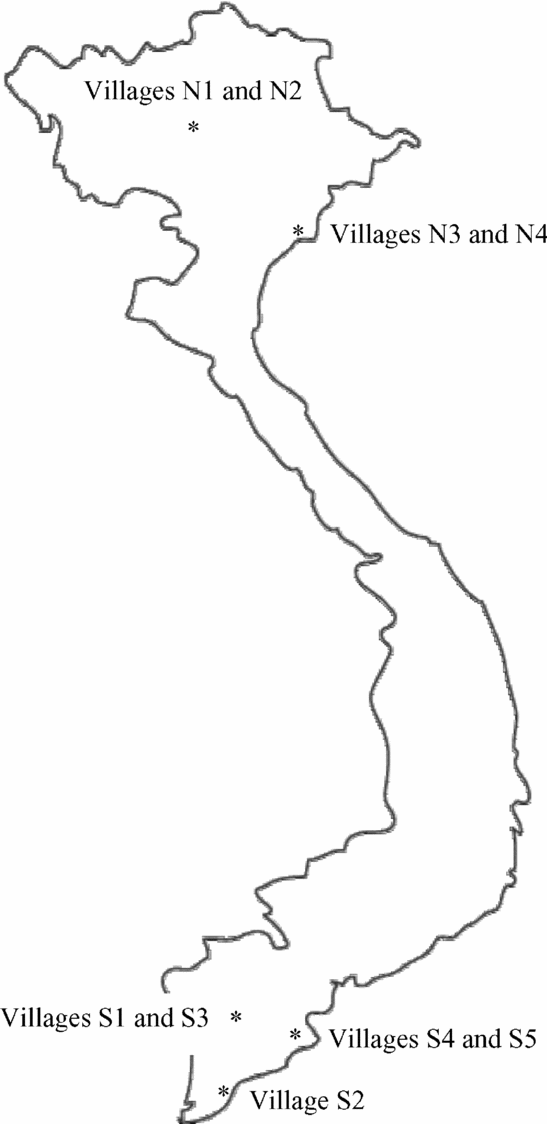
A noteworthy aspect of this study is the combination of experimental and household survey data. The baseline information is compiled from the 2002 living standard survey (VNLSS 2002), which covers a total of 75,000 households in Vietnam. The survey provides key information on socioeconomic characteristics of Vietnamese households and individuals. The sample was designed in such a way that each household had the same probability of being selected. In the 2002 survey, 25 householdsFootnote 4 were interviewed in each of the 142 and 137 rural villages in the Mekong Delta (in the South) and the Red River Delta (in the North, excluding villages in Hanoi City), respectively. Experiments were conducted from July through August 2005 with the same members of households previously interviewed during the VNLSS 2002 survey. In particular, we chose nine villages (figure 1), five villages in the south, and four villages in the north, with substantial differences in mean income, inequality, and market access to permit statistically significant cross-village comparisons. We then combined the data, using ID numbers of individuals who participated in both experimental and the VNLSS 2002 household survey as the linking variable.
Locations of experimental sites.

The field experiment was conducted by the following procedure. A week before the experiments, research coordinators contacted local government officials in each research site and asked them to invite one person from each of the 25 previously surveyed households to the experiments.Footnote 5 Because of the power of government to encourage attendance, the response rate was high (82 per cent). This means we do not have to worry much about self-selection artifacts. Village meeting rooms or school classrooms were reserved for the experiments. Experiments started at approximately 9 o'clock in the morning and lasted about 4 hoursFootnote 6 For student subjects in the West, experiments are like a temporary part-time job performed for money and out of curiosity. For Vietnamese villagers,Footnote 7 the experiments are a serious matter as experiment rewards often represent several days’ income. The average experimental earning for three games was 174,141 dong (about 11 dollars,Footnote 8 roughly 9 days’ wages for casual unskilled labor). Their motivation is helpful for doing many measurements in a single, long experimental session.
As far as the methodology is concerned, the risk preference parameters are estimated from the experimental data and used as the dependent variables in subsequent regression analyses. Most of the independent variables are compiled from the household survey data. Other independent variables are compiled from a small survey conducted with the experimental participants at the end of the experiments.
In addition to its advantages, the use of the household survey in combination with experimental data also calls for some attention. The experimental data from the participants’ decision-making behavior is collected in two different hypothesized contexts. The household data observes how people make decisions in a real-world context, and more precisely, the outcome of their decisions. We can ask if there is consistency in the participants’ behavior under these two different contexts. One may argue that the subjects are less serious under experimental conditions as compared to reality, especially when the subject's reward is relatively small. Fortunately, participants in our experiment can receive rewards for up to several days of their salary for reasonably made decisions, and hence, have strong incentive to be serious in making hypothetical decisions (Tanaka et al., Reference Tanaka, Camerer and Nguyen2010).
Another argument against the use of experimental data is based on the idea that the same person may behave differently under varying circumstances. For instance, a fisher may be risk loving when he is fishing; however, he may be risk averse when making a housing investment decision. In a large study on risk behavior in Europe, Dohmen et al. (Reference Dohmen, Falk, Huffman, Sunde, Schupp and Wagner2010) found that people show consistent risk behavior under different decision-making scenarios: car driving, financial matters, health, and career. This finding supports the use of experimental data in our study.
As far as the theoretical framework of this study is concerned, following Tanaka et al. (Reference Tanaka, Camerer and Nguyen2010), we assume that economic agents’ behavior is elicited by prospect theory. As noted below, expected utility theory is a special case of prospect theory. Accordingly, we can identify additional findings that might otherwise be hidden when applying expected utility theory. We use a cumulative prospect theoryFootnote 9 (Kahneman and Tversky, Reference Kahneman and Tversky1979; Tversky and Kahneman, Reference Tversky and Kahneman1992) and the one-parameter form of Prelec's (1988) axiomatically derived weighting function. Specifically, the utility function can be expressed as follows:

where

and

T(x, y; p) is the expected prospect value over binary prospects consisting of the outcome (x, y) with the corresponding probability (p, 1 − p). In our experiment, (x, y; p) are specified for both option A and option B in all scenarios. T(x, y; p) includes two functions: the power value function ν(x) and the weighting probability function w(p). Note that the value function ν(x) should be examined with x σ for x > 0 or −λ(− x σ) for x < 0. σ represents concavity of the value function (risk aversion), and λ represents the degree of loss aversion. We use Prelec's weighting function because it is flexible enough to accommodate the cases in which individuals have either inverted-S or S-shaped weighting functions; additionally, it has fit previous data reasonably well. The weighting function is linear if α = 1, as it is in EU. If α < 1, the weighting function is inverted S-shaped (i.e., individuals overweigh small probabilities and under-weigh large probabilities). If α > 1, then the weighting function is S-shaped, i.e., individuals underweigh small probabilities and overweigh large probabilities.
As far as the estimation procedure is concerned, the three parameters σ, α, and λ are estimated using data from the field experiment conducted in Vietnam during the summer of 2005. The experiment aims at measuring social preference, time discounting, risk preference, and most importantly, risk behavior, among Vietnamese villagers. Each experimental subject (participant) was asked to choose between plan A and plan B under different scenarios. Each scenario is characterized by monetary rewards and the corresponding probabilities of receiving these rewards. After all participants in the experiment had completed making decisions, a scenario was randomly selected to decide how much the participants would receive from the experiment. On average, the participant earned 21,431 VND, which is equivalent to US$1.3.
To estimate the parameters σ, α, and λ of the utility function for each individual, we generate 35 scenarios. These scenarios are divided into three subcomponents.Footnote 10 The first two subcomponents aim at measuring the risk aversion and the weighting probability function's parameters σ and α simultaneously. The third subcomponent focuses on estimating the loss aversion parameter λ.
It is worth noting that the highly nonlinear nature of the utility function under prospect theory makes the estimation procedure relatively difficult to handle. A number of procedures have been developed to estimate the parameters of the utility function under prospect theory. However, these procedures only focus on estimating elements of the utility function separately. For instance, to estimate parameters of the weighting function, Wu (Reference Wu1994) develops the least squares method, which aims to minimize the actual and estimated probability of choosing one prospect over another. Abdellaoui (Reference Abdellaoui2000) and Abdellaoui et al. (Reference Abdellaoui, Bleichrodt and Paraschiv2007) develop a two-stage procedure to estimate the weighting function and loss aversion coefficients. The estimation method is nonparametric without assuming any specific form of the value and weighting probability functions. In the first stage, a sequence of ordered outcomes is generated. The corresponding (ordered) probabilities are derived in the second stage. In this paper, we apply a procedure developed by Tanaka et al. (Reference Tanaka, Camerer and Nguyen2010) that can simultaneously estimate all three parameters of the utility function under prospect theory.
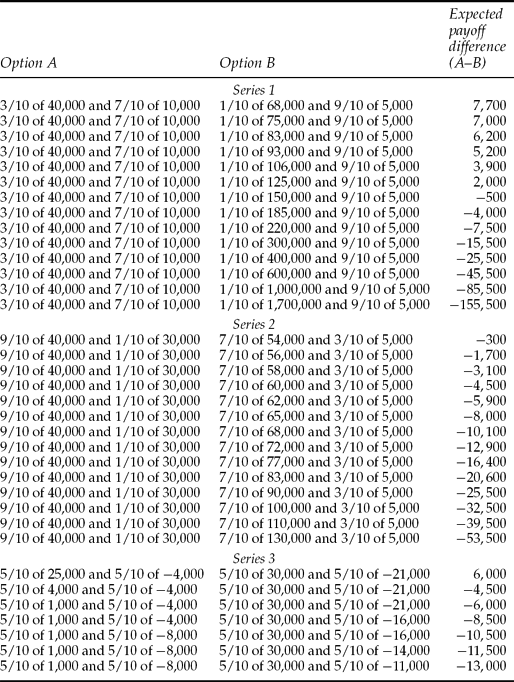
As in Holt and Laury (Reference Holt and Laury2002), we present the difference in expected payoffs for each scenario (table 1). There are 35 scenarios grouped into three series. Series 1 includes scenarios 1 to 14. Notice that the expected payoff for option A is the same for all scenarios, whereas it increases for option B as the scenario number increases. Thus, the expected payoff for scenarios 6 and 7 is the same under option A, while it is higher for scenario 7 under option B. The same pattern is observed in series 2 (scenarios 14 to 29) except that option B has a higher expected payoff than option A immediately at the first question. Series 3 is the last batch (scenarios 29–35), and we notice the same pattern of expected payoffs as observed in series 1 and series 2; however, there is also a chance of losing money.Footnote 11 It is noted that prospect theory has an intrinsic empirical limitation in that the reference point is not well specified. Here the reference point of 0 earnings is used but this is fairly arbitrary.Footnote 12
Expected payoff difference of pairwise lottery choices

As such, in each series the scenarios are ordered in such a way that plan B improves compared to plan A. To be consistent the individual will either choose plan A for all scenarios or switch to plan B for some scenarios and continue to choose B for all remaining scenarios in the series. Based on the choices made by each individual, we then can estimate the range of possible values of the parameters of his or her utility function σ, α, and λ. This is achieved by solving a system of inequalities satisfying the choices made by the individual.
The choices are carefully designed so any combination of choices in the three series determines a particular combination of prospect theory parameters: σ, α, and λ. Series 1 and series 2 are designed to estimate the level of risk aversion and the weighting probability parameter, respectively, whereas series 3 addresses the loss aversion aspect. For each of the three series, the subject will switch from option A to option B in some scenarios. Note also that we gave examples in the experimental instruction to illustrate to the participants that it was acceptable for them to choose option A in all scenarios of a given series (no switching); likewise, they could make a switch directly at the first scenario of the series. Based on this switching behavior, we can estimate the parameters of the utility function under prospect theory.
To develop an estimation strategy, we first notice that the value function depends on the parameter λ only in series 3, which includes the loss outcomes. As such, we can use series 1 and series 2 to estimate α and σ and then use the estimated (α, σ) to estimate λ. In what follows, we present an example to illustrate our estimation strategy.
Supposing that a subject makes a switch from option A to option B in scenario 7, then it must be the case that he or she prefers option A to option B in scenario 6, but at the same time prefers option B to option A in scenario 7. To put it differently, his or her expected utility under prospect theory from option A is greater than that from option B in scenario 6, whereas it is opposite in scenario 7. Mathematically, we can write the following inequalities:


where E[TA ,6(x, y; p)] is the expected utility under prospect theory given the subject's choice of option B in scenario 6, E[TB ,6(x, y; p)], E[TA ,7(x, y; p)], E[TB ,7(x, y; p)] are defined in the same manner.
As far as series 2 is concerned, if we suppose this same subject makes a switch from option A to option B in scenario 21, by the same reasoning, we can write the following inequalities:


As such, by observing the switching behavior of this subject in series 1 and series 2, we can develop a system of four inequalities as follows:


Substituting the values of (x,y; p) for each option in each scenario, we have the following equivalent system of inequalities:
\nonumber\\
&&\quad > 5000^\sigma + \exp [ - ( - \ln .1)^\alpha ](125000^\sigma - 5000^\sigma ),\end{eqnarray}](https://static.cambridge.org/binary/version/id/urn:cambridge.org:id:binary:20181122162251064-0614:S1355770X10000203:S1355770X10000203_eqn10.gif?pub-status=live)
\nonumber \\
&&\quad < 5000^\sigma + \exp [ - ( - \ln .1)^\alpha ](150000^\sigma - 5000^\sigma ),\end{eqnarray}](https://static.cambridge.org/binary/version/id/urn:cambridge.org:id:binary:20181122162251064-0614:S1355770X10000203:S1355770X10000203_eqn11.gif?pub-status=live)
\nonumber \\
&&\quad > 5000^\sigma + \exp [ - ( - \ln .7)^\alpha ](65000^\sigma - 5000^\sigma ),\end{eqnarray}](https://static.cambridge.org/binary/version/id/urn:cambridge.org:id:binary:20181122162251064-0614:S1355770X10000203:S1355770X10000203_eqn12.gif?pub-status=live)
and
\nonumber \\
&&\quad < 5000^\sigma + \exp [ - ( - \ln .7)^\alpha ](68000^\sigma - 5000^\sigma ).\end{eqnarray}](https://static.cambridge.org/binary/version/id/urn:cambridge.org:id:binary:20181122162251064-0614:S1355770X10000203:S1355770X10000203_eqn13.gif?pub-status=live)
Solving the above nonlinear system of inequalities for (σ, α),Footnote 13 we find that the ranges of σ and α that satisfy the above inequalities are 0.65 < σ < 0.74 and 0.66 < α < 0.74. Upon rounding, we then select the point (σ, α) = (0.7, 0.7), satisfying the condition for the follow-up analysis.
Having estimated the parameters (σ, α), we continue to estimate the loss aversion parameter λ. The estimation is based on the experimental subject's switching behavior (from option B to option A) in series 3. It is worth noting that the range of λ values implied by each switching point depends on the utility curvature σ; thus λ cannot be uniquely estimated from the switching behavior in series 3. Given that, we construct questions (options) in series 3 in such a way as to ensure that λ takes similar values across different levels of σ. Also, to ease the calculation we design the questions in such a way that the probability sensitivity parameter, α, plays no role in series 3. In particular, all prospects involve equal (50 per cent) chances of gain and loss, so the probability weighting terms drop out in calculating prospect values.
To continue with the above example, let us suppose that the above individual makes a switch from option A to option B in scenario 30. According to the same reasoning, we have the following system of inequalities:

Substituting the estimated σ = 0.7 and solving for λ, we have 0.224 < λ < 1.413. We then use this range of λ value for the subsequent analyses.
Having estimated parameters of the utility function under prospect theory framework for each individual, we then explore how these parameters are correlated to socioeconomic variables such as occupation, education, and income level. Information on the latter variables is obtained from the VNLSS in 2002.
To summarize, there are two main steps in the estimation process:
Step 1: The parameters α, σ, and λ of the utility function are estimated for each individual based on the choices made by the individual in the experiments. Mathematica is employed to solve the system of nonlinear inequalities.
Step 2: The experiment data are linked to the data from the VNLSS 2002 and to a small survey we collected at the end of each experiment. Selected variables from the VNLSS 2002 and the survey are used as explanatory variables in the econometric models to explain the determinants of risk preferences.
4.1 Empirical specification
The baseline empirical model takes the following simple ordinary least squares form (OLS): Y = Xβ + Fγ + ε, where Y is the value of the utility function parameter α, σ, and λ under prospect theory estimated from the experimental data. Note also that we have three separate equations for α, σ, and λ. X is a vector of socioeconomic variables, including age, education, distance to market, and occupation of the participants. F is a binary variable, indicating whether the participant is a fisher (F = 1 if the participant is a fisher, F = 0 if not). Information about X and F are collected from the VNLSS 2002 as well as from the interviews conducted at the experimental sites.
Prior to conducting the regression analysis, we address an important consideration in this kind of study: direction of causality. The key research question is whether being involved in fishing makes fishers less risk averse. In other words, we are interested in whether the estimated coefficient γ is significantly negative. However, the causality may go both directions. A number of studies in labor economics have shown that less risk-averse agents are more likely to choose riskier jobs for better compensation (Viscusi and Hersch, Reference Viscusi and Hersch2001). For instance, King (Reference King1974) finds that individuals from wealthier families choose riskier occupations; Cramer et al. (Reference Cramer, Hartog, Jonker and Van Pragg2002) show that less risk-averse agents are attracted to entrepreneurship, which is a risky occupation. It could be that working as a fisher makes people more accustomed to taking risks. But, it could also be the case that less risk-averse people would choose a risky occupation, such as fishing, to suit their preferences. Fortunately, this ambiguous direction of causality is partially solved in the context of our study. As mentioned above, Vietnam's fishers have a unique characteristic in the sense that fishing is mostly a traditional occupation concentrated in certain areas. People, especially men from those areas, almost automatically become fishers when they become adults, as being a fisher is considered the only occupation option available to most men in these fishing villages. This unique characteristic of Vietnam's fisheries provides us with a great advantage in studying the causal relationship between working in fishing and risk behavior. A related concern here is that people can avoid becoming fishers by moving away from the villages. While this may be somewhat true, it is worth noting that migration and job mobility in Vietnam are very low compared to developed countries. This was especially true before the economic reform policy in 1986 during which migration from one province to another had been strictly monitored by the government; also many of the fishers in our study (74 per cent) had started careers during that time.
5. Main findings
Prior to conducting the econometric analysis, we conduct a hypothesis testing to check whether the data supports prospect theory. Table 2 presents distribution of switching questions made by subjects. Note that there are several participants who never made a switch in one or some series. Under expected utility theory, the estimated value of (α, λ) from the experimental data would be (1, 1). Accordingly, we are interested in checking whether (α, λ) is significantly different from (1, 1). The mean estimated value for (α, λ) is (0.74, 2.91) and the corresponding t-statistics are (−13.24, 8.91). Therefore, our data show a strong inclination toward prospect theory.
Number of subjects by switching points Notes: Bold italics indicate choices compatible with EU (α = 1) and risk aversion.

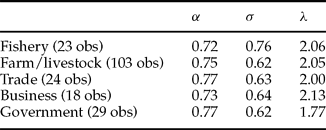
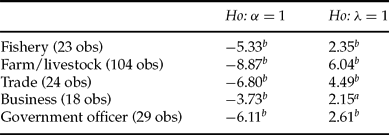
Taking into account the possibility that workers in different occupations may have different preferences, we also conduct the t-test for each occupation. The participants are more likely to behave in accordance with prospect theory than expected utility regardless of their occupations (table 3 and appendix A).
Mean value of risk parameters by occupation

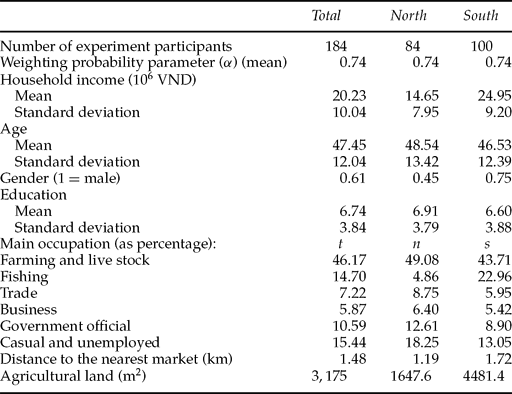
Next, we investigate the descriptive statistics of key variables used in the analysis. The majority of participants work in the farming sector (table 4). The mean years of schooling is around 7 years. This relatively high educational level is a crucial factor to ensure the participants’ comprehension of the experiments (Tanaka et al., Reference Tanaka, Camerer and Nguyen2010). It is worth noting that there exists a difference between the North's and the South's participants in a number of aspects. The loss aversion parameter (λ) for Southerners is greater than for Northerners. The greater λ implies that the former are more averse to loss than the latter. Southern participants are wealthier. The proportion of participants who work as fishers is also greater in the South. On the other hand, there is a greater proportion of participants in the North working for the government.
Basic descriptive statistics of main variables

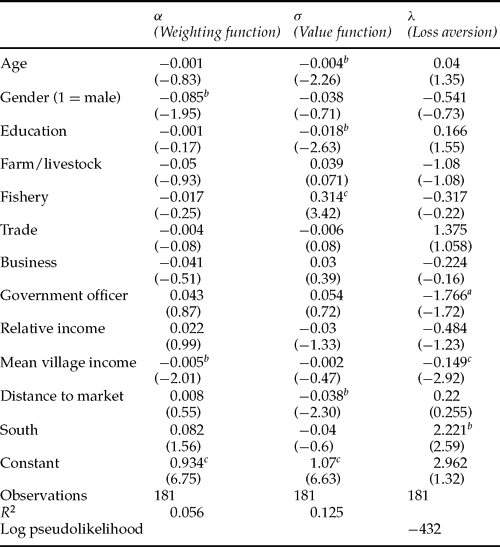
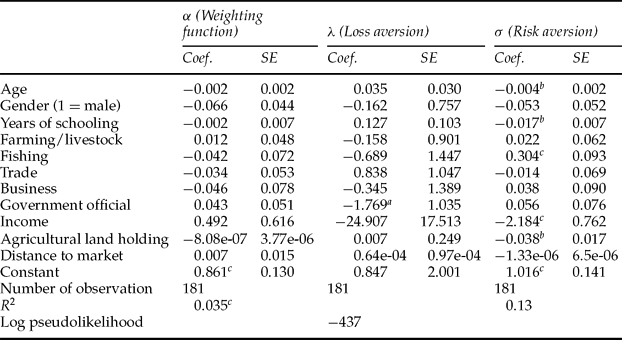
We estimate the weighting parameter α and curvature of the utility function σ by OLS regressions of individual-specific parameter estimates against demographic variables. Given that the loss-aversion parameter λ is an interval variable, it is estimated by interval regressions,Footnote 14 using maximum likelihood techniques. According to Wooldridge (Reference Wooldridge2004), interval regression is a special case of ordered probit models wherein the cut points are known. The regression results are shown in table 5. We first look at the determinants of σ, which is used as a proxy for risk aversion. A positive value of the coefficient implies that the corresponding variable has a negative impact on the risk aversion level, or the greater this variable is, the less risk averse the participant is. The most interesting finding is that working as a fisher makes the participants less risk averse than workers in other occupations (the base category). As for a robustness check, we also run a model employing different measurement of income as well as using agricultural land holding as a proxy for wealth (Appendix B). Fishers are still found to be less risk averse than workers in other occupations. This suggests that participants in occupations involving high risk might, over time, become more willing to take risks, though it is not necessary that fishers are more risk loving than people in other occupations (Smith and Wilen, Reference Smith and Wilen2005).
Determinants of dimensions of risk aversion

Notes:aSignificant at the 10% level; bsignificant at the 5% level; csignificant at the 1% level.
t-statistics are in parentheses.
Other factors that have a significant impact on the risk aversion level include age, education, and market distance. More specifically, the older the participant is, the more risk averse they become. This finding is consistent with most other studies. As far as the correlation between education and risk aversion is concerned, participants with higher levels of education are found to be more averse to taking risk. This effect of education on risk aversion is consistent with that found in the study by Dohmen et al. (Reference Dohmen, Falk, Huffman, Sunde, Schupp and Wagner2010), but not in agreement with Yesuf and Bluffstone (Reference Yesuf and Bluffstone2009) who find that literate Ethiopian farmers are less risk averse than illiterate ones. The effect of market distance on risk aversion is interesting. The closer the participant lives to the market, the less averse he or she is. It could be that living close to the market exposes the participant to the daily uncertainties of business activities, thereby acclimatizing the participant to income fluctuation.
Extending our discussion to loss aversion, we find that being a fisher makes the participant less averse to loss; the effect is not statistically significant though. Interestingly, government officials are significantly less loss averse than workers in the base category. This is expected given the income security and job stability that government officials have. Also, people in the North are significantly less loss averse than those in the South, which may be due to sociohistorical reasons. Northerners have been under the Socialist regime for a much longer period and have developed a stronger belief in the social safety network, which acts as a support net during times of loss. The key factor influencing loss aversion is the mean village income. The richer the villagers are, the better they can jointly support their village fellows who are facing loss. Accordingly, the richer the village is, the less loss averse the villagers are. This finding is of great relevance to community/village-oriented cultures in Vietnam where risk sharing among villagers is typical. It could also be the case that in villages with higher mean income, individuals are by and large richer, and richer individuals are less concerned about loss aversion.Footnote 15
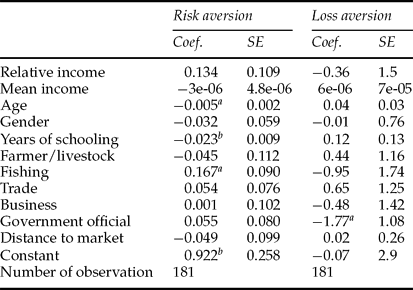
As mentioned, the potential simultaneity of risk behavior and fishing occupation choice can be greatly solved given the unique characteristic of fisheries in Vietnam. However, other variables may also cause simultaneity. In particular, it is well known in the literature that risk preferences do impact income. For instance, a number of studies show that wealthier individuals appear less risk averse than others (Tanaka et al., Reference Tanaka, Camerer and Nguyen2010). Given its potential endogeneity, it is helpful to find relevant instrumental variables for income variable. We use the variable rainfall level in 2002 and a binary variable indicating whether the household work was able to work in 2002 as the instrument for mean and relative income. These variables have a strong correlation with the income variables. They can also be assumed to have no correlation with the error term in the risk behavior equations. Results from the two-stage least-squares (2SLS) estimators still show that working as a fisher has a significant effect on risk aversion (table 6).
Determinants of risk and loss aversion under 2SLS model

Notes: ap < 0.1, bp < 0.01.
Finally, an important finding of this paper is the integration of loss aversion into the analysis of risk behavior. A few other studies have shown the poor to be more risk averse but have not been able to separate concavity from loss aversion. In our study, despite not having significant impact on risk-averse behavior, the mean village income is found to be the most important determinant of loss aversion. It is plausible then that the poor do not fear income variation – which is a measurement of risk aversion – but rather they fear loss.
6. Conclusions
We apply prospect theory to investigate whether working in fisheries makes fishers less averse to risk than others. The combination of experimental field data and household survey data plays an important role in the investigation process. Also, the unique feature of Vietnamese fishers, who consider fishing as the only occupational choice, makes it possible to infer the causal relationship between the fishing occupation and the resulting risk behavior.
We develop a methodology to estimate the parameters of the utility function under prospect theory by using experimental data to estimate the probability weighting, concavity, and loss aversion parameters of the utility function. We then use these estimated parameters as the dependent variables in subsequent regression analyses.
We find that working as fishers does make the participants less averse to risk. The result is highly significant in all estimations both under prospect theory and expected utility framework. Equally important is the additional insights on risk behavior that are provided by the loss aversion aspect. The mean village income significantly impacts loss averse behavior, but it does not have a significant impact on risk aversion. The insignificant effect of working in fisheries on loss aversion implies that fishers are afraid of loss in income as much as other workers. In contrast, the significant effect of fishing on risk aversion implies that fishers are less afraid of revenue variation than other workers. To articulate it differently, fishers are less afraid of income variation than income loss.
There remain areas for improvement relating to the potential endogeneity in the models. For instance, working in the business sector may affect risk behavior. On the other hand, people with certain risk behaviors may choose business as an occupation. In the context of cross-sectional data like ours, it is not possible to solve all endogeneity problems. The causal relationship between preferences and occupational choice is still an open question. It may be that fishing attracts people with a certain type of preferences. At the same time, we believe that preferences are both biologically and environmentally influenced. Working in a special environment such as fisheries may affect fishers' risk preferences. To repeat the quote from Strotz (Reference Strotz1956): ‘My own supposition is that most of us are “born” with discount functions. . . [but that] true discount functions become sublimated by parental teaching and social pressure.’ It is possible that being faced with uncertainty on an almost daily basis makes fishers less averse to risk. Future research can more clearly establish the causal relationships between risk behavior and other variables by using panel data or randomized field experiments (Tanaka et al., Reference Tanaka, Camerer and Nguyen2010).
Our study shows that new research methodologies can be integrated into the study of labor economics. Field experiment and household data can be combined and can complement each other. In addition to expected utility theory, prospect theory can also provide insights into risk behavior. The methodology developed in this study is applicable to a broad spectrum of research, both within fisheries and in other fields as well.
One sample t-test under Ho: α = 1 and Ho: λ = 1

Notes: asignificant at 5% level, bSignificant at 1% level.
Determinants of dimensions of risk aversion under alternative measurement of income and wealth

Notes: ap < 0.1, bp < 0.05, cp < 0.01.