Introduction
An increased prevalence of childhood obesity in recent decades has been accompanied by an increased prevalence of high blood pressure (HBP) in children and adolescents.Reference Hansen, Gunn and Kaelber 1 , Reference Din-Dzietham 2 This high prevalence constitutes a public health threat because HBP engenders structural changes in the heart that frequently lead to congestive heart failure. The extent of the problem was exemplified by Coca et al.Reference Coca 3 who reported that 73% of a population-based sample of 946 subjects with essential HBP met the echocardiographic criteria of de Simone et al.Reference Simone 4 for left ventricular hypertrophy.
Childhood body size – especially body mass index (BMI) – has been shown to be associated with increased risks of HBP in both children and adults, depending on sex and age.Reference Rosner 5 , Reference Sun 6 Rademacher et al.Reference Rademacher 7 showed that blood pressure and BMI act independently in children to influence future cardiovascular risk in young adults, though there is a greater than additive effect. Sabo et al. Reference Sabo 8 found that children with low BMI throughout childhood had lower systolic blood pressure (SBP) and diastolic blood pressure (DBP) in early adulthood than did children with high BMI throughout childhood, though this difference disappeared by age 60. Accounting for multiple comparisons, this study also showed that adult blood pressure was significantly associated with childhood BMI at ages as early as 4.5 years for SBP and 6 years for DBP in males, and as early as 4 and 8 years in females (for SBP and DBP, respectively). In a subsequent study, Sabo et al. Reference Sabo 9 also found childhood body size to be associated with adulthood cardiac structure measurements, with childhood BMI at ages as early as 7.5 and 11.5 years (in males and females, respectively) associated with interventricular septal thickness, and with childhood waist circumference (indexed by height) as early as 8 years associated with left ventricular mass index in males.
Evidence exists to show that not only childhood body size, but also growth and timing of body size changes are associated with adult cardiovascular risk. Guo et al. Reference Guo 10 identified three sets of BMI growth parameters using a third-degree polynomial model, including the ages and BMI levels associated with the attainment of: the early childhood BMI/adiposity rebound (AR), the maximum BMI velocity during the adolescent growth spurt and the adolescent BMI maximum. These growth parameters are often more indicative of future cardiovascular health than any instantaneous childhood BMI measurement. Lakshmy et al.Reference Lakshmy 11 reported that early AR followed by rapid weight gain is associated with pro-inflammatory and pro-thrombotic states in adulthood. Barker et al.Reference Barker 12 found that Finnish adults with coronary events were likely to have gained weight more rapidly in their first decade than adults without coronary artery disease. Several investigators have reported strong positive correlations between the age at AR and BMI in young adulthood,Reference Guo 10 , Reference Rolland-Cachera 13 but little information on subsequent HBP is available due to the absence of long-term serial data. Like BMI, stature can also be summarized with a set of growth parameters using the Preece–Baines model.Reference Preece and Baines 14 , Reference Sayers, Baines and Tilling 15 The peak height velocity (PHV) is reached at about 12 years in females and 14 years in males.Reference Guo 16 , Reference Roche and Sun 17 Sun and SchubertReference Sun and Schubert 18 found that children in the lowest quartile of age at PHV had significantly greater percentages of body fat and higher fasting plasma insulin levels and triglycerides as adults than children in the highest quartile of age at PHV. Children for whom these stature- or BMI-based growth curve milestones are attained early or late are said to have curtailed or prolonged juvenile states, respectively.
These observations for both BMI and stature indicate that an accelerated tempo of maturation hastens the appearance of deleterious metabolic and cardiovascular risk factors. We intend to ascertain whether the timing of these physiologic milestones in childhood affect blood pressure later in life. To estimate growth and physiological milestones adequately, we use serial measurements from the Fels Longitudinal Study (FLS), the first study take high-intensity serial weight, stature and BMI measurements on the same individuals from birth into old ageReference Chumlea 19 . These serial data permit precise estimation of both BMI and stature growth curve parameters in childhood, including the timing of AR and PHV in childhoodReference Guo 16 . These values and the remaining BMI and stature growth parameters can then be investigated for associations with adult blood pressure. The estimated ages of attainment for AR and PHV are also used to classify participants within sex-specific curtailed and prolonged juvenile states, which can be used to investigate relationships between attainment of physiological milestones and adult blood pressure.
Methodology
Participants
This study examined a predominantly white subset of male and female participants from the FLS. The FLS has continuously enrolled patients since 1929. Participants are generally enrolled at birth and are not selected with regards factors known to be associated with body composition, cardiac health or other related conditions. Participants are examined semi-annually from birth until 18 years, and are examined biennially thereafter. More information on the FLS and its participants can be found elsewhere.Reference Roche and Sun 17 , Reference Roche 20 Parents gave their consent to participate in the study and gave permission for their infants to be enrolled. Offspring were asked to assent to participate in the study at 7–10 years and were asked again for their consent to participate when reaching 18 years of age. All procedures were approved by the Institutional Review Boards at Wright State University and Virginia Commonwealth University.
Measurements
Body size measurements were taken following recommendations in the Anthropometric Standardization Reference Manual.Reference Lohman, Roche and Martorell 21 Stature was measured to 0.1 cm using a Holtain stadio-meter, weight was measured to 0.1 kg using a SECA® scale, and BMI (kg/m2) was calculated as the ratio of weight to height2 (in meters). All the measurements were taken twice – a third measurement was taken if the difference between the first two exceeds established tolerance (0.3 kg for weight; 0.5 cm for height) – and the average values were used for analysis. SBP (mmHg) and DBP (mmHg) were each recorded as the average three readings from a standard mercury sphygmomanometer with participants in a seated position. Each blood pressure measurement was taken by rapidly inflating the arm cuff to the maximum level and deflating at a rate of 2 mmHg/s, with 30 s between readings.
Selection criteria
Two overlapping time periods were used to establish selection criteria. Childhood body size measures were captured from 2 to 25 years, whereas adulthood blood pressure measures were captured for subjects 20 years and older. Though these ranges overlap by 5 years, the measurements captured during each period are separate, and the extension allows for improved fit of childhood growth curves for stature and BMI. Based on these definitions, we include participants who (i) have at least 10 childhood body size measurements between 2 and 25 years of age, (ii) do not have unreasonable biological parameter estimates (estimated age, height or BMI <0 and/or an estimated root mean square error >1.5Reference Guo 16 ) based on the estimated growth curves (described below) and (iii) have at least one adulthood blood pressure measurement at 20 years of age or later.
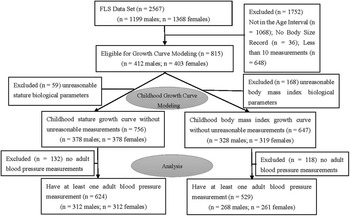
Among the total of 2567 FLS participants, there were 815 participants (412 male; 403 female) who had at least 10 body size measurements (stature or weight) during childhood. Of these, we excluded 59 subjects who had unreasonable growth parameter estimates (defined below) based on stature, and we excluded 168 subjects who had unreasonable growth parameter estimates based on BMI. From this point two cohorts were maintained: one for stature and another for BMI. Of the remaining 756 participants – comprising the stature analysis set – with at least 10 childhood stature measurements, 624 (312 male; 312 female) also had at least one blood pressure measurement in adulthood. Of the remaining 647 participants – comprising the BMI analysis set – with at least 10 childhood stature and weight measurements, 529 (268 males; 261 females) also had at least one adult blood pressure measurement. The CONSORT flow diagram is presented in Fig. 1.
CONSORT Flow Diagram of Fels Longitudinal Study Participants for Childhood Growth Parameter Modeling and Final Analysis Set.

Modeling of growth parameters
To simplify the large number of childhood body size measurements, we modeled growth curves with a small number of parameters. The parameter estimates that summarize and define the childhood growth curves can then be examined for associations with adult blood pressure measurements. This is similar to a previous examination of associations between childhood growth curves and adulthood measures of BMI and adiposity.Reference Guo 10
Preece–Baines model
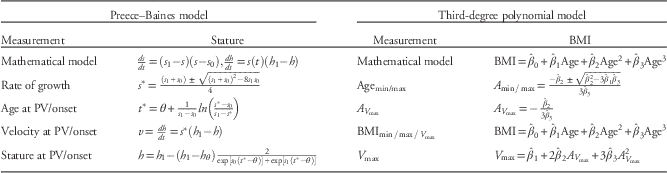
The Preece–Baines (PB) model is used to estimate growth curve parameters for childhood stature within each subject;Reference Preece and Baines 14 , Reference Guo 16 note that corrections to this model were made in 2013Reference Sayers, Baines and Tilling 15 and are used here. The PB model assumes that the rate of growth is proportional to the difference between stature at a particular age and age at maturity. The PB model identifies seven growth parameters, including estimated age, stature and velocity at pubertal onset, estimated age, stature and velocity at PHV and adult height (here estimated at age 25). The PB model and the equations for the estimated growth parameters are found in the left-hand side of Table 1.
Biological parameters derivatives for Preece–Baines model and third-degree polynomial model

BMI, body mass index; PV, peak velocity.
h
1 was stature at age 18; s
1 and s
0 were growth rate constants, defining pre-pubertal and pubertal velocity, respectively. θ was defined to locate the adolescent growth spurt along the time axis; h
θ
was stature at age θ. BMImin is estimated BMI at adiposity rebound; Agemin is estimated age of attainment of adiposity rebound; V
max is estimated maximum BMI velocity.
 ${\rm BMI}_{{V_{{{\rm max}}} }} $
is estimated BMI at maximum BMI velocity.
 $${\rm Age}_{{V_{{{\rm max}}} }} $$
is estimated age of attainment of maximum BMI velocity. BMImax is estimated maximum post-pubertal BMI; Agemax is estimated age of attainment of maximum post-pubertal BMI.
Third-degree polynomial model
A third-degree polynomial model is used to estimate childhood BMI growth curve parameters within each subject.Reference Guo 10 This model regresses childhood BMI values against a third-degree polynomial in terms of age, and estimates seven parameters, including age and BMI at AR, age, BMI and velocity at the point of maximum velocity, and age and BMI at the post-pubescent maximum. The model formulation and equations for the estimated growth parameters are found in the right-hand side of Table 1.
Curtailed juvenile state
Juvenile state is defined separately using the estimated age at PHV for stature, and using the estimated age at AR for BMI. For stature, estimated age at PHV was divided into quartiles. Subjects for whom the estimated age at PHV was in the first quartile were categorized as having an ‘early’ or ‘curtailed’ juvenile state, subjects in the second and third quartiles were categorized as having a ‘normal’ juvenile state, and subjects in the fourth quartile were categorized as having a ‘late’ or ‘prolonged’ juvenile state. For BMI, estimated age at AR was divided into quartiles. Subjects for whom the estimated age at AR was in the first quartile were categorized as having an ‘early’ juvenile state, subjects in the second and third quartiles were categorized as having a ‘normal’ juvenile state, and subjects in the fourth quartile were categorized as having a ‘late’ or ‘prolonged’ juvenile state.
Statistical analyses
The PB models of childhood stature growth curves were fit using the SAS nonlinear least squares procedure in which Marquard’s (1963) iterative procedure was employed to estimate the parameters. The third-degree polynomial models of childhood BMI growth curves were fit using the REG procedure in SAS (version 9.4, SAS Institute Inc., Cary, NC, USA).
Associations between childhood stature and BMI growth curve parameters with adulthood blood pressure measurements was estimated using a linear mixed model. Each childhood growth curve parameter was analyzed separately for each adulthood blood pressure (SBP and DBP) measurement; males and females were also analyzed separately. These models included either adult SBP or DBP as a continuous outcome, with fixed effects for the particular childhood growth curve parameter, adult age and their interaction. A participant-level random effect was included to account for within-subject dependence due to repeated adulthood blood pressure measurements, which was modeled with a compound symmetric correlation structure [note that models incorporating ante-dependence structures (e.g. spatial power) failed to converge]. These models were fit using the GLIMMIX procedure in SAS.
For determining juvenile state, age at peak velocity for stature and age at AR were summarized with quartiles by gender. Linear mixed-effect repeated measures ANOVA models were used to test the relationships between adult blood pressure measurements and the two juvenile state classifications (one based on stature, the other based on BMI). The continuous responses for this model are adult SBP or DBP (modeled separately), with fixed effects for adult age, a three-level indicator for juvenile state (early, normal or late) and an adult age – juvenile state interaction. A participant-level random effect was included to account for within-participant dependence, which was modeled using a compound symmetry covariance structure. Comparisons of predicted adult blood pressure measurements for any two levels of juvenile state were made at 20, 30 and 40 years of age. Models were analyzed separately for males and females to account for different growth curves in general. The GLIMMIX procedure in SAS was used for these analyses.
Results
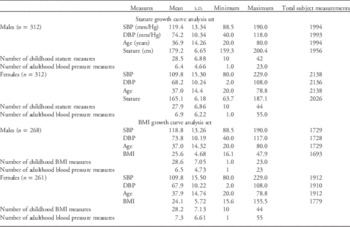
Adulthood measurements are summarized in Table 2 for both the stature and BMI analysis sets. Here we see that on an average males have higher SBP and DBP than females, though the average ages are between 37 and 38 in both analysis sets for both men and women. The average subject has around 28 childhood body size measurements (with a minimum of 10), providing sufficient observations for estimating childhood growth curves; the maximum numbers of childhood measurements (in each case >40) imply that some FLS participants visited the facilities more than once per year on average. The average participant also provided over six adult blood pressure measurements (pairs of SBP and DBP measurements were either both present or both missing), necessitating the repeated measures analysis plan stated in the Methods section.
Summary statistics of adult stature and body mass index (BMI) measurements

DBP, diastolic blood pressure; SBP, systolic blood pressure.
Childhood stature growth parameters v. adulthood blood pressure
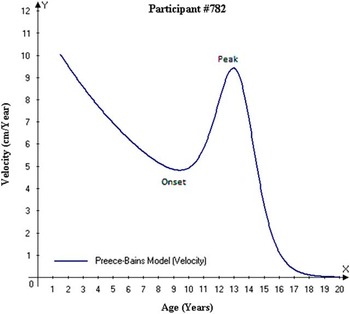
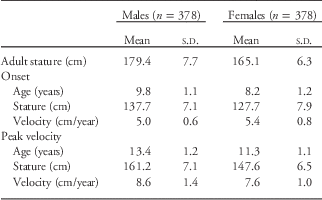
An example of an estimated stature growth curve (for subject 782) is provided in Fig. 2. In the second panel, we see the first minimum between 9 and 10 years, which indicates the onset of accelerated stature growth. We can also see the attainment of peak growth velocity around age 13, when this subject is growing in height most rapidly. Estimates for all stature-based growth curve parameters are provided in Table 3 for male and female subjects. Here we notice the estimated age of growth onset is 9.8 years in males and 8.2 years in females, whereas the estimated age of peak velocity is 13.4 years in males and 11.3 years in females.
Predicted statures growth velocity from Preece-Baines Model from 2 to 20 years.

Derived stature parameters from Preece–Baines (PB) model for males and females

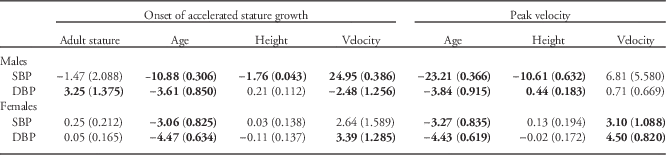
Summaries of the associations between the estimated childhood stature growth parameters and adult blood pressures are listed in Table 4. Ages at growth onset and at peak velocity was significantly and negatively associated with adult SBP and DBP in both males and females. For these two measures, earlier attainment of growth onset or peak velocity in childhood was associated with increased blood pressures in adulthood. Estimated height at growth onset and peak velocity were also significantly associated with SBP in males, with increased height in childhood being associated with lower blood pressure in adulthood. Velocity at growth onset was significantly related to adult blood pressure in males and with DBP in females, though there was no consistent pattern between the associations, whereas the growth rate at peak velocity was significantly and positively associated with adult blood pressures in females but not males.
The associations between the estimated childhood stature growth parameters and adult blood pressures

SBP, systolic blood pressure; DBP, diastolic blood pressure.
For each cell, the number represents the estimated regression slope parameter, and the number in brackets represents the s.e. of the estimated regression slope parameter.
Bold typeface indicates a significant relationship at P<0.05.
Childhood BMI growth parameters v. adulthood blood pressure
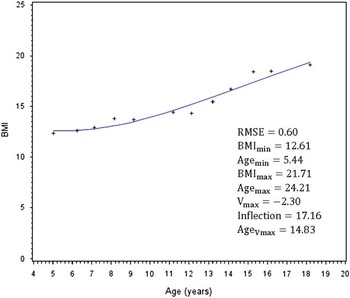
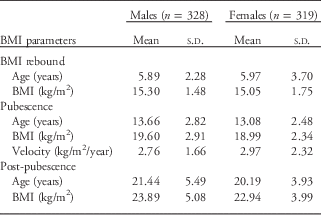
An example of the estimated BMI growth curve for a particular subject is found in (Fig. 3). Here we see the AR occurring between 5 and 6 years, the post-pubertal BMI maximum occurring around age 24, and the velocity maximum, represented by the inflection point between 13 and 15 years. Estimates of the BMI-based growth curve parameters are found in Table 5, where we see the estimated age of the AR is 5.9 in males and 6.0 in females, the estimated age of peak velocity is 13.7 in males and 13.1 in females, and the estimated age of BMI maximum is 21.4 in males and 20.2 in females.
Observed and predicted individual patterns of change in BMI with biological parameters from 4 to 20 years.

Derived body mass index (BMI) parameters from third-degree polynomial model for males and females

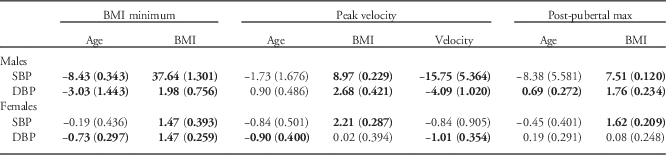
Table 6 contains the associations between the estimated BMI-based growth parameters and adult blood pressure. Age of attainment of the BMI minimum is significantly and negatively associated with SBP and DBP in males, and with DBP but not SBP in females. This implies that early ARs in children are generally associated with increased blood pressures in adulthood. Age at peak BMI velocity and at BMI maximum were generally not associated with adult blood pressures. Estimated BMI at peak velocity and at BMI maximum were significantly and positively associated with SBP in males and females, and with DBP in males, implying that children with larger BMIs at these times were likely to have increased blood pressures as adults. The estimated rate of growth at peak velocity was negatively associated with SBP and DBP in males and with DBP in females, implying that children with lower BMI growth rates at the time of peak velocity were likely to have increased blood pressures as adults.
The associations between the estimated childhood body mass index (BMI) growth parameters and adult blood pressures

SBP, systolic blood pressure; DBP, diastolic blood pressure.
For each cell, the number represents the estimated regression slope parameter, and the number in brackets represents the s.e. of the estimated regression slope parameter.
Bold typeface indicates a significant relationship at P<0.05.
Childhood juvenile state v. adulthood blood pressure
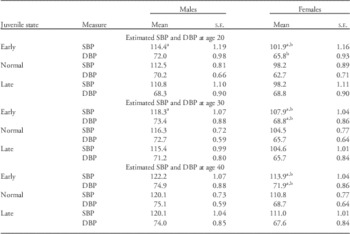
The first and third quartiles for the estimated age at peak velocity in the stature-based growth curve models are 12.82 and 14.14 in males and 10.71 and 12.01 in females; recall these values are used to categorize this sample into three corresponding groups: early, normal and late achievement. The resulting adult blood pressure estimates for the three juvenile states in males and females are presented in Table 7. Here we see that early attainment of peak velocity in males leads to significantly larger adulthood SBP and DBP than does late attainment at age 20 and 30, and leads to larger adulthood SBP at age 40. In females, early attainment leads to significantly higher adulthood DBP than does late attainment at ages 20, 30 and 40, and leads to significantly larger adulthood SBP than does normal attainment at ages 30 and 40. These results imply that children experiencing prolonged juvenile states have lower adult blood pressure than those children experiencing accelerated juvenile states.
The relationship between stature-based juvenile states and adult blood pressures at age 20, 30 and 40

SBP, systolic blood pressure; DBP, diastolic blood pressure; BP, blood pressure.
a Early BP significantly different from Late BP (P<0.05).
b Early BP significantly different from normal BP (P<0.05).
c Normal BP significantly different from late BP (P<0.05).
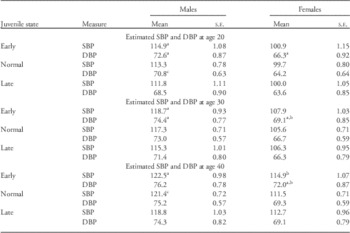
The first and third quartiles for the estimated age of attainment of the BMI minimum were 4.97 and 6.83 in males and 4.63 and 6.62 in females. The resulting adult blood pressure estimates for the three juvenile states in males and females are presented in Table 8. Here we see that early attainment of the AR in males leads to significantly larger SBP at ages 20 and 30. In females early attainment leads to significantly larger SBP at ages 20, 30 and 40 than does normal and late attainment, and leads to significantly larger DBP at ages 20, 30 and 40 than does normal achievement, and at ages 30 and 40 than does late achievement. As observed with the stature growth curves, these results also show evidence of the protective effect of a prolonged juvenile state in lowering adult blood pressure relative to children with accelerated juvenile states.
The relationship between body mass index (BMI)-based juvenile states and adult blood pressures at age 20, 30 and 40

SBP, systolic blood pressure; DBP, diastolic blood pressure; BP, blood pressure.
a Early BP significantly different from Late BP (P<0.05).
b Early BP significantly different from Normal BP (P<0.05).
Discussion
In this manuscript, we summarized childhood growth curves with parametric models, specifically using the Preece–Baines model for statureReference Preece and Baines 14 – Reference Guo 16 and the third-degree polynomial model for BMI.Reference Guo 10 These parameters where then analyzed for associations with adult blood pressure. We found that the ages of achievement for stature-based growth onset and peak velocity, and also for BMI-based AR, were negatively associated with adult SBP and DBP in both males and females. These findings imply that children who begin to grow in height or size sooner than others tend to have higher blood pressure as adults. Estimated BMI at peak velocity and at BMI maximum were positively associated with adult blood pressure, whereas the rate at peak BMI velocity was negatively associated with adult blood pressure, implying that children with bigger bodies who are growing relatively slowly are likely to have elevated blood pressure as adults. Other childhood growth parameters were less consistently associated with adult blood pressure.
In addition, we also used the ages of attainment of PHV and AR to classify FLS participants into one of three juvenile states (early, normal or late), hypothesizing that early attainment of these events in childhood could lead to increased blood pressures in adulthood. We found that normal and late attainment in general has a protective effect at reducing blood pressure, though the effect differs between SBP and DBP, between genders, and across ages. In males the most consistent finding is that early attainment of PHV or the BMI AR is associated with increased SBP at ages 20 and 30 relative to normal or late achievers. In females, early achievement of PHV is associated with increased DBP compared with late attainment at ages 20, 30 and 40, whereas early attainment of the AR is associated with increased SBP and DBP compared with normal and late attainment at almost every age. These results are similar to previous studies that have shown evidence of negative relationships between early attainment of the AR and adult cardiovascular health metrics other than blood pressure.Reference Lakshmy 11 , Reference Barker 12
Added to existing evidence that adult hypertension affects cardiovascular health,Reference Coca 3 , Reference Simone 4 the evidence presented in this manuscript suggests that adult hypertension risk can be gauged starting in early childhood by measuring stature and BMI growth trends. Parents or physicians could take measures in early childhood to delay the AR or limit BMI growth (presuming height, fat-free mass and their growth are less adjustable), such as proper nutritionReference O’Dea and Wilson 22 or possibly infant breastfeeding.Reference Arenz 23 , Reference Owen 24 For children with established growth trends that exhibit the early attainment of AR or PHV, parents and physicians could attempt to mitigate adult hypertension risk by suggesting or implementing changes in nutrition or physical activity.Reference Ebbeling, Pawlak and Ludwig 25 , Reference Moore 26 Also possible is the phenomenon of accelerated ‘catch-up’ growth in low-birth infants, which has been linked to cardiovascular disease in adults.Reference Barker and Bagby 27 Ensuring adequate pre-natal nutrition,Reference Kramer 28 avoiding drug and alcohol abuse,Reference Bada 29 and reducing stress,Reference Rondo 30 are potentially modifiable maternal actions that could decrease the likelihood of low birth weight, which in turn could delay the timing of the AR.
The predominant strength of the research presented here is the large number of observations available per participant in both childhood and adulthood. These abundant data allowed for precise estimation of childhood stature and BMI growth curves. The combination of serial childhood and adulthood measurements allowed for associations to be estimated between events (childhood attainment of AR; adulthood blood pressure) that were nearly 35 years apart.
The research presented in this manuscript also has several potential limitations. Any causal pathways are as yet unclear, as it remains to be seen is whether the timing of the growth trends in particular are what leads to increased blood pressure in adulthood or if the more likely culprit is the resulting increased body mass. Though unreported in the Results section, estimated BMI at post-pubescent maximum was significantly associated with adult BMI (at the time of blood pressure measurements in adulthood) in both males (Pearson linear correlation coefficient: r=0.70, P<0.0001) and females (r=0.50, P<0.0001). This seems to suggest that post-pubertal BMI that childhood growth trends tend toward are only a part of the picture in helping to explain adult hypertension, and that the growth trend itself may also play a partial role. Nearly all FLS participants are non-Hispanic white subjects from southwestern Ohio, and do not comprise a nationally representative sample. Therefore, the results and conclusions reported here may not be applicable or generalizable to other races, ethnicities or regions. There was a wide range in age of the adult FLS participants studied here (20–80 years), though adult age and its interaction with the estimated childhood growth parameters and with the juvenile state classification were included. We were not able to account for lifestyle characteristics (such as physical activity, smoking history and alcohol use) due to missing data, nor did we account for other adulthood cardiovascular or metabolic measurements, such as cholesterol, body fat or diabetes status.
Acknowledgments
None.
Financial Support
The research presented in this manuscript was supported by grant R01HL113697 from the National Heart, Lung and Blood Institute and the National Institutes of Health.
Conflicts of Interest
None.
Ethical Standards
The authors assert that all procedures contributing to this work comply with the ethical standards of the Helsinki Declaration of 1975, as revised in 2008. All participants provided written informed consent to participate in this study, and all procedures were approved by the Institutional Review Boards at Wright State University and Virginia Commonwealth University.