


Introduction
Invasive forest insects are among the most serious threats to ecosystems, biodiversity, and forest-based economies worldwide. Global trade and human activity have accelerated their spread across biogeographic barriers over the past century (Hulme, Reference Hulme2009; Liebhold et al., Reference Liebhold, Brockerhoff, Garrett, Parke and Britton2012). Climate change and rapid land-use transformation further increase opportunities for non-native pests to establish and spread in new environments. Once introduced, invasive insects can cause cascading ecological effects, from declines in tree health and productivity to shifts in forest structure, nutrient cycling, and biodiversity. Economically, outbreaks lead to billions of dollars in timber losses, tree mortality, and management costs (Grégoire et al., Reference Grégoire, Raffa, Lindgren, Vega and Hofstetter2015), in addition to indirect impacts on ecosystem services and forest resilience. China is particularly vulnerable because of its high biodiversity, extensive forests spanning boreal to tropical regions, rapid economic development, large-scale reforestation programmes, and extensive trade networks (Seebens et al., Reference Seebens, Blackburn, Dyer, Genovesi, Hulme, Jeschke, Pagad, Pyšek, Winter, Arianoutsou, Bacher, Blasius, Brundu, Capinha, Celesti-Grapow, Dawson, Dullinger, Fuentes, Jäger, Essl, Kenis, Kreft, Kühn, Lenzner, Liebhold, Mosena, Moser, Nishino, Pearman, Pergl, Rabitsch, Rojas-Sandoval, Roques, Rorke, Rossinelli, Roy, Scalera, Schindler, Štajerová, Tokarska-Guzik, van Kleunen, Walker, Weigelt, Yamanaka and Essl2017). Within this context, bark beetles (Coleoptera, Curculionidae, and Scolytinae) rank among the most destructive forest insects (Raffa et al., Reference Raffa, Aukema, Bentz, Carroll, Hicke, Turner and Romme2008; Ramsfield et al., Reference Ramsfield, Bentz, Faccoli, Jactel and Brockerhoff2016). Known for their ability to colonise, reproduce, and cause large-scale tree mortality rapidly, bark beetles have caused extensive ecological disruption in coniferous forests across the Northern Hemisphere.
Among these bark beetles, a particularly notable example is Phloeosinus aubei Perris, which has emerged as an increasingly concerning forest pest. Native to East Asia, specifically China, Korea, and Japan, P. aubei has been expanding both within and beyond its original range in recent decades (Seidl et al., Reference Seidl, Schelhaas, Lindner and Lexer2009). This bark beetle primarily targets members of the Cupressaceae family, including genera such as Cupressus, Platycladus, Thuja, and Chamaecyparis. These hosts are ecologically and economically important: they are widely planted for timber, ornamentals, windbreaks, and ecological restoration across China (Fung, Reference Fung1994). Reports of dieback and widespread mortality in Cupressaceae plantations and urban landscapes have been steadily increasing, elevating P. aubei to the status of an emerging forest pest (Ahmad et al., Reference Ahmad, Xu, Deng, He, Ali and Zhuo2025). Unlike many bark beetles that typically attack weakened, stressed, or recently felled trees, P. aubei is capable of infesting healthy and vigorous individuals under favourable environmental conditions (Branco et al., Reference Branco, Nunes, Roques, Fernandes, Orazio and Jactel2019). This ability significantly heightens its risk potential, as it can damage both natural forests and anthropogenic plantations even in the absence of obvious stressors. The life cycle of P. aubei, like that of many bark beetles, is strongly influenced by temperature. Warmer winters reduce overwintering mortality, while longer growing seasons allow for additional generations per year (Bentz et al., Reference Bentz, Régnière, Fettig, Hansen, Hayes, Hicke, Kelsey, Negrón and Seybold2010; Jactel et al., Reference Jactel, Moreira and Castagneyrol2021). These climatic factors, driven by ongoing global climate change, are expected to enhance the reproductive success, population density, and spread of P. aubei. Consequently, climate change is likely to exacerbate the threat posed by this species, particularly in newly suitable areas across China where it has not yet established. Given these risks, understanding the environmental drivers of P. aubei distribution is a prerequisite for effective monitoring and management. Traditional post-outbreak control measures are often ineffective once bark beetle populations reach epidemic levels. A more proactive strategy would be to identify areas at risk before establishment. However, for P. aubei, little is known about its current potential distribution in China, the environmental drivers of its distribution, or how climate change may alter its suitable range. Species distribution models (SDMs) provide a powerful means of filling these gaps by linking known occurrence records with environmental variables to estimate habitat suitability and potential distribution (Elith and Leathwick, Reference Elith and Leathwick2009).
SDMs, also known as ecological niche models (ENMs), use occurrence records and environmental variables to characterise a species’ ecological niche in a multidimensional environmental space. They then project the estimated niche requirements onto selected spatiotemporal scales to predict habitat suitability and potential distribution (Guo et al., Reference Guo, Zhao, Qiao, Wang, Wei, Wang, Gu and Li2020; Tessarolo et al., Reference Tessarolo, Lobo, Rangel and Hortal2021; Xavier and Anna, Reference Xavier and Anna2021). These predictions allow researchers and policymakers to identify potentially suitable areas and prioritise high-risk regions for monitoring. Ensemble modelling approaches, such as those implemented in the BIOMOD2 R package, have advanced SDMs by increasing predictive reliability and reducing the uncertainty inherent in single-algorithm models (Thuiller et al., Reference Thuiller, Lafourcade, Engler and Araújo2009; Xu et al., Reference Xu, Luo, Peterson, Zhao, Yu, Ye, Sun, Yan and Wang2025). BIOMOD2 consolidates a suite of algorithms – including generalised linear models, generalised additive models, classification trees, random forests (RF), maximum entropy (MaxEnt) models, artificial neural networks (ANN), and boosting techniques – into a unified framework. This ensemble strategy generates consensus predictions by weighting models according to their performance, thereby reducing the biases and limitations associated with any single algorithm (Araújo and New, Reference Araújo and New2007; Barbet-Massin et al., Reference Barbet-Massin, Jiguet, Albert and Thuiller2012). The approach is especially advantageous for large, environmentally diverse countries such as China, where species’ ecological responses may vary across heterogeneous landscapes and complex climatic gradients (Qiao et al., Reference Qiao, Soberón and Peterson2015). However, despite the suitability of ensemble SDMs for such regions, their application to P. aubei in China remains limited.
Although P. aubei has received increasing attention as a forest pest (Ahmad et al., Reference Ahmad, Xu, Deng, He, Ali and Zhuo2025; Ning et al., Reference Ning, Deng, Huang, Xiao, Huang, Hong and Yi2025), few studies have systematically modelled its potential distribution (Ahmad et al., Reference Ahmad, Xu, Deng, He, Ali and Zhuo2025), unlike other forest pests for which SDMs have been widely applied (Gao et al., Reference Gao, Xu, Liu, Zhao and Shi2021; Wu et al., Reference Wu, Xu, Peng and Zhuo2024). Most existing research has focused on its biology, host associations, or localised damage reports (Branco et al., Reference Branco, Nunes, Roques, Fernandes, Orazio and Jactel2019; Ahmad et al., Reference Ahmad, Xu, Deng, He, Ali and Zhuo2025), leaving a clear gap in predictive understanding of its ecological niche and invasion risk (Elith and Leathwick, Reference Elith and Leathwick2009; Xu et al., Reference Xu, Luo, Peterson, Zhao, Yu, Ye, Sun, Yan and Wang2025). In China, large-scale afforestation and ecological restoration programmes are continuously expanding forest cover (Ren et al., Reference Ren, Liu and Bai2023), and ignoring pest risks could inadvertently facilitate the spread of species such as P. aubei (Hulme, Reference Hulme2009; Liebhold et al., Reference Liebhold, Brockerhoff, Garrett, Parke and Britton2012; Branco et al., Reference Branco, Nunes, Roques, Fernandes, Orazio and Jactel2019). Therefore, predicting its current and future potential suitable areas is necessary to support monitoring and management (Elith and Leathwick, Reference Elith and Leathwick2009; Wu et al., Reference Wu, Xu, Peng and Zhuo2024; Xu et al., Reference Xu, Luo, Peterson, Zhao, Yu, Ye, Sun, Yan and Wang2025). To address these gaps, this study developed an ensemble SDM for P. aubei across China using BIOMOD2, based on georeferenced occurrence records and bioclimatic, topographic, and anthropogenic predictors. We projected current and future potential suitable areas under multiple climate scenarios and identified high-risk regions to support early warning and forest pest management in China.
Materials and methods
Species occurrence data
The occurrence data for P. aubei used in this study were compiled from multiple sources, including the Global Biodiversity Information Facility (https://www.gbif.org/), the Chinese Forest Pest Databases, published pest monitoring studies (Fung, Reference Fung1994; GBIF, 2022), and digitised maps from field surveys, yielding an initial total of 187 occurrence records. All coordinates were standardised to the World Geodetic System 1984, checked for spatial accuracy, and mapped in ArcGIS version 10.8. Records with duplicate entries, vague locality information, or locations falling outside the study boundaries were excluded, leaving 142 valid records. To reduce spatial autocorrelation and sampling bias, we used the ENMTools package to spatially thin the occurrence data, retaining only one occurrence record per 5 km2 grid cell (Aiello-Lammens et al., Reference Aiello-Lammens, Boria, Radosavljevic, Vilela and Anderson2015). This procedure yielded 69 presence points for modelling. Spatial thinning, following best practices for species distribution modelling, improves model performance by ensuring independence among points and minimising overfitting in presence-only models (Boria et al., Reference Boria, Olson, Goodman and Anderson2014; Wang et al., Reference Wang, Yin, Wang, Chen, Mao, Lin, Gong and Wang2023; Kang et al., Reference Kang, Lin, Yin, Han, Zhu, Guo, Tang and Li2025).
Environmental predictors
Environmental predictors were obtained primarily from the WorldClim v2.1 database (Fick and Hijmans, Reference Fick and Hijmans2017; Yin et al., Reference Yin, He, Pan, Liu, Wu and Li2022) at a spatial resolution of 2.5 arc-minutes (∼5 km). We initially considered 25 variables: 19 bioclimatic variables, three topographic variables (elevation, slope, aspect; derived from the Shuttle Radar Topography Mission, SRTM; https://earthexplorer.usgs.gov), and three additional variables representing ecological and anthropogenic conditions – annual mean UV-B radiation (Allouche et al., Reference Allouche, Tsoar and Kadmon2006; https://www.esa.int), vegetation cover (MODIS Vegetation Continuous Fields; https://modis.gsfc.nasa.gov), and the Human Footprint Index (Venter et al., Reference Venter, Sanderson, Magrach, Allan, Beher, Jones, Possingham, Laurance, Wood, Fekete, Levy and Watson2016; https://sedac.ciesin.columbia.edu). Bioclimatic variables reflect temperature and precipitation trends, seasonal variability, and extreme conditions that are ecologically relevant to bark beetle survival and dispersal (Liu et al., Reference Liu, White and Newell2013, Reference Liu, Nie, Chen, Guo, Zhang, Xiao, Huang and Xie2024; Legg, Reference Legg2021; Yang et al., Reference Yang, Jia and Hua2025). Topographic variables were included to capture elevation-driven climatic gradients, while UV-B radiation, vegetation cover, and human footprint provide proxies for habitat quality and human disturbance.
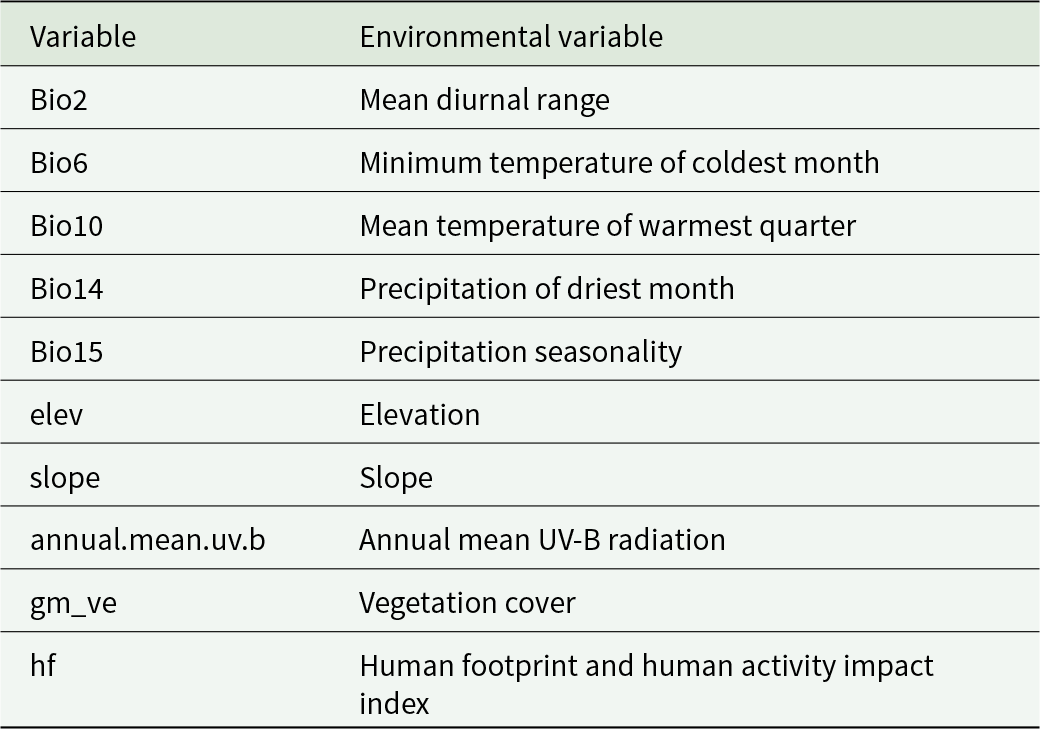
When predicting the potential distribution of P. aubei, the climatic and environmental variables may exhibit strong autocorrelation, and not all variables are necessarily required for prediction. To avoid overfitting caused by multicollinearity among environmental factors, this study used Pearson correlation coefficients (r) to diagnose multicollinearity among environmental variables (see Fig. S2). Based on modelling results and ecological interpretability, variables with absolute correlation coefficients greater than 0.8 were excluded to reduce the impact of multicollinearity on model predictions. Ultimately, 10 environmental variables were selected for subsequent modelling (table 1).
Environmental variables used in the BIOMOD2 ensemble model

Table 1 Long description
Two columns pair each Variable code with its Environmental Variable name. Temperature variables are Bio2, Mean Diurnal Range; Bio6, Minimum Temperature of Coldest Month; and Bio10, Mean Temperature of Warmest Quarter. Precipitation variables are Bio14, Precipitation of Driest Month; and Bio15, Precipitation Seasonality. Topography variables are elev, Elevation; and slope, Slope. Additional variables are annual.mean.uv.b, Annual Mean UV-B Radiation; gm_ve, Vegetation Cover; and hf, Human Footprint and Human Activity Impact Index.
Species distribution modelling
Species distribution modelling was conducted in R using the BIOMOD2 package (v4.2; Thuiller et al., Reference Thuiller, Lafourcade, Engler and Araújo2009), which integrates multiple algorithms to improve predictive reliability. We employed 12 algorithms: generalised linear models (GLM), generalised additive models (GAM), classification tree analysis (CTA), ANN, generalised boosted regression models (GBM), flexible discriminant analysis (FDA), RF, multivariate adaptive regression splines (MARS), MaxEnt, MaxEnt via Maxnet, eXtreme Gradient Boosting (XGBoost), and surface range envelope (SRE) (Araújo and New, Reference Araújo and New2007; Zhang et al., Reference Zhang, Wu and Liang2024). For each modelling run, pseudo-absence points equal in number to presence records were randomly generated across the study area, excluding a 5 km buffer zone around known presences to avoid spatial overlap (Figure S3). Presence and pseudo-absence data were split into training (70%) and testing (30%) subsets, and each algorithm was replicated three times to ensure model robustness.
Model parameters were set as follows: RF with ‘ntree = 500’ and ‘mtry = sqrt(nvars)’; XGBoost with ‘nrounds = 100’, ‘max_depth = 3’, and ‘eta = 0.3’; MaxEnt with optimised QPT parameters (see Supplementary Methods); all other algorithms used default BIOMOD2 settings. Three-fold cross-validation was employed for each replication.
Future distribution shifts were assessed using projections from the IPSL-CM6A-LR global climate model (GCM) obtained from the CMIP6 dataset (Gao et al., Reference Gao, Xu, Liu, Zhao and Shi2021; Wu et al., Reference Wu, Xu, Peng and Zhuo2024), selected for its comprehensive representation of Asian climate dynamics. Three future climate scenarios (SSP1-2.6, SSP2-4.5, and SSP5-8.5) were selected to represent low-, intermediate-, and high-emission trajectories for the 2050s, 2070s, and 2090s, respectively. These projections provide insights into the potential range expansion of P. aubei under ongoing climate change. The resulting ensemble forecasts were used to identify areas of high habitat suitability and to inform forest pest risk management, including urban and rural forestry planning across China.
Model evaluation and ensemble forecasting
Model performance was evaluated using receiver operating characteristic (ROC) curve analysis and the true skill statistic (TSS). Models with TSS ≥0.7 were considered sufficiently accurate and retained for ensemble forecasting. The ensemble prediction was generated using a weighted mean approach (EMwmean), where individual model outputs were weighted according to their TSS scores. Binary presence–absence maps were produced by applying the TSS-maximising threshold, which balances sensitivity and specificity (Allouche et al., Reference Allouche, Tsoar and Kadmon2006; Haramboure et al., Reference Haramboure, Labbé, Baldet, Damiens, Gouagna, Bouyer and Tran2020; Koyama et al., Reference Koyama, Dias and Antunes2022; Huang et al., Reference Huang, An, Huang, Tan, Quan, Chen, Zhou and Liao2023; Wu et al., Reference Wu, Xu, Peng and Zhuo2024). Ensemble modelling has been shown to outperform individual algorithms in predicting species distributions, particularly in environmentally heterogeneous regions like China. This approach integrates the strengths of multiple models, improving overall predictive reliability and robustness.
GIS analysis and mapping
All spatial analyses were performed in ArcGIS 10.8 (Esri, 2025). Model outputs were re-projected to the WGS 1984 geographic coordinate system and clipped to China’s national boundary. Final distribution maps were generated to highlight regions of high habitat suitability for P. aubei, with particular attention to areas overlapping coniferous forests and major forestry zones (Kühn et al., Reference Kühn, Loguercio, Caselli and Thren2021). Suitable habitats were classified into three categories – low, medium, and high – based on percentile thresholds of the ensemble prediction values: low (10–33%), medium (33–66%), and high (> 66%). These predictive maps provide a valuable foundation for early-warning systems and inform forest management and pest mitigation strategies, especially in ecologically or economically vulnerable regions.
Results
Model performance and evaluation
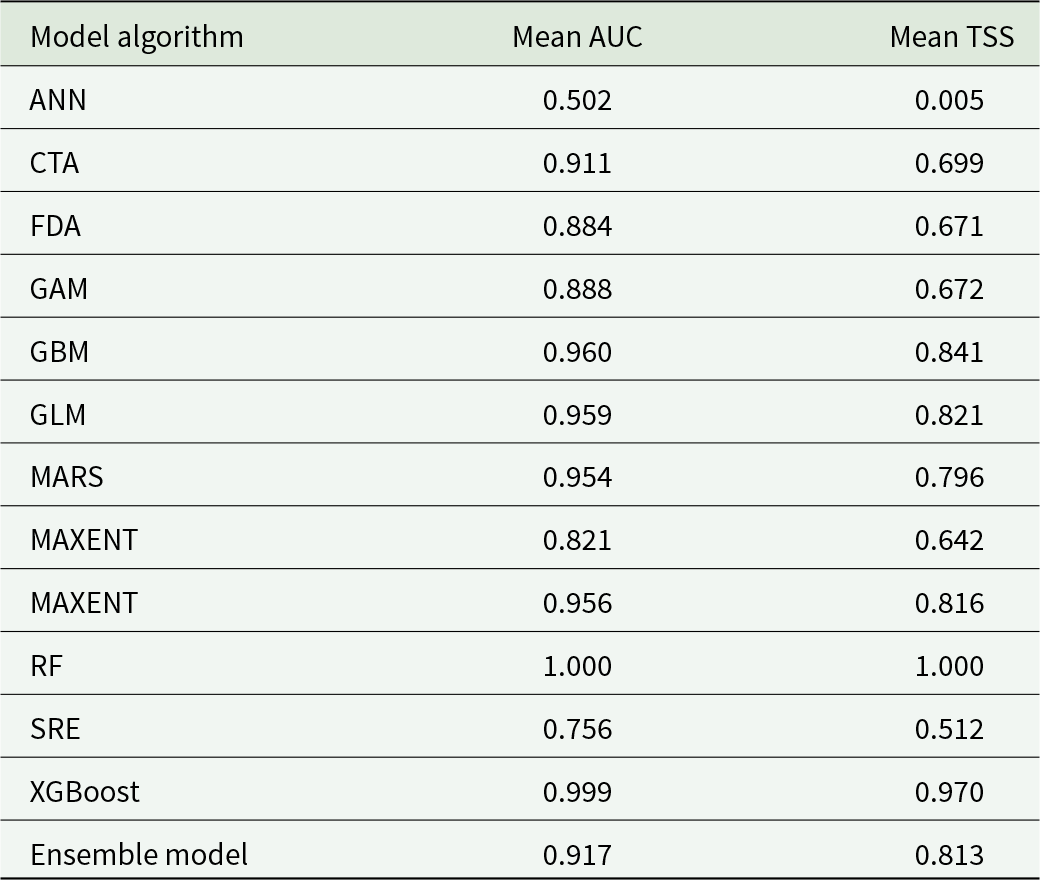
Results showed that algorithm performance, assessed by AUC and TSS, varied among models (table 2; Figure S4). Models with ROC curves closer to the top-left corner and higher TSS values exhibited stronger discriminatory power. RF showed excellent performance (AUC = 1.000, TSS = 1.000), although such near-perfect values may indicate overfitting. CTA, FDA, GAM, GBM, GLM, MARS, MAXent, Maxnet, and XGBoost showed good performance, with AUC >0.7 and TSS ≥0.7. In contrast, ANN performed poorly (AUC = 0.502; TSS = 0.005), and SRE had an acceptable AUC (0.756) but a TSS below the retention threshold (0.512). Models with good or excellent performance were therefore retained to build the ensemble model. The ensemble model showed robust predictive performance, with an average AUC of 0.917 and TSS of 0.813 across replicates.
Performance metrics of individual and ensemble models

Table 2 Long description
Performance metrics are listed for each model algorithm using two columns, mean auc and mean tss. Rows report ann 0.502 and 0.005; cta 0.911 and 0.699; fda 0.884 and 0.671; gam 0.888 and 0.672; gbm 0.960 and 0.841; glm 0.959 and 0.821; mars 0.954 and 0.796; maxent 0.821 and 0.642; maxnet 0.956 and 0.816; rf 1.000 and 1.000; sre 0.756 and 0.512; xgboost 0.999 and 0.970. The ensemble model row reports mean auc 0.917 and mean tss 0.813. Mean auc values range from 0.502 to 1.000, and mean tss values range from 0.005 to 1.000.
Importance of environmental factors and response curves of key environmental variables
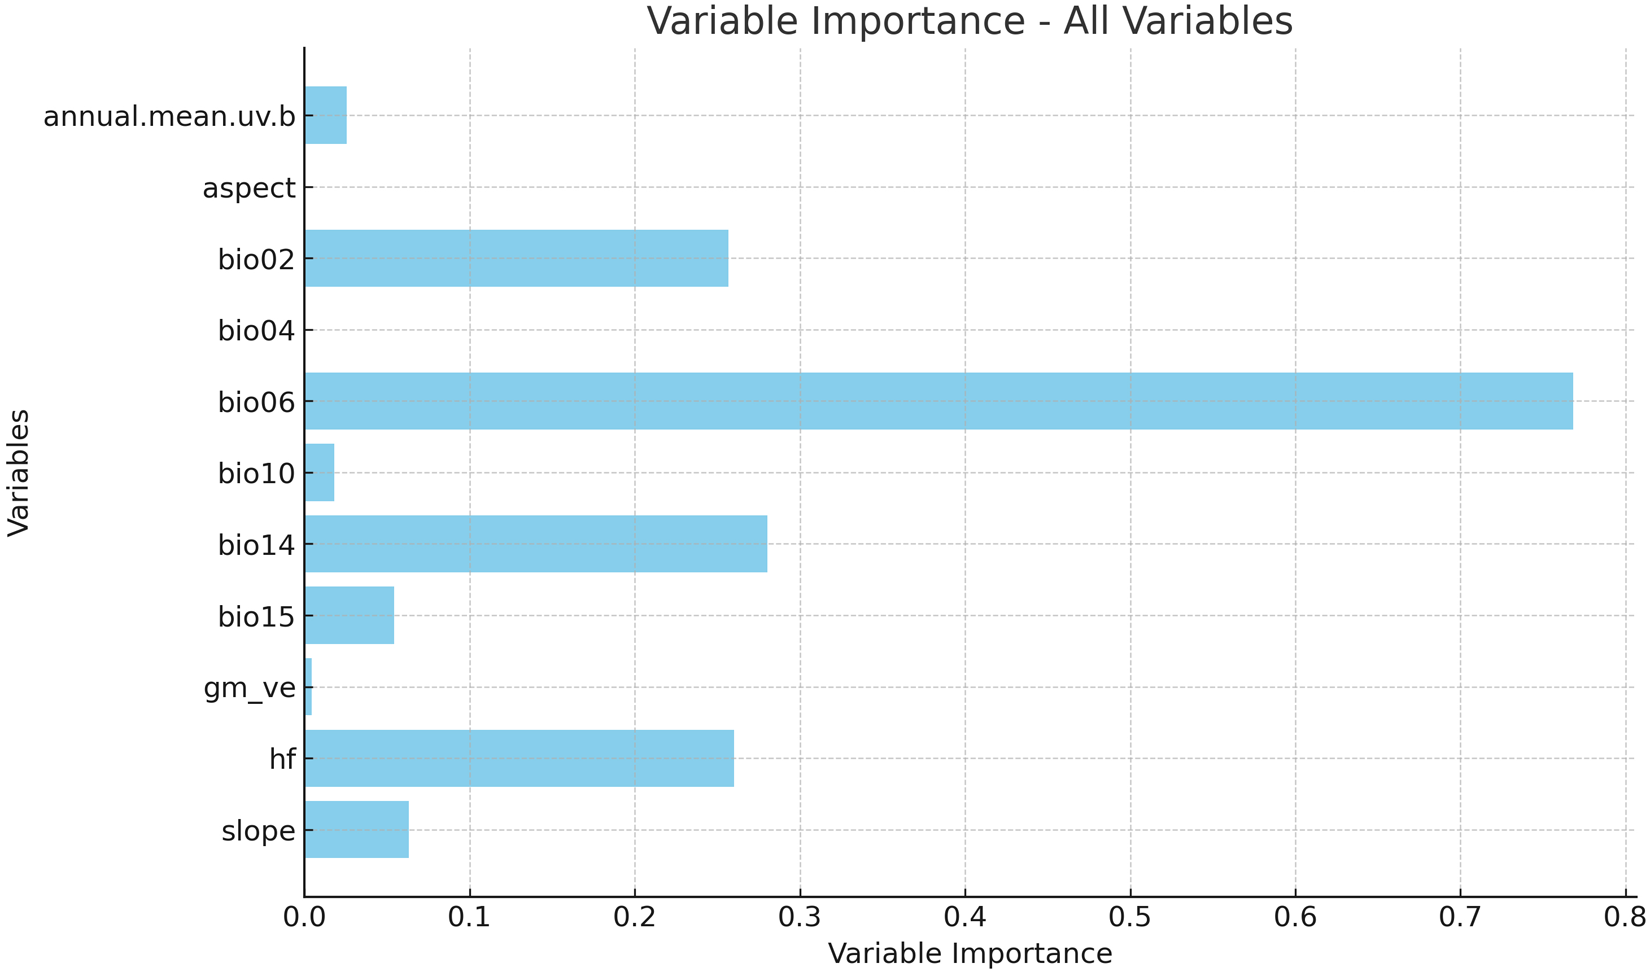
Using the ensemble model, we further assessed the relative importance of environmental predictors (fig. 1). The results showed that the Minimum Temperature of the Coldest Month (Bio6) was the dominant driver of habitat suitability (45.61%), followed by Mean Diurnal Range (Bio2, 16.01%) and Human Footprint (hf, 15.50%). Precipitation of the Driest Month (Bio14) contributed 13.14%, slope 3.76%, Precipitation Seasonality (Bio15) 3.20%, and annual mean UV-B radiation 1.60%. Other variables, including vegetation cover (gm_ve, 0.22%), had negligible influence. Although aspect and Temperature Seasonality (Bio04) exhibited 0% relative importance, potentially owing to statistical artefacts, both variables were nonetheless included in model construction.
Relative importance of environmental variables in the BIOMOD2 ensemble model.

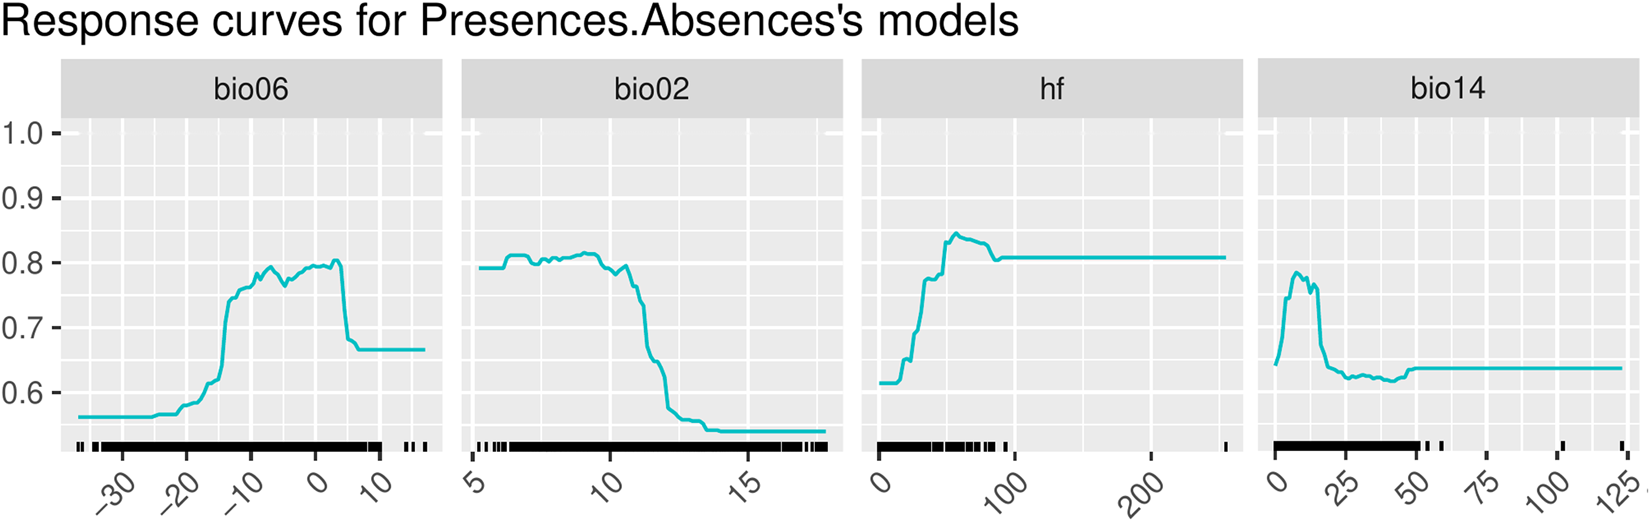
Based on the variable importance analysis, four environmental variables with relative importance >10% were identified as key predictors: Minimum Temperature of the Coldest Month (Bio6), Mean Diurnal Range (Bio2), Human Footprint (hf), and Precipitation of the Driest Month (Bio14). Together, these four variables accounted for more than 90% of the total relative importance. Their response curves (fig. 2) provide insights into how environmental gradients shape the potential distribution of P. aubei. Minimum Temperature of the Coldest Month (Bio6) emerged as the most influential factor, with habitat suitability rising sharply as temperatures increased from extremely cold conditions (−30°C to −20°C) to approximately −10°C, beyond which suitability plateaued. This pattern suggests that P. aubei requires relatively mild winter conditions for survival and reproduction. Mean Temperature of the Warmest Quarter (Bio10) also showed a strong positive effect, with the highest suitability between 15°C and 20°C, reflecting the beetle’s preference for temperate summer climates. Precipitation of the Driest Month (Bio14) displayed a unimodal response, peaking at 60–90 mm, indicating the species’ sensitivity to drought extremes. Topographic factors such as slope revealed broad tolerances, suggesting limited constraints on distribution. Anthropogenic influence was also evident: habitat suitability was highest under moderate Human Footprint values (25–30) but declined at higher intensities, while vegetation cover favoured intermediate to high levels (60–70%).
Response curves of key environmental variables for the ensemble model.

Predicted potential habitat suitability: Current and future projections
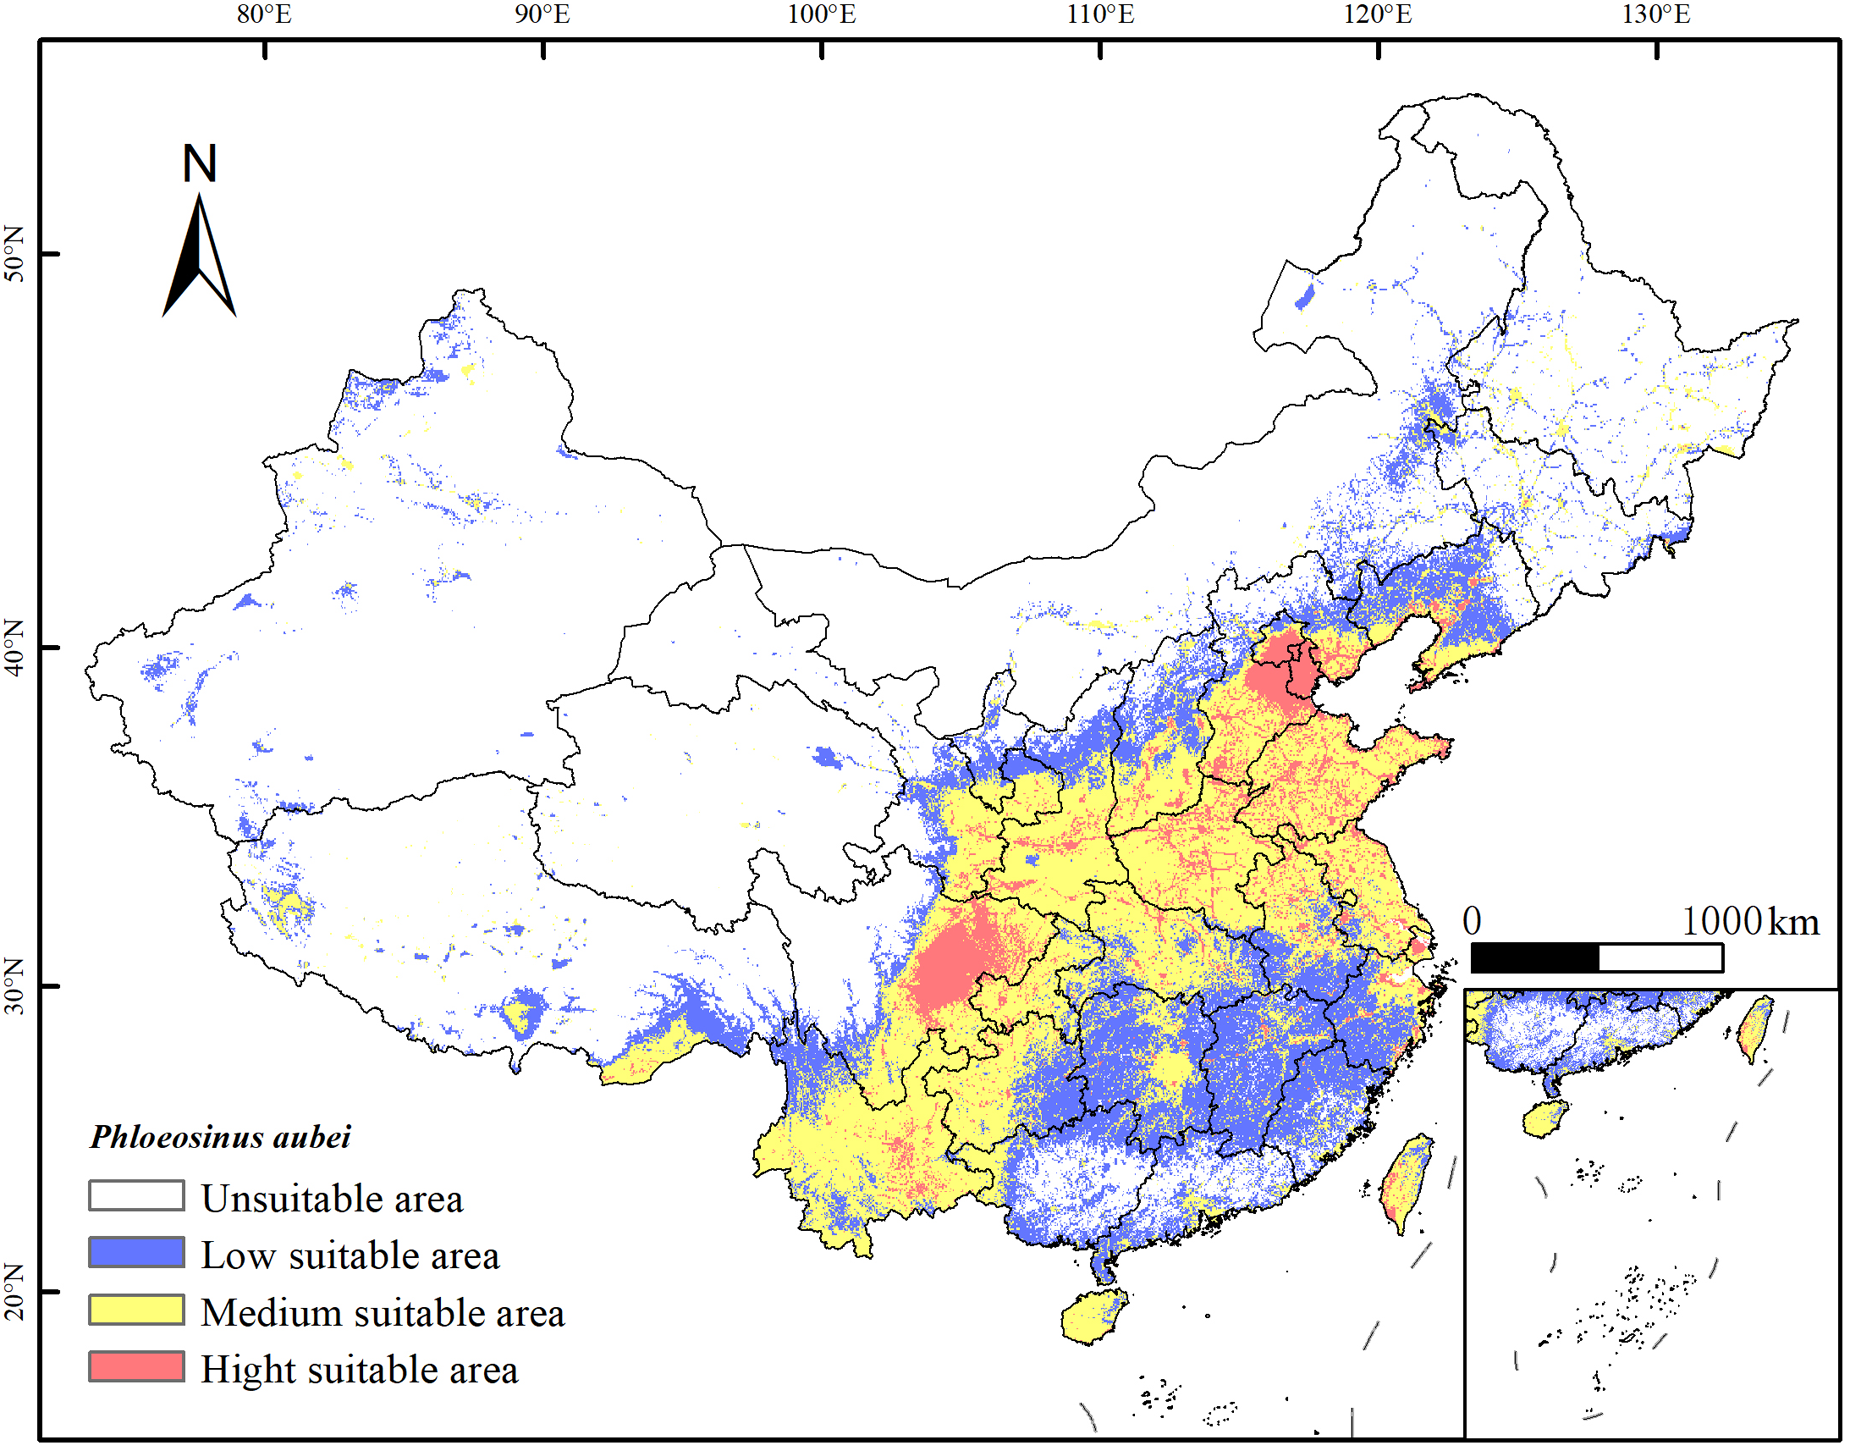
The ensemble model achieved robust predictive performance (AUC = 0.917, TSS = 0.813), providing a reliable basis for subsequent analyses. The results showed that current habitat suitability exhibited clear spatial patterns (fig. 3). Highly suitable areas are concentrated in central and eastern China, including the Sichuan Basin, Yangtze Plain, and several coastal provinces, which provide favourable temperature, precipitation, and host tree availability. Unsuitable regions include the Tibetan Plateau, northwestern deserts, and northeastern high-latitude areas, where extreme cold, low moisture, or limited host presence restrict colonisation. The binary presence–absence map further delineates areas where P. aubei is likely to establish, supporting risk assessment and forest management planning.
Predicted current potential habitat suitability for Phloeosinus aubei in China.

Figure 3 Long description
China habitat suitability for Phloeosinus aubei, divided into four categories: unsuitable, low suitable, medium suitable and high suitable areas. Unsuitable areas are marked in the northwestern deserts and northeastern high-latitude regions. Low suitable areas are scattered throughout various regions. Medium suitable areas are concentrated in central and eastern China, including the Sichuan Basin and Yangtze Plain. High suitable areas are highlighted in several coastal provinces. The map includes a scale bar indicating 1000 kilometers for reference. An inset map provides additional detail on the southeastern coastal regions.
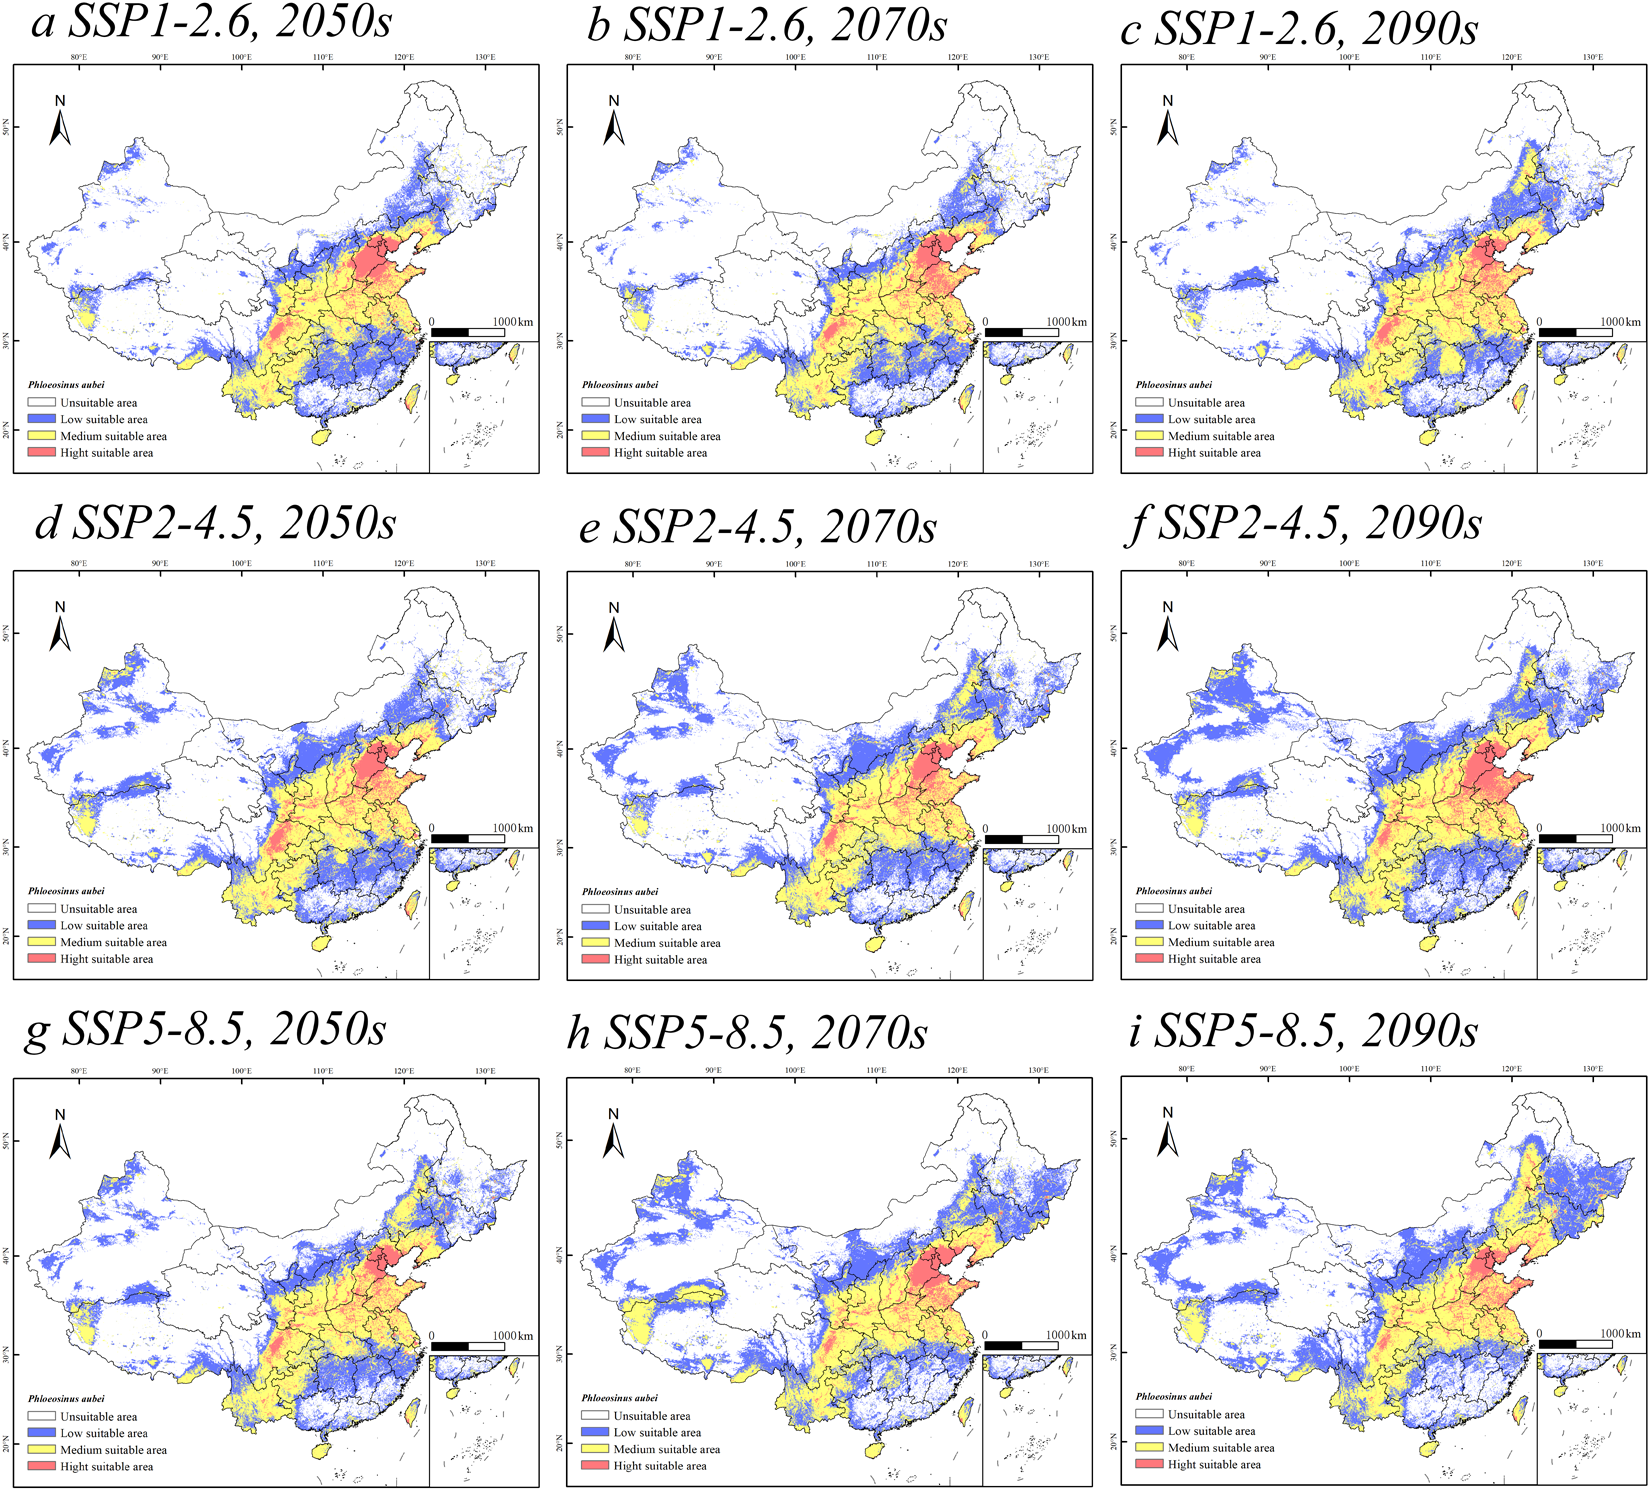
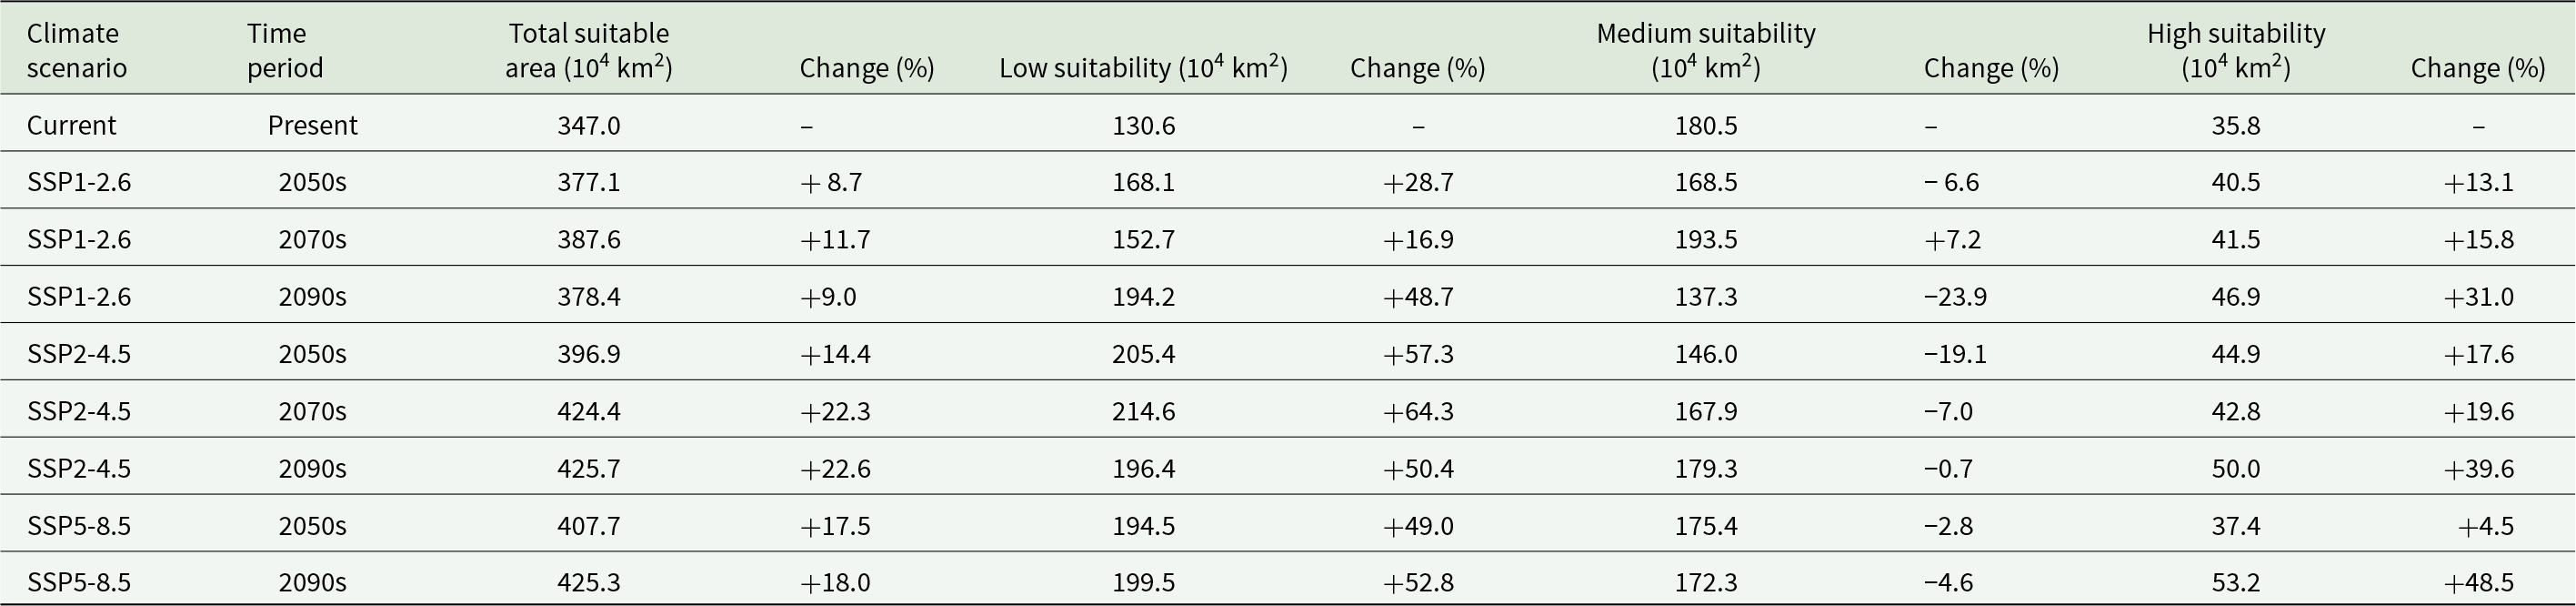
According to the ensemble model projections, P. aubei has substantial potential suitable habitat in China under current conditions, and this habitat is expected to expand under future climate scenarios. Under current conditions, approximately 36.1% of China’s land area was classified as suitable, with Medium suitability covering 180.5 × 10⁴ km2, Low suitability 130.6 × 10⁴ km2, and High suitability 35.8 × 10⁴ km2. Future projections indicate scenario-dependent changes (table 3; fig. 4). Under SSP1-2.6, suitable habitats expand slightly, reaching 378.4 × 10⁴ km2 by the 2090s, characterised by strong gains in Low suitability, a decrease in Medium suitability, and moderate increases in High suitability. Under SSP2-4.5, suitable areas expand more strongly to 425.7 × 10⁴ km2 by the 2090s, with the largest change in Low suitability, near stability in Medium suitability, and substantial increases in High suitability. Under SSP5-8.5, suitable habitats expand to 425.3 × 10⁴ km2 by the 2090s, with Low suitability increasing steadily, Medium suitability declining slightly, and High suitability rising strongly.
Predicted future potential habitat suitability for Phloeosinus aubei in China under SSP scenarios. Panels (a–c): SSP1-2.6 for the 2050s, 2070s, and 2090s; panels (d–f): SSP2-4.5; panels (g–i): SSP5-8.5.

Figure 4 Long description
Nine thematic maps illustrate predicted habitat suitability in China under SSP scenarios for the 2050s, 2070s and 2090s. Maps a-c represent SSP1-2.6, d-f represent SSP2-4.5 and g-i represent SSP5-8.5. Each map uses colors to indicate suitability levels: high, medium, low and unsuitable. High suitability areas are concentrated in regions like the North China Plain and Yangtze River basin. The maps show north at the top, with a north arrow and scale bar included. Over time, high suitability expands in SSP2-4.5 and SSP5-8.5, especially in eastern and southern provinces. SSP1-2.6 shows moderate changes. Geographic anchors include Northeast China and Sichuan Basin. The maps highlight shifts in habitat suitability across scenarios and decades, with varying degrees of expansion or contraction in suitable areas.
Area (104 km2) and percentage of suitable habitat for Phloeosinus aubei under current and future climatic scenarios

Table 3 Long description
Values are given for climate scenario and time period, reporting total suitable area in units of 10 to the fourth power square kilometers and percent change, plus low, medium, and high suitability areas with their percent changes. Current present totals are 347.0, with low 130.6, medium 180.5, and high 35.8, and no change values listed. Under SSP1 2.6, totals are 377.1 in the 2050s, 387.6 in the 2070s, and 378.4 in the 2090s; low is 168.1, 152.7, and 194.2; medium is 168.5, 193.5, and 137.3; high is 40.5, 41.5, and 46.9, with the listed percent changes shown in the same row. Under SSP2 4.5, totals are 396.9 in the 2050s, 424.4 in the 2070s, and 425.7 in the 2090s; low is 205.4, 214.6, and 196.4; medium is 146.0, 167.9, and 179.3; high is 44.9, 42.8, and 50.0, with percent changes listed for each value. Under SSP5 8.5, totals are 407.7 in the 2050s and 425.3 in the 2090s; low is 194.5 and 199.5; medium is 175.4 and 172.3; high is 37.4 and 53.2, with percent changes listed for each value.
Comparing emission scenarios within the same time period reveals consistent patterns: higher emission scenarios generally lead to greater expansion of suitable habitat, particularly for Low and High suitability classes. By the 2090s, the total suitable area under SSP2-4.5 and SSP5-8. are similar, but the distribution among suitability classes differs, with SSP5-8.5 showing greater High suitability and less Medium suitability decline.
Centroids of highly suitable habitats
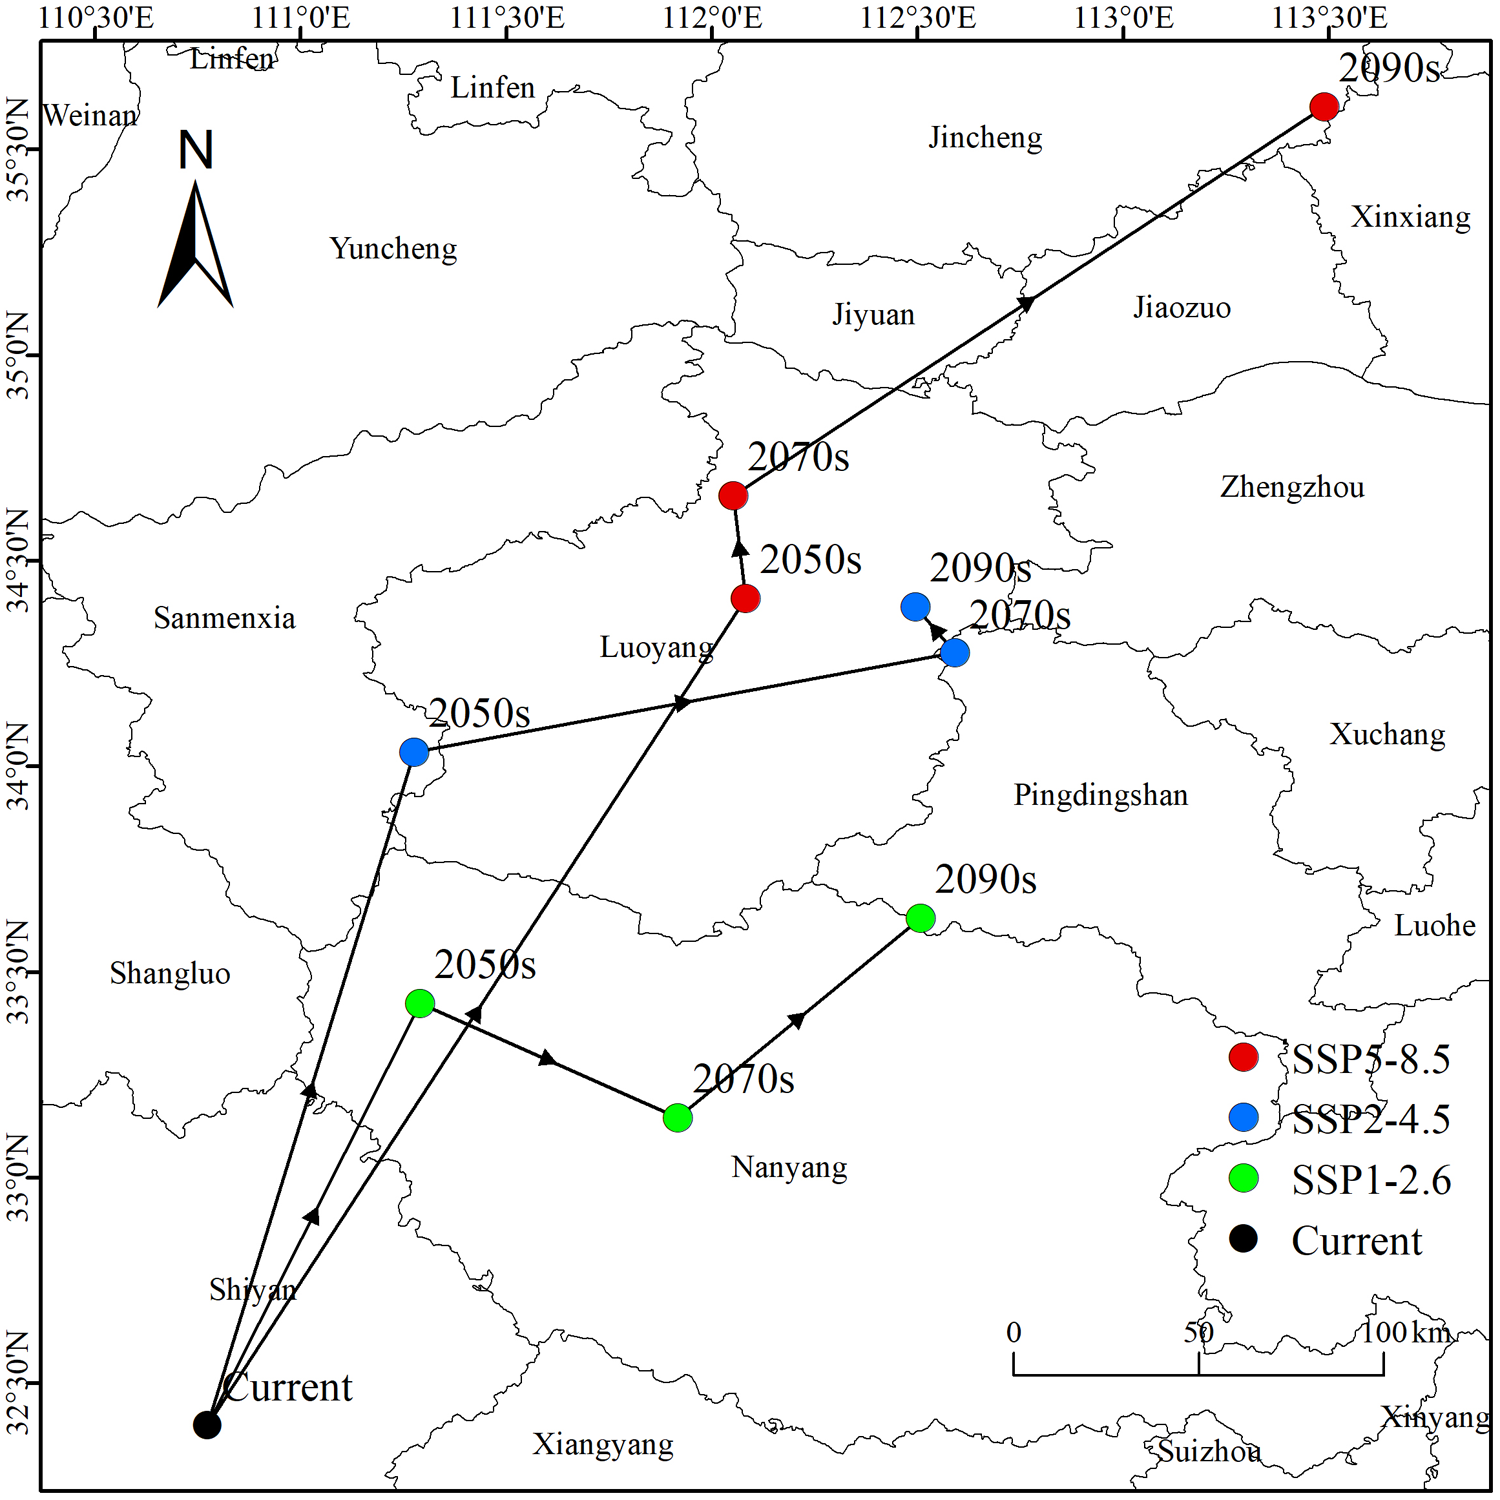
Based on the distribution of suitable areas, we analysed centroid shifts in highly suitable habitats. Under current conditions, the centroid was located at 110.77°E, 32.39°N, corresponding to Shiyan City, Hubei Province. Under future scenarios, the centroid showed scenario-dependent shifts. Under SSP1-2.6, the centroid first shifted northeastward to Nanyang by the 2050s, then shifted southeastward but remained in Nanyang by the 2070s, and finally shifted northeastward to Pingdingshan by the 2090s. Under SSP2-4.5, the centroid first shifted northeastward to Sanmenxia by the 2050s, then moved northeastward to Pingdingshan by the 2070s, and finally shifted slightly northwestward to Luoyang by the 2090s. Under SSP5-8.5, the centroid first shifted northeastward to Luoyang by the 2050s, then shifted slightly northwestward by the 2070s, and finally shifted northeastward to Jincheng by the 2090s.
Overall, the centroid of highly suitable habitat shifted northeastward under all three scenarios, and the displacement increased with emission intensity. By the 2090s, the total shift relative to the current centroid was approximately 270 km under SSP1-2.6, 290 km under SSP2-4.5, and 400 km under SSP5-8.5. These results indicate a consistent northeastward range dynamic for P. aubei under future climate change.
Discussion
Environmental drivers of P. aubei distribution
The ensemble model demonstrated robust predictive performance (AUC = 0.917, TSS = 0.813), indicating its strong ability to discriminate between suitable and unsuitable habitats for P. aubei across China (table 2). This high accuracy is consistent with the established benefits of ensemble modelling approaches, which are known to reduce uncertainty and improve predictive reliability compared to single-model outputs, especially for species with complex distributions or sparse data (Iossa, Reference Iossa2022; Lion et al., Reference Lion, Reis, de Brito and Cardoso2023).
Our results indicate that the minimum temperature of the coldest month (Bio6) was the most influential factor, accounting for approximately 45.61% of the model’s predictive power (fig. 1). This finding aligns with existing research on bark beetles, which consistently identifies winter temperature extremes as critical determinants of survival, development rates, and population dynamics (Holbech, Reference Holbech2020; Song et al., Reference Song, Saglam, Zuchero and Buch2024). The response curve for Bio6 demonstrated that habitat suitability increases as minimum winter temperatures rise from approximately −30°C to −10°C. This pattern suggests that warming winters, a consequence of ongoing climate change, may significantly enhance P. aubei survival and activity periods, potentially facilitating range expansion and elevating outbreak risks (Sparbanie and Snell, Reference Sparbanie and Snell2022). The physiological mechanism underlying this response relates to overwintering survival: bark beetles that experience less extreme cold temperatures during winter months have higher survival rates, leading to larger spring populations and increased infestation potential (Bentz et al., Reference Bentz, Régnière, Fettig, Hansen, Hayes, Hicke, Kelsey, Negrón and Seybold2010). The mean diurnal range (Bio2) was the second most important predictor, contributing 16.01% (fig. 1), indicating that daily temperature fluctuations also strongly influence beetle distribution (Lee et al., Reference Lee, Calvin, Dasgupta, Krinner, Mukherji, Thorne, Trisos, Romero, Aldunce and Barret2023). Thermal stability within a day affects insect activity, metabolic rates, and physiological stress. Our response curves suggest that P. aubei prefers environments with moderate diurnal ranges, where extreme fluctuations could impede normal behaviours or development. This is consistent with the species’ preference for stable climatic conditions typical of temperate regions.
A noteworthy finding was the substantial influence of human activity, represented by the Human Footprint (hf), which contributed 15.50% to habitat suitability (fig. 1). This suggests that anthropogenic landscapes play a significant role in shaping beetle distribution. Mechanisms may include the widespread planting of susceptible Cupressaceae in urban and peri-urban areas, urban heat island effects creating warmer microclimates that are favourable for overwinter survival, and human-mediated dispersal through the trade of infested plant material. The strong role of hf emphasises the complex interplay between natural environmental gradients and human-modified habitats, highlighting the importance of considering anthropogenic influences when predicting pest distributions (Branco et al., Reference Branco, Nunes, Roques, Fernandes, Orazio and Jactel2019; Chen et al., Reference Chen, Soulsbury, Lebigre, Ludwig, van Oers and Hoffman2023). Precipitation during the driest month (Bio14) contributed 13.14%, indicating that moisture availability even in dry periods is essential for P. aubei. The response curves showed optimum suitability around 60–90 mm, implying that while the species tolerates some dry conditions, a minimum moisture threshold is necessary, likely due to its influence on host tree health. Moisture stress can weaken Cupressaceae hosts, increasing susceptibility to beetle attacks, and may also directly affect beetle physiology and survival. This finding is consistent with studies showing that drought-stressed trees are more vulnerable to bark beetle infestation (Raffa et al., Reference Raffa, Aukema, Bentz, Carroll, Hicke, Turner and Romme2008). An intriguing observation was the strong positive correlation between elevation and temperature-related variables (Bio10, r = 0.86 in Figure S1), which deviates from the general expectation that temperature decreases with altitude. This may reflect regional climatic phenomena such as temperature inversions in valleys or basins, or the geographic distribution of occurrence records concentrated in warmer high-elevation areas in China (Parmesan and Yohe, Reference Parmesan and Yohe2003). For example, the Sichuan Basin and Yangtze River Valley experience unique microclimatic conditions where elevation does not strictly follow the typical lapse rate due to basin effects and monsoon influences. While this anomaly provides interesting ecological insights, it also underscores the limitations of broad-scale correlative models without finer-scale microclimatic data.
Implications for forest pest management under climate change
Under current climatic conditions, approximately 36.1% of China’s land area provides suitable habitat for P. aubei (fig. 3). Highly suitable regions are concentrated in the Yangtze River Basin, including Hubei, Anhui, and Jiangsu provinces, as well as central and eastern mountainous regions such as Sichuan, Chongqing, and Guizhou. Moderate suitability zones extend into Shandong, Henan, and southern Shaanxi. Our predictions are consistent with current outbreak records and known Cupressaceae distributions (Fung, Reference Fung1994; Holbech, Reference Holbech2020), with highly suitable regions aligning with areas of reported P. aubei damage. This spatial concordance provides independent validation of our model predictions. Detailed classification by suitability allows managers to allocate resources efficiently and optimise integrated pest management strategies.
Future projections indicate overall expansion and northeastward shifts in the potential habitat of P. aubei (figs. 4, 5). Although total suitable area was similar under SSP2-4.5 and SSP5-8.5 by the 2090s, SSP5-8.5 showed a greater expansion of high-suitability habitat, suggesting that emission intensity may affect habitat quality more than total area (Gao et al., Reference Gao, Xu, Liu, Zhao and Shi2021; Lee et al., Reference Lee, Calvin, Dasgupta, Krinner, Mukherji, Thorne, Trisos, Romero, Aldunce and Barret2023). The centroid of highly suitable habitat shifted northeastward under all scenarios, with a 350–500 km displacement under high emissions (fig. 5). This pattern is consistent with range shifts observed in other insect species under global warming (Parmesan and Yohe, Reference Parmesan and Yohe2003; Hickling et al., Reference Hickling, Roy, Hill and Thomas2005) and suggests that northern and eastern China may become increasingly vulnerable (Gao et al., Reference Gao, Xu, Liu, Zhao and Shi2021; Wu et al., Reference Wu, Xu, Peng and Zhuo2024; Ahmad et al., Reference Ahmad, Xu, Deng, He, Ali and Zhuo2025). These findings highlight the need to incorporate future range dynamics into monitoring and forest management planning (Elith and Leathwick, Reference Elith and Leathwick2009; Zhang et al., Reference Zhang, Wu and Liang2024; Xu et al., Reference Xu, Luo, Peterson, Zhao, Yu, Ye, Sun, Yan and Wang2025). These projected changes highlight the need for adaptive management that anticipates new invasion fronts while maintaining control in historically affected areas (Lee et al., Reference Lee, Calvin, Dasgupta, Krinner, Mukherji, Thorne, Trisos, Romero, Aldunce and Barret2023). Monitoring should prioritise high-suitability regions with extensive Cupressaceae plantations, and early-warning systems should incorporate winter temperature anomalies (Bio6) as a key risk predictor (Bentz et al., Reference Bentz, Régnière, Fettig, Hansen, Hayes, Hicke, Kelsey, Negrón and Seybold2010; Ahmad et al., Reference Ahmad, Xu, Deng, He, Ali and Zhuo2025). Given the projected northeastward range shift, regional coordination will also be important for effective monitoring and control (Xu et al., Reference Xu, Luo, Peterson, Zhao, Yu, Ye, Sun, Yan and Wang2025).
Centroids of highly suitable habitats.

Figure 5 Long description
Projected habitat shifts in China under different scenarios: SSP5-8.5, SSP2-4.5, SSP1-2.6 and current conditions. Locations are marked with colored dots: red for SSP5-8.5, blue for SSP2-4.5, green for SSP1-2.6 and black for current. The map includes cities such as Beijing, Luoyang, Zhengzhou and Xinyang. Arrows indicate the direction of habitat shifts from current to future projections in the 2050s, 2070s and 2090s. The map is oriented with a north arrow and includes latitude and longitude markers. A scale bar is present at the bottom right corner, indicating distances in kilometers.
Limitations and future research directions
While this study provides comprehensive insights, several limitations warrant consideration. First, SDMs are correlative and do not establish causation. Experimental or mechanistic studies are needed to confirm the drivers of observed patterns, particularly the effects of human footprint and microclimatic variability (Chen et al., Reference Chen, Soulsbury, Lebigre, Ludwig, van Oers and Hoffman2023). Second, our models primarily incorporate abiotic factors and do not explicitly account for biotic interactions, such as competition, predation, or host tree availability (Parmesan and Yohe, Reference Parmesan and Yohe2003). As a result, realised distributions may be more restricted than potential distributions predicted here. Future research should integrate detailed host tree distribution maps, competitor or predator presence, and host health status to refine predictions. Third, inherent uncertainties exist in future climate projections. While we used the IPSL-CM6A-LR GCM, different GCMs within the CMIP6 framework may produce varying outcomes. Future studies should integrate multiple GCMs to better capture future climate variability and uncertainty (Hickling et al., Reference Hickling, Roy, Hill and Thomas2005; Kearney and Porter, Reference Kearney and Porter2009). Additionally, pseudo-absence generation methods and model evaluation metrics can influence results, though we applied widely accepted strategies (random pseudo-absences, TSS-weighted ensembles) to enhance robustness (Barbet-Massin et al., Reference Barbet-Massin, Jiguet, Albert and Thuiller2012). Fourth, the exceptionally high performance of RF (AUC = 1.000; TSS = 1.000) and XGBoost (AUC = 0.999; TSS = 0.970) may indicate some degree of model overfitting. Although we employed repeated cross-validation and spatial thinning to improve robustness, caution is warranted when interpreting these individual algorithm results. The ensemble approach, which combines multiple models and weights them by TSS scores, provides a more conservative estimate of habitat suitability and reduces the risk of overfitting (Araújo and New, Reference Araújo and New2007; Thuiller et al., Reference Thuiller, Lafourcade, Engler and Araújo2009). Future studies should evaluate model transferability using independent occurrence datasets and spatial block cross-validation approaches. Fifth, the spatial resolution of 2.5 arc-minutes (∼5 km) may not capture fine-scale microhabitat features critical for P. aubei establishment. High-resolution environmental data and spatially explicit dispersal models would improve fine-scale predictions, which are critical for localised pest management (Franklin et al., Reference Franklin, Serra-Diaz, Syphard and Regan2016). Finally, investigating genetic diversity and adaptive capacity could reveal how P. aubei populations might respond to ongoing environmental changes, influencing their potential for long-term expansion (Aitken and Whitlock, Reference Aitken and Whitlock2013; Chen et al., Reference Chen, Soulsbury, Lebigre, Ludwig, van Oers and Hoffman2023).
These projected changes highlight the urgent need for adaptive management strategies that anticipate new invasion fronts while maintaining control in historically affected areas. The movement of centroids, ranging from 350–500 km northeast under high-emission scenarios, underscores the importance of monitoring emerging high-risk areas. Integrating these projections with forest management strategies can help prioritise early-warning systems, pest control efforts, and the allocation of resources to regions most likely to experience future colonisation.
Conclusions
This study applied the BIOMOD2 ensemble modelling framework to predict the potential habitat suitability of P. aubei across China under current and future climate scenarios. Winter temperature (Bio6) was identified as the dominant environmental determinant of its distribution, followed by mean diurnal range (Bio2) and human footprint (hf), highlighting the importance of temperature extremes, thermal stability, and anthropogenic influence in shaping its ecological niche. Under current conditions, approximately 36.1% of China’s land area provides suitable habitat, with highly suitable areas concentrated in central and eastern China, particularly the Yangtze River Basin and the Sichuan Basin. Suitable habitat is projected to expand under all future scenarios, and the centroids of highly suitable areas are expected to shift northeastward, indicating climate-driven range expansion into previously less suitable regions. These findings have critical implications for forest pest management, emphasising the need for proactive and adaptive strategies. Targeted monitoring and early-warning systems should be prioritised in northern and eastern China, where vulnerability to P. aubei establishment is projected to increase. Forest management plans should also incorporate climate-resilient approaches, such as promoting host tree diversity and adjusting planting strategies in response to shifting pest pressure. Overall, this study provides a foundational understanding for developing sustainable forest management practices and protecting valuable Cupressaceae forests across China under ongoing climate change.
Supplementary material
The supplementary material for this article can be found at https://doi.org/10.1017/S0007485326101461.
Author contributions
Conceptualisation, D.X.; methodology, Z.Z. and Q.J.; software, H.Z. and Z.H.; validation, H.A., Q.J. and H.Z.; formal analysis, S.A., H.A., Q.J. and H.Z.; investigation, D.X., Z.Z. and H.A.; resources, D.X.; data curation, X.D., H.A. and Z.H.; writing – original draft preparation, S.A.; writing – review and editing, D.X., S.A., H.A., Q.J. and H.Z.; visualisation, H.Z. and Z.H.; supervision, D.X. and Z.Z.; project administration, D.X.; funding acquisition, D.X. All authors have read and agreed to the published version of the manuscript.
Data Availability Statement
The original contributions presented in this study are included in the article. Data are available at: https://doi.org/10.6084/m9.figshare.32906636. Further inquiries can be directed to the corresponding authors.
Financial support
This work was funded by the Central Financial Forestry and Grassland Science and Technology Promotion and Demonstration Project (Promotion and Demonstration Project of Key Technologies for the Construction of the Tianfu Forest Carbon Pool—Demonstration of Integrated Prevention and Control of Phloeosinus aubei, No. Chuan[2025]TG67) and the Sichuan Provincial Department of Science and Technology (No. 2026JDKP0121).
Competing interests
The authors declare no conflicts of interest.