





1. Introduction
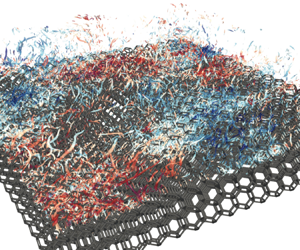
Turbulent flows over permeable porous walls have attracted considerable scientific and engineering interest because of the considerably enhanced momentum, heat and mass transfer across the porous/fluid interface. In engineering applications, porous media are encountered in the gas diffusion layers of proton-exchange membrane fuel cells, catalytic converters for automobile exhaust systems, transpiration cooling systems, and heat exchangers. In the context of the geophysical and environmental fields, flows over vegetation and urban canopies (Finnigan Reference Finnigan2000; Nepf & Ghisalberti Reference Nepf and Ghisalberti2008), and natural river beds (Detert, Nikora & Jirka Reference Detert, Nikora and Jirka2010), are affected by roughness and permeability.
One of the most notable characteristics of turbulent flows over permeable porous walls that distinguishes the permeable wall turbulence from the rough wall turbulence is the presence of spanwise roller vortices associated with the Kelvin–Helmholtz (K–H) instability. It has been reported that spanwise roller vortices can develop over various walls, such as foam media (Suga et al. Reference Suga, Matsumura, Ashitaka, Tominaga and Kaneda2010), cube arrays (Breugem & Boersma Reference Breugem and Boersma2005; Kuwata & Suga Reference Kuwata and Suga2016b), longitudinal ribs (Garcia-Mayoral & Jiménez Reference Garcia-Mayoral and Jiménez2012; Kuwata Reference Kuwata2022a), vegetation canopies (Finnigan Reference Finnigan2000; White & Nepf Reference White and Nepf2007), and packed beds (Guan et al. Reference Guan, Salinas, Zgheib and Balachandar2021), as well as rough walls (Stoesser et al. Reference Stoesser, Braun, Garcia-Villalba and Rodi2008; García-Mayoral & Jiménez Reference García-Mayoral and Jiménez2011; Endrikat et al. Reference Endrikat, Modesti, García-Mayoral, Hutchins and Chung2021), vegetation canopies (Finnigan Reference Finnigan2000; White & Nepf Reference White and Nepf2007), and elastic walls (Rosti & Brandt Reference Rosti and Brandt2017; Jha & Steinberg Reference Jha and Steinberg2021). In contrast with the quasi-streamwise vortices in the near-wall turbulence, spanwise rollers accompany relatively large-scale sweep and ejection motions, leading to a significantly enhanced momentum transfer (Breugem, Boersma & Uittenbogaard Reference Breugem, Boersma and Uittenbogaard2006; Kuwata & Suga Reference Kuwata and Suga2016b) and heat transfer (Nishiyama, Kuwata & Suga Reference Nishiyama, Kuwata and Suga2020) across the porous/fluid interface. In addition, because the characteristic length scale for spanwise rollers is comparable to the boundary layer thickness (Kuwata & Suga Reference Kuwata and Suga2017; Suga et al. Reference Suga, Okazaki, Ho and Kuwata2018) or shear length scale (Finnigan Reference Finnigan2000; White & Nepf Reference White and Nepf2007), the effect of spanwise rollers has not been confined to the vicinity of the porous/fluid interface but extends into the logarithmic region or beyond the boundary layer (Kuwata & Suga Reference Kuwata and Suga2019), which results in a modification of the von Kármán constant (Poggi et al. Reference Poggi, Porporato, Ridolfi, Albertson and Katul2004; Kuwata Reference Kuwata2022b).
To approximate the mean velocity profiles over permeable porous walls, customarily the modified logarithmic law (log law) is used:
 \begin{equation} U^{p+}=\frac{1}{\kappa} \ln \left(\frac{y +d_p}{h_r}\right), \end{equation}
where  $\kappa$,
 $d_p$ and
 $h_r$ are the von Kármán constant, the zero-plane displacement and the equivalent roughness height, respectively. The streamwise mean velocity
 $U$ with a superscript ‘
 $p+$’ stands for the mean velocity normalized by the friction velocity at the porous/fluid interface. Because the von Kármán constant
 $\kappa$ does not necessarily coincide with the standard value for smooth-wall turbulence, three unknown log-law parameters,
 $\kappa$,
 $d_p$, and
 $h_r$, must be determined to approximate the mean velocity profiles. With respect to
 $d_p$ and
 $h_r$, the direct numerical simulations (DNS) studies by Kuwata & Suga (Reference Kuwata and Suga2017) reported a close correlation between
 $d_p$ and
 $h_r$, regardless of the Reynolds number. An experimental study of a turbulent boundary layer over a highly permeable metal foam by Esteban et al. (Reference Esteban, Rodríguez-López, Ferreira and Ganapathisubramani2022) showed that
 $d_p$ and
 $h_r$ are related closely to the pore size, whereas experiments on foam media in Suga et al. (Reference Suga, Matsumura, Ashitaka, Tominaga and Kaneda2010) and Manes, Poggi & Ridol (Reference Manes, Poggi and Ridol2011) showed that
 $d_p$ and
 $h_r$ are expressed as functions of the square root of permeability
 $\sqrt {K}$. Here, the permeability
 $K$ for isotropic porous media is defined in low Reynolds number fully developed porous medium flows, that is, Darcy flow (Whitaker Reference Whitaker1986):
 \begin{equation} -\frac{1}{\rho}\,\frac{\partial P}{\partial x} = \nu K^{{-}1} U_d, \end{equation}
where  $\nu$ and
 $P$ are the kinematic viscosity and pressure, respectively. Darcian velocity
 $U_d$ is defined as the superficially averaged velocity over a representative elementary volume. The parametrization of
 $d_p$ and
 $h_r$ was extended to anisotropic porous media by introducing a pore length scale at the porous/fluid interface (Suga et al. Reference Suga, Okazaki, Ho and Kuwata2018). Therefore, there is consensus that the flow properties of
 $d_p$ and
 $h_r$ are related to the physical length scales of porous media. However, the value of the von Kármán constant is controversial. Esteban et al. (Reference Esteban, Rodríguez-López, Ferreira and Ganapathisubramani2022) showed that the standard value for smooth-wall turbulence can be used straightforwardly for turbulent boundary layers over metal foams. This concept is common in vegetation canopies (Nepf & Ghisalberti Reference Nepf and Ghisalberti2008). In contrast, DNS (Breugem et al. Reference Breugem, Boersma and Uittenbogaard2006; Kuwata & Suga Reference Kuwata and Suga2016b; Chu et al. Reference Chu, Wang, Yang, Terzis, Helmig and Weigand2021) and experimental studies (Suga et al. Reference Suga, Matsumura, Ashitaka, Tominaga and Kaneda2010, Reference Suga, Okazaki, Ho and Kuwata2018; Manes et al. Reference Manes, Poggi and Ridol2011) have determined
 $\kappa$ by collapsing the
 $U^{p+}$ profiles into the modified log law of (1.1) and suggested a considerably smaller
 $\kappa$ value than the standard value for smooth-wall turbulence. However, considering that the Reynolds numbers in most of these studies were not sufficiently high to guarantee the logarithmic mean velocity profiles, the direct fit of the
 $U^{p+}$ profiles to the log law may be problematic. To avoid this problem, Kuwata (Reference Kuwata2022b) employed a different method for determining
 $\kappa$,
 $d_p$ and
 $h_r$ based on the Jackson model (Jackson Reference Jackson1981) where
 $d_p$ is defined as the level at which the mean drag by the permeable walls acts. Kuwata (Reference Kuwata2022b) reported that the von Kármán constant becomes larger than the smooth-wall value owing to an increase in the mixing length by spanwise rollers.
Because the skin friction coefficient  $C^p_f$ at the porous/fluid interface is related directly to the
 $U^{p+}$ profile, exploring the scaling of
 $C^p_f$ as an alternative to logarithmic mean velocity profiles is crucial. Earlier studies were conducted on relatively dense porous media, such as packed beads (Ho & Gelhar Reference Ho and Gelhar1973) and sand beds (Lovera & Kennedy Reference Lovera and Kennedy1969). They showed that
 $C^p_f$ increases with the Reynolds number, even within the fully rough regime, where the friction factor is normally independent of the Reynolds number. However, this is not true for highly permeable porous media (Suga et al. Reference Suga, Matsumura, Ashitaka, Tominaga and Kaneda2010; Esteban et al. Reference Esteban, Rodríguez-López, Ferreira and Ganapathisubramani2022). Esteban et al. (Reference Esteban, Rodríguez-López, Ferreira and Ganapathisubramani2022) systematically measured turbulent boundary layers over metal foam with varying pore sizes and permeabilities across a broad range of friction Reynolds numbers, from
 $Re_\tau \simeq 2000$ to
 $Re_\tau \simeq 18\,000$. They found that
 $C^p_f$ depends on the characteristics of the porous substrates and reaches a plateau beyond
 $Re_\tau \simeq 5000$. A similar observation was reported in a recent DNS study using modified wall boundary conditions (Motoki et al. Reference Motoki, Tsugawa, Shimizu and Kawahara2022), where the wall-normal transpiration velocity is assumed to be proportional to the local pressure fluctuation, as reported by Jiménez et al. (Reference Jiménez, Uhlmann, Pinelli and Kawahara2001). They reported that
 $C^p_f$ takes a constant value in the sufficiently high Reynolds number regime, where spanwise rollers with large-scale wall blowing and suction dominate the boundary layer.
Despite extensive research conducted over the last several decades, there is a lack of consensus regarding the scaling of the mean velocity profiles over permeable walls. In particular, the value of the von Kármán constant is controversial, which may be affected by spanwise roller vortices associated with the K–H instability. The objective of this study was to unveil the Reynolds number dependence on the emergence of the K–H instability, and the consequent effects on the mean flow characteristics over permeable walls. Particular attention was paid to the effects of spanwise rollers, which do not develop for low-permeability Reynolds number  $Re_K=\sqrt {K} u_\tau /\nu$ flows but dominate turbulence for high
 $Re_K$ flows (Breugem et al. Reference Breugem, Boersma and Uittenbogaard2006; Kuwata & Suga Reference Kuwata and Suga2019). Hence we considered the turbulence over high-porosity porous media over a wide range of Reynolds number, leading to
 $Re_K\simeq 7\unicode{x2013}50$, which covers low to considerably higher
 $Re_K$ flows than in previous DNS studies (Breugem et al. Reference Breugem, Boersma and Uittenbogaard2006; Chu et al. Reference Chu, Wang, Yang, Terzis, Helmig and Weigand2021; Kuwata Reference Kuwata2022b). An in-depth discussion on the role of spanwise rollers was conducted by performing DNS for thick and thin porous walls, where effectively the thin porous wall attenuates the velocity fluctuations associated with the K–H instability (Kuwata & Suga Reference Kuwata and Suga2016b).
2. The DNS methodology
2.1. Flow conditions and computational details
Following the DNS study by Kuwata (Reference Kuwata2022b), we considered fully developed turbulent flows through a channel partially filled with arrays of Kelvin cells (polyhedra with six square and eight hexagonal faces Thomson Reference Thomson1887). Although we adopted the same computational method as that used by Kuwata (Reference Kuwata2022b), we explain it briefly for comprehensiveness (a full description of the numerical methodology is provided in the study performed by Kuwata Reference Kuwata2022b). The sketch depicting the flow configuration is shown in figure 1, where  $H$ and
 $h$ denote the channel and porous wall heights, respectively. The top and bottom walls were impermeable smooth walls, and we considered arrays of Kelvin cells in
 $-h< y<0$ as shown in figure 2(a) to mimic highly permeable foam media. The choice of asymmetric wall boundary conditions is consistent with those reported by DNS studies (Jiménez et al. Reference Jiménez, Uhlmann, Pinelli and Kawahara2001; Breugem et al. Reference Breugem, Boersma and Uittenbogaard2006; Kuwata & Suga Reference Kuwata and Suga2016b; Chu et al. Reference Chu, Wang, Yang, Terzis, Helmig and Weigand2021), and may yield results comparable to those of boundary layer flow experiments for porous walls (Suga et al. Reference Suga, Matsumura, Ashitaka, Tominaga and Kaneda2010; Manes et al. Reference Manes, Poggi and Ridol2011) and vegetation canopies (Finnigan Reference Finnigan2000; Nepf & Ghisalberti Reference Nepf and Ghisalberti2008). We did not select a channel with two parallel porous walls to avoid interactions between spanwise rollers originating from the two parallel walls because the effect of spanwise rollers over permeable walls usually extends beyond the boundary layer (Kuwata & Suga Reference Kuwata and Suga2019).
Computational geometry of the porous-walled channel flows: (a) thick-walled case ( $h=H$) and (b) thin-walled case (
 $h=H/3$). The porous wall consists of Kelvin cell arrays with porosity
 $0.95$, and the top and bottom walls are impermeable smooth walls. Note that a double spanwise domain length
 $L_z=6H$ is considered for cases 626-thick and 955-thick.

(a) Geometry of a single unit of a Kelvin cell with porosity  $0.95$. (b) Typical
 $x$–
 $y$ plane velocity vectors and grid around a ligament at
 $z=L/4$ for case 141-thick. Here,
 $L$ denotes the size of the Kelvin cell, and
 $d$ is the diameter of the circular ligament of the Kelvin cell. The velocity vectors are reduced by skipping every two points in the
 $x$ direction.

The porosity of the porous wall was  $\varphi =0.95$, and the size of a single unit of the Kelvin cell was set to
 $L=H/3$, which yielded permeability
 $K/H^2=1.9\times 10^{-3}$. Here, porosity is the volume fraction of the fluid phase over the representative elementary volume, while permeability is a flow parameter that quantifies easiness of flow through porous media. In this study, porosity is defined as the volume fraction of the fluid phase within a single unit of the Kelvin cell, and the permeability is computed by a relation between pressure drop and Darcian velocity in low Reynolds number fully developed porous medium flows using (1.2).
The flow was periodic in the streamwise ( $x$) and spanwise (
 $z$) directions. Simulations were run by imposing a mean streamwise pressure difference. The mean pressure difference was varied such that the friction Reynolds numbers based on the average friction velocity
 $u_\tau$ and channel height
 $H$ were varied:
 $Re_\tau =141$, 331, 626 and
 $955$ (the definition of
 $u_\tau$ is given in § 2.2.)
To examine the effects of spanwise rollers, we considered thick ( $h=H$) and thin (
 $h=H/3$) porous walls, as shown in figure 1. A precursor study by Kuwata (Reference Kuwata2022b) confirmed that for the present porous media, spanwise rollers are attenuated for the thin porous wall with
 $h=H/3$, because the smooth wall beneath the thin porous substrate attenuates the vertical transpiration velocity at the porous/fluid interface. Therefore, eight simulation cases with different friction Reynolds numbers and wall thicknesses were considered. In the following, for the sake of brevity, cases were named as follows: ‘A-B’, where ‘A’ denotes the friction Reynolds number, and ‘B’ is either ‘thin’ (
 $h=H/3$) or ‘thick’ (
 $h=H$). The size of the computational domain of
 $L_x(x)\times (H+h) (y)\times L_z(z)$ was
 $L_x=6H$ and
 $L_z=3H$, except for cases 626-thick and 955-thick, where we considered double the spanwise domain length,
 $L_z=6H$, to accommodate large-scale spanwise rollers. The size of the domain is comparable to or larger than that used in previous DNS studies on porous-walled channel flows (Jiménez et al. Reference Jiménez, Uhlmann, Pinelli and Kawahara2001; Breugem et al. Reference Breugem, Boersma and Uittenbogaard2006; Chandesris et al. Reference Chandesris, D'Hueppe, Mathieu, Jamet and Goyeau2013) and was confirmed to be sufficient to accommodate spanwise rollers associated with the K–H instability.
For the numerical method, following previous studies (Kuwata Reference Kuwata2022b), we utilized the three-dimensional 27-velocity multiple-relaxation-time lattice Boltzmann method (Suga et al. Reference Suga, Kuwata, Takashima and Chikasue2015) with the imbalance-correction local grid refinement technique proposed by Kuwata & Suga (Reference Kuwata and Suga2016a). The numerical method was validated against canonical turbulent flows (Suga et al. Reference Suga, Kuwata, Takashima and Chikasue2015), and we confirmed that the results were in good agreement with the experimental data for turbulent flows over porous walls (Kuwata & Suga Reference Kuwata and Suga2017; Kuwata, Tsuda & Suga Reference Kuwata, Tsuda and Suga2020). Based on the recommendations for wall-bounded flows of Suga et al. (Reference Suga, Kuwata, Takashima and Chikasue2015), the grid resolution of the equidistant regular grid near the porous wall was determined such that the grid spacing was approximately  $\varDelta ^{p+} < 2.5$, where
 $\varDelta ^{p+}$ denotes the grid spacing of the fine grid block normalized with the friction velocity at the porous/fluid interface
 $u_\tau ^p$ (the definition of
 $u_\tau ^p$ is provided in § 2.2). This resolution constraint was confirmed as valid for the present flow geometry (Kuwata Reference Kuwata2022b). In addition, to ensure the grid independence of the solutions, a grid sensitivity test was performed for case 955-thick. A comparison of a coarser mesh with
 $\varDelta ^{p+}= 2.9$ and a finer mesh with
 $\varDelta ^{p+}= 2.1$ yielded a change in the skin friction coefficient of approximately
 $2.6\,\%$, confirming that the current resolution with
 $\varDelta ^{p+}=2.4$ is sufficiently fine to obtain grid-independent solutions. In addition, the following constraint was imposed: a cross-section of a circular ligament of the Kelvin cell must be resolved using at least
 $8\times 8$ grids to accurately resolve the geometry of the Kelvin cells. Figure 2(b) depicts typical
 $x$–
 $y$ plane velocity vectors around a ligament for this resolution (case 141-thick), showing that the flow around a ligament appears to be simulated reasonably. We confirmed that this resolution was sufficient to reproduce correctly the hydraulic characteristics of the flow through a Kelvin cell with
 $\varphi =0.95$ at
 $Re_d<25$; doubling the number of grid points in each direction yields changes in the permeability and Forchheimer coefficient of approximately 2 % and
 $5\,\%$, respectively. Here,
 $Re_d$ is the Reynolds number based on the Darcian velocity
 $U_d$ and ligament diameter
 $d$.
The parameters of the simulations regarding the grid are presented in table 1. Notably, we allocated the twice-coarser grids away from the porous wall using a grid-refinement technique (Kuwata & Suga Reference Kuwata and Suga2016a) to circumvent prohibitively high computing resources for handling the entire computational domain with a single-grid resolution. The interface between the fine and coarse grid blocks was located  $100\varDelta ^{p+}$ off the porous wall at
 $Re_\tau =331$,
 $626$ and
 $955$, while the interface was located at
 $y=0.27H$ for the lowest
 $Re_\tau$ cases.
Parameters of the simulations. We considered eight simulations with different friction Reynolds numbers  $Re_\tau$ and wall thickness
 $h/H$. Here,
 $\varDelta ^{p+}$ is the grid spacing for the fine grid block normalized with
 $u_\tau ^p$,
 $d$ denotes the diameter of the circular ligament of the Kelvin cell, and
 $L/\varDelta$ denotes the number of grid points for resolving a single Kelvin cell unit in each direction.

2.2. Flow characteristic parameters
For a porous-walled channel flow where the flow is bounded by a bottom porous wall and top smooth wall, two friction velocities can be defined: the friction velocity at the porous/fluid interface  $u_\tau ^p$, and that at the smooth wall
 $u_\tau ^s$. For the top smooth wall, we can directly compute the shear stress at the wall
 $\tau ^s_w$, and the friction velocity is given by
 $u_\tau ^s=\sqrt {\tau ^s_w/\rho }$. The shear stress at the porous/fluid interface is obtained from the streamwise momentum balance between the pressure drop
 ${\rm \Delta} P$ and
 $\tau ^p_w=\rho (u_\tau ^p)^2$ as in Kuwata & Suga (Reference Kuwata and Suga2016b):
 \begin{equation} L_xL_z(\tau_w^p + \tau_w^s) = HL_z\,{\rm \Delta} P. \end{equation}
This yields
 \begin{equation} \tau_w^p = H\,\frac{{\rm \Delta} P}{L_x} - \tau_w^s. \end{equation}
Notably,  $\tau _w^s$ denotes viscous shear stress at the top wall, while
 $\tau _w^p$ corresponds to the total shear stress at the porous/fluid interface, including the viscous, turbulent and dispersion stresses. The definition of
 $\tau _w^p$ is comparable to those used in previous experiments (Manes et al. Reference Manes, Pokrajac, McEwan and Nikora2009; Suga et al. Reference Suga, Matsumura, Ashitaka, Tominaga and Kaneda2010). The average wall shear stress
 $u_\tau =\sqrt {\tau _w/\rho }$ is given by the average wall shear stress
 $\tau _w=(\tau _w^p + \tau _w^s)/2$, which is related to the streamwise pressure difference:
 \begin{equation} \tau_w = \frac{H}{2}\,\frac{{\rm \Delta} P}{L_x}. \end{equation}
Hence, simulations with the same friction Reynolds number have the same pressure difference. Note that because the wall thickness does not alter  $\tau _w^s$ significantly at the top wall, simulations with the same
 $Re_\tau$ prescribe almost the same
 $\tau _w^p$ at the porous/fluid interface (a maximum difference in the viscous wall unit of approximately 5 %). In the following, we discuss the non-dimensionalized values with the average friction velocity
 $u_\tau$, friction velocity at the porous/fluid interface
 $u_\tau ^p$, and friction velocity at the smooth wall
 $u_\tau ^s$, which are denoted by values with superscripts ‘
 $+$’, ‘
 $p+$’ and ‘
 $s+$’, respectively. We chose normalization with
 $u_\tau$ to discuss the turbulence modification at a given pressure difference, and consider the values non-dimensionalized with
 $u_\tau ^p$ and
 $u_\tau ^s$ in discussing the scaling of the turbulence statistics for the porous and smooth-wall sides, respectively. The difference between the top and bottom walls results in an asymmetry in the mean velocity profile in the clear flow region of
 $0< y< H$. The boundary layer thickness for the porous wall side is defined as the distance from the porous/fluid interface to the location where the total shear stress becomes zero (Breugem et al. Reference Breugem, Boersma and Uittenbogaard2006). Given that the total shear stress profile in the clear flow region is linear with respect to
 $y$, the boundary layer thickness for the porous wall side
 $\delta _p$ is given as
 \begin{equation} \delta_p=\frac{\tau_w^p}{\tau_w^s+\tau_w^p}\,H. \end{equation}
2.3. Averaging procedure
For a fully developed turbulent channel flow bounded by a smooth wall, the turbulence statistics vary one-dimensionally along the wall-normal direction. However, this is not the case for the porous wall because the wall geometry is inhomogeneous in the streamwise and spanwise directions. Hence, following the previous DNS studies (Kuwata Reference Kuwata2022b), we introduce the spatial averaging of variable  $\phi$ in the
 $x$–
 $z$ plane as
 \begin{equation} {\langle \phi \rangle}(y,t) = \frac{1}{A}\int_{x_f} \int_{z_f} \phi(x,y,z,t)\,{\rm d}\kern0.7pt x\,{\rm d} z, \end{equation}
where  $x_f$ and
 $z_f$ denote the positions in the fluid phase,
 $A=L_xL_z$, and
 ${\langle \phi \rangle }$ represents the superficial average value. The intrinsic (fluid phase) average value is
 ${\langle \phi \rangle }^{f}=(A/A_f) {\langle \phi \rangle }$, which involves averaging over the
 $x$–
 $z$ plane occupied by the fluid phase, and dispersion from the intrinsically averaged value is denoted by
 $\tilde {\phi } = \phi -{\langle \phi \rangle }^{f}$, where
 $A_f$ denotes the area of the
 $x$–
 $z$ plane within the fluid phase. As the variable also fluctuates in time, we consider Reynolds averaging over time. The Reynolds-averaged value of the variable
 $\phi$ is denoted as
 $\bar {\phi }$, and
 $\phi '$ denotes the fluctuation from the Reynolds-averaged value:
 $\phi ' = \phi -\bar {\phi }$. For Reynolds averaging, the statistics were accumulated over approximately
 $4 L_x/u_\tau ^p$ for the cases at
 $Re_\tau =955$, and
 $40 L_x/u_\tau ^p$ for the cases at
 $Re_\tau =141$.
3. Results and discussion
3.1. Skin friction coefficient
Before discussing the profiles of the turbulence statistics, we briefly examine how porous walls affect the general flow characteristics. Table 2 lists the friction Reynolds number for the porous wall side,  $Re_\tau ^p=\delta _p u_\tau ^p/\nu$, the bulk mean Reynolds number
 $Re_b=U_bH/\nu$, the permeability Reynolds number
 $Re_K=\sqrt {K}\,u_\tau ^p/\nu$, and skin friction coefficients for the porous wall
 $C^p_f=\tau _w^p/(\rho U_b^2)$ and the smooth wall
 $C^s_f=\tau _w^s/(\rho U_b^2)$. Here, the bulk mean velocity
 $U_b$ is defined as
 $U_b=Q_c/H$, where
 $Q_c$ is the flow rate in the clear flow region,
 $0< y< H$. The trends of
 $C^p_f$ and
 $C^s_f$ are also shown in figure 3 to facilitate understanding of the effects of
 $Re_\tau$ and
 $h/H$. Figure 3(a) shows that
 $C^p_f$ is larger than
 $C^s_f$, as expected. Notably,
 $C^p_f$ for thin-wall cases decreases consistently with
 $Re_\tau$, whereas
 $C^p_f$ for the thick cases exhibits an increase trend when
 $Re_\tau$ increases from
 $331$ to
 $626$. Given that
 $Re_K$ in table 2 is significantly higher than the threshold value
 $3.0$ (Suga et al. Reference Suga, Matsumura, Ashitaka, Tominaga and Kaneda2010), an increase in
 $C^p_f$ is attributed to the combined effects of wall roughness and permeability. Another observation is that
 $C^p_f$ for thick-wall cases tends to converge to a certain value at a higher
 $Re_\tau$, which is similar to the DNS results for turbulent channel flows with modelled permeable walls (Motoki et al. Reference Motoki, Tsugawa, Shimizu and Kawahara2022) as well as experiments for ceramic foams (Suga et al. Reference Suga, Matsumura, Ashitaka, Tominaga and Kaneda2010) and metal foams (Esteban et al. Reference Esteban, Rodríguez-López, Ferreira and Ganapathisubramani2022).
Global flow characteristic parameters:  $Re_\tau ^p=\delta _p u_\tau ^p/\nu$ is the friction Reynolds number for the porous wall side;
 $Re_b=U_bH/\nu$ is the bulk mean Reynolds number;
 $Re_K=\sqrt {K}\,u_\tau ^p/\nu$ is the permeability Reynolds number;
 $C^p_f=\tau _w^p/(\rho U_b^2)$ and
 $C^s_f=\tau _w^s/(\rho U_b^2)$ are the skin friction coefficients for the porous and smooth walls, respectively.

Skin friction coefficients at the porous/fluid interface ( $C^p_f$) and at the smooth wall (
 $C^s_f$) against
 $Re_\tau$: (a)
 $C^p_f$ and
 $C^s_f$ for the thick- and thin-wall cases, and (b) the ratios of
 $C^p_f$ and
 $C^s_f$ for the thick-wall cases divided by the corresponding values for the thin-wall cases.

When attention is given to the effects of the wall thickness  $h/H$, we observe from figure 3(a) that both
 $C^p_f$ and
 $C^s_f$ are larger for the thick-wall cases. An increase in
 $C^p_f$ with wall thickness has also been reported in previous DNS studies (Kuwata & Suga Reference Kuwata and Suga2016b) and experiments (Zippe & Graf Reference Zippe and Graf1983; Manes et al. Reference Manes, Pokrajac, McEwan and Nikora2009). As a result, the thickening of the wall increases
 $Re^p_\tau$ but decreases
 $Re_b$, as shown in table 2. The effects of wall thickness on the skin friction coefficient are illustrated in figure 3(b), where
 $C^p_f$ and
 $C^s_f$ for the thick-wall cases are divided by the corresponding values for the thin-wall cases. Figure 3(b) confirms that the effects of the wall thickness exhibit Reynolds number dependence; the ratio of
 $C^p_f$ increases abruptly with
 $Re_\tau$ up to
 $Re_\tau \simeq 600$, whereas a further increase in
 $Re_\tau$ diminishes this increasing trend. Interestingly, as shown in figure 3(b), the thickening of the wall also increases
 $C^s_f$. This implies that the effects of wall thickness may reach the other side of the top smooth wall. The underlying physics of the modification of
 $C^p_f$ and
 $C^s_f$ is discussed in the following subsections.
3.2. Spanwise rollers
As argued earlier, turbulent flows over a permeable porous wall are characterized by the presence of spanwise rollers associated with the K–H instability. Here, we focus on the effect of the Reynolds number on the presence of spanwise rollers. Figure 4 shows snapshots of streamwise velocity fluctuations normalized by  $u_\tau ^p$ above a porous wall at
 $y^{p+}\simeq 10$. For all cases, the streamwise elongated high- and low-speed streaks are disrupted by wall roughness or permeability, and the footprints of small-scale eddies, which scale with viscous wall units
 $\nu /u_\tau ^p$, decrease with increasing
 $Re_\tau$. More importantly, for the thick-wall cases, with the exception of the lowest
 $Re_\tau$ case, the high- and low-speed regions tend to merge, and are considerably larger than those in the thin-wall cases. This unique turbulence structure may be responsible for the K–H instability, which usually occurs for turbulence over permeable walls (Jiménez et al. Reference Jiménez, Uhlmann, Pinelli and Kawahara2001; Breugem et al. Reference Breugem, Boersma and Uittenbogaard2006; Kuwata & Suga Reference Kuwata and Suga2016b), rough walls (Stoesser et al. Reference Stoesser, Braun, Garcia-Villalba and Rodi2008; García-Mayoral & Jiménez Reference García-Mayoral and Jiménez2011; Endrikat et al. Reference Endrikat, Modesti, García-Mayoral, Hutchins and Chung2021), vegetation canopies (Finnigan Reference Finnigan2000; White & Nepf Reference White and Nepf2007) and elastic walls (Rosti & Brandt Reference Rosti and Brandt2017; Jha & Steinberg Reference Jha and Steinberg2021). In particular, the turbulence structure for case 955-thick is similar to that in the experiments on turbulence over ceramic foam (Suga, Nakagawa & Kaneda Reference Suga, Nakagawa and Kaneda2017; Suga et al. Reference Suga, Okazaki, Ho and Kuwata2018) although the spanwise coherence is visually weaker than reported by the DNS studies (Jiménez et al. Reference Jiménez, Uhlmann, Pinelli and Kawahara2001; Kuwata & Suga Reference Kuwata and Suga2019; Endrikat et al. Reference Endrikat, Modesti, García-Mayoral, Hutchins and Chung2021). The reduction in spanwise coherence is likely due to the Reynolds number effects reported by Kuwata & Suga (Reference Kuwata and Suga2019), who showed that the spanwise-connected high- and low-speed regions became less obvious with increasing
 $Re_K$.
Snapshots of streamwise velocity fluctuations  $u'^{p+}=u'/u_\tau ^p$ at
 $y^{p+}\simeq 10$. The friction Reynolds number increases from left to right. Results for the (a,b) thick-wall and (c,d) thin-wall cases.

Qualitative discussions of the effects of wall thickness on the turbulence structures are made with figure 5, which presents two-dimensional pre-multiplied cospectra of the streamwise and wall-normal velocity fluctuations at  $y^{p+} \simeq 10$. For the lowest
 $Re_\tau$ cases, we see that the energy spectra for cases 141-thick and 141-thin are visually similar. However, the energy spectra in the wavelength regions
 $\lambda _x/\delta _p \simeq 4$ and
 $\lambda _z/\delta _p \simeq 3$ appear to be more energetic for the thick-wall case. This trend is more pronounced for the higher
 $Re_\tau$ cases (626-thick and 955-thick). For cases 626-thick and 955-thick, the energy spectra are dominated by the velocity fluctuations associated with this wavelength region. Note that the more energetic region compared with the thin-wall results is approximately
 $\lambda _x/\delta _p \simeq 4$, which corresponds approximately to the characteristic wavelength of the K–H instability, with
 $\lambda _x/\delta _p \simeq 3\unicode{x2013}5.5$ (Kuwata & Suga Reference Kuwata and Suga2017; Suga et al. Reference Suga, Okazaki, Ho and Kuwata2018),
 $\lambda _x/\delta _p \simeq 1.5\unicode{x2013}3$ (Manes et al. Reference Manes, Poggi and Ridol2011) and
 $\lambda _x/\delta _p \simeq 1\unicode{x2013}5$ (Efstathiou & Luhar Reference Efstathiou and Luhar2018). Therefore, for the present permeable wall, the turbulent structure associated with the K–H instability develops for the thick-wall cases; the effects of the K–H instability are weak at the lowest
 $Re_\tau$ (case 141-thick), whereas the velocity fluctuations associated with the K–H instability dominate turbulence at higher
 $Re_\tau$ (cases 626-thick and 955-thick). However, it should be cautioned that not only the wall thickness but also the wall characteristic parameters related to flow resistance and deformation are key parameters for the occurrence of the K–H instability (Jiménez et al. Reference Jiménez, Uhlmann, Pinelli and Kawahara2001; White & Nepf Reference White and Nepf2007; Rosti & Brandt Reference Rosti and Brandt2017). Indeed, the spanwise rollers develop over the riblets of Endrikat et al. (Reference Endrikat, Modesti, García-Mayoral, Hutchins and Chung2021) and elastic walls of Rosti & Brandt (Reference Rosti and Brandt2017), which are considerably thinner than the thin walls used in this study. Notably, for cases 626-thick and 955-thick, the energetic regions
 $\lambda _x/\delta _p \simeq 4$ and
 $\lambda _z/\delta _p \simeq 3$ remain unchanged by the Reynolds number. The corresponding large-scale motions for case 955-thick are visualized in figure 6, where the spanwise average over
 $0< z<3\delta _p$ is applied to the velocity fluctuations to facilitate clear inspection of large-scale motions (Suga et al. Reference Suga, Okazaki, Ho and Kuwata2018; Motoki et al. Reference Motoki, Tsugawa, Shimizu and Kawahara2022). We observe large-scale spanwise roller motion with a streamwise extent of approximately
 $\lambda _x/\delta _p \simeq 3\unicode{x2013}4$. Visual inspection shows that this may be the maximum possible size of spanwise rollers that can be accommodated in a porous-walled channel. This may be why an increase in
 $Re_\tau$ from
 $626$ to
 $955$ does not alter the energy spectra significantly. In this sense, the turbulence for cases 626-thick and 955-thick can be referred to as the ‘ultimate porous wall turbulence regime’. The maximum possible size of the spanwise rollers depends on the flow configuration. The sizes of spanwise rollers scale principally with shear length scales (Finnigan Reference Finnigan2000; White & Nepf Reference White and Nepf2007); however, the sizes of spanwise rollers are restricted by the flow confinement, such as the flow depth for gravel flows (Roy et al. Reference Roy, Buffin-Belanger, Lamarre and Kirkbride2004; Manes et al. Reference Manes, Poggi and Ridol2011) and vegetation height for canopy flows (Nepf & Vivoni Reference Nepf and Vivoni2000).
Two-dimensional pre-multiplied cospectra of streamwise and wall-normal velocity fluctuations  $(E_{uv}\kappa _x\kappa _z)^{p+}$ at
 $y^{p+} \simeq 10$. The friction Reynolds number increases from left to right. The top and bottom rows show the results for the thick- and thin-wall cases, respectively. The thin dashed lines indicate
 $\lambda _x/\delta _p =3$ and
 $5$,
 $\lambda _z/\delta _p =2$ and
 $4$.

Snapshots of velocity fluctuations averaged over  $0< z<3\delta _p$ for case 955-thick. The contour shows the spanwise-average wall-normal velocity fluctuations. The blue and red contours indicate
 $v'^{p+}=-0.5$ and
 $+0.5$, respectively.

To better understand the contribution of spanwise rollers to the Reynolds shear stress in the clear flow region, following Endrikat et al. (Reference Endrikat, Modesti, García-Mayoral, Hutchins and Chung2021), we analyse the Reynolds shear stress contributed by relatively large-scale velocity fluctuations:
 \begin{equation} R_{12,L}(y)= \int_{1/L_x}^{\kappa^*_{x}} \int_{1/L_z}^{\kappa^*_{z}} E_{uv}(y)\,{\rm d}\kappa_x \,{\rm d}\kappa_z, \end{equation}
where the choices of  $\kappa ^*_{x}$ and
 $\kappa ^*_{z}$ are arbitrary; we use
 $\kappa ^*_{x}=\kappa ^*_{z}=2/(3H)$, which corresponds to wavelength approximately
 $2\delta _p$. That is,
 $R_{12,L}$ consists of the velocity fluctuations in the wavelength regions
 $\lambda _x \gtrsim 2\delta _p$ and
 $\lambda _z \gtrsim 2\delta _p$, which covers the characteristic scale of spanwise rollers
 $\lambda _x \simeq 4\delta _p$ and
 $\lambda _z \simeq 3\delta _p$. However,
 $R_{12,L}$ may not represent perfectly the contribution of spanwise rollers, but also contains velocity fluctuations associated with irrelevant large-scale perturbations. The contributions of relatively large-scale velocity fluctuations to the Reynolds shear stress are shown in figure 7. Evidently, no major difference was observed between
 $-R_{12}^{p+}$ for the thick- and thin-wall cases, whereas the effects of wall thickness are distinctly visible in the decomposed Reynolds shear stress
 $-R^{p+}_{12,L}$. In figures 7(a,c),
 $-R^{p+}_{12,L}$ for the thick-wall cases occupies a large portion of
 $-R_{12}^{p+}$ for the porous wall side, and the dominance of
 $-R_{12}^{p+}$ is more pronounced at
 $Re_\tau =955$ (case 955-thick). Considering that relatively large-scale fluctuations are associated mostly with spanwise rollers owing to K–H instability, we can deduce that spanwise rollers contribute to the enhancement of the Reynolds shear stress. This is the leading cause of the increase in
 $C_f^p$ with the Reynolds number for the thick-wall cases. Indeed, for the thick-wall cases, the augmentation of
 $C_f^p$ with respect to the thin-wall case is more pronounced with the enhancement of the energy spectra around
 $\lambda _x\simeq 4\delta _p$ and
 $\lambda _z \simeq 3\delta _p$. In the ‘ultimate porous wall turbulence regime’ for cases 626-thick and 955-thick, where the dominance of the velocity fluctuations associated with the K–H instability is saturated,
 $C_f^p$ is almost independent of the Reynolds number.
Contributions of the decomposed Reynolds shear stress normalized by  $u_\tau ^p$: (a) case 141-thick, (b) case 141-thin, (c) case 955-thick, and (d) case 955-thin. The Reynolds shear stress is denoted by
 $R_{12}$, and
 $R_{12,L}$ is the contribution by relatively large-scale velocity fluctuations defined as (3.1).

3.3. Effects of spanwise rollers on Reynolds stress
The above discussion confirms that spanwise rollers are the root cause of the increased  $C_f^p$ for thick-wall cases. This subsection focuses on how spanwise rollers augment momentum transfer. Figure 8 shows the streamwise and wall-normal turbulence intensities,
 $\sqrt {R_{11}}$ and
 $\sqrt {R_{22}}$, respectively, normalized by the average friction velocity
 $u_\tau$, where the Reynolds stress is defined as
 $R_{ij}={\langle \overline {u_i'u_j'} \rangle }$. For the clear flow region
 $0< y/H<1$, the maximum peak values of the turbulence intensities near the porous/fluid interface are unaffected by the wall thickness. However, away from the porous wall, the thickening of the wall tends to increase the turbulence intensity. An increase in
 $\sqrt {R_{22}}^+$ is observed in a large portion of the clear flow region,
 $0.2< y/H<0.9$, whereas an increase in
 $\sqrt {R_{11}}^+$ is notable at approximately
 $y/H \simeq 0.8$. The enhanced turbulence intensities away from the wall are pronounced for cases 626-thick and 955-thick where spanwise rollers dominate the turbulence.
Streamwise and wall-normal turbulence intensities: (a)  $Re_\tau =141$, (b)
 $Re_\tau =331$, (c)
 $Re_\tau =626$, and (d)
 $Re_\tau =955$.

The second moments that contribute to the momentum transfer are shown in figure 9, which depicts the Reynolds shear stress  $R_{12}$ and dispersive covariance
 $\mathcal {T}_{12}={\langle \tilde {\bar {u}} \tilde {\bar {v}} \rangle }$. In addition, we plot the correlation coefficient for the Reynolds shear stress
 $R_{cor}=-R_{12}/(\sqrt {R_{11}}\sqrt {R_{22}})$. The dispersive covariance
 $\mathcal {T}_{12}$ consists of the mean velocity dispersion, which results from the tortuous mean velocity caused by the obstruction of the Kelvin cell arrays. When attention is paid to
 $-\mathcal {T}_{12}^+$, figures 9(a,c) show that
 $-\mathcal {T}_{12}^+$ is produced slightly below the porous/fluid interface, although we observe no perceptible effects of wall thickness on
 $-\mathcal {T}^+_{12}$. In other words, spanwise rollers do not significantly alter the mean velocity distribution below the porous/fluid interface. Regarding
 $-R_{12}^+$, figures 9(a,c) show that in the clear flow region,
 $-R_{12}^+$ for the thick-wall case shifts upwards with respect to the thin-wall results, which is pronounced at
 $Re_\tau =955$ in figure 9(c). As the Reynolds shear stress dominates the momentum transfer,
 $C_f^p$ in table 2 reflects the trend of
 $-R^+_{12}$;
 $C_f^p$ for case 955-thick is
 $67\,\%$ larger than that for case 955-thin, whereas the increase ratio for case 141-thick is reduced to
 $20\,\%$. Interestingly, near the porous/fluid interface (
 $-0.3< y/H<0.3$), the increased
 $-R_{12}^+$ for case 955-thick can be attributed to the increased correlation coefficient
 $R_{cor}$ as shown in figure 9(b), which is most likely a sign of a more organized turbulence structure over the thick wall for case 955-thick. Above this region (
 $0.3< y/H<0.7$), the thickening of the wall does not increase
 $R_{cor}$ but increases
 $R^+_{11}$ or
 $R^+_{22}$, as shown in figure 8(d), suggesting that the enhanced turbulence intensity contributes to an increase in
 $-R^+_{12}$ in this region. The same but less distinct trend is observed for case 141-thick in figure 9(b). Therefore, it is suggested that the increased
 $C_f^p$ for the thick-wall cases, which is a result of the increased
 $-R^+_{12}$, is attributed to the combined effects of the enhanced turbulence intensity and organization.
(a,c) Shear stress due to the turbulent velocity fluctuations, i.e. the Reynolds shear stress  $R_{12}={\langle \overline {u'v'} \rangle }$, and shear stress due to the tortuous mean velocity, i.e. the dispersive covariance
 $\mathcal {T}_{12}={\langle \tilde {\bar {u}}\ \tilde {\bar {v}} \rangle }$. (b,d) Correlation coefficient for the Reynolds shear stress
 $R_{cor}=-R_{12}/(\sqrt {R_{11}}\sqrt {R_{22}})$. Plots for (a,b)
 $Re_\tau =141$, and (c,d)
 $Re_\tau =955$.

To gain a better physical understanding of the modification of the correlation coefficient  $R_{cor}$, the joint probability density function (JPDF) of streamwise and wall-normal velocity fluctuations at
 $y^{p+} \simeq 10$ for cases 955-thick and 955-thin is presented in figure 10. As interest is centred on the effects of spanwise rollers, the JPDF of the low-pass filtered velocity fluctuations with cutoff wavenumber
 $\kappa ^*_{x}=\kappa ^*_{z}=2/(3H)$ is also presented in figures 10(b,d). Here, the cutoff wavenumber was the same as that used in the earlier analysis of the Reynolds shear stress decomposition in figure 7. We confirm from figures 10(a,c) that the JPDF is characterized by the intense sweep motion (
 $u'>0$,
 $v'<0$) and weak ejection motion (
 $u'<0$,
 $v'>0$). Attenuated wall-blocking effects result in an intense sweep towards the permeable porous wall, which pushes a high-momentum fluid into the porous wall leading to a seepage upward flow with a low-momentum fluid, that is, weak ejection. From figures 10(a,c), no major difference is observed between the
 $P_{uv}$ for the thick- and thin-wall cases. However, for case 955-thick, intense sweep and weak ejection events occurred a little more frequently, and the JPDFs for inward (
 $u'<0$,
 $v'<0$) and outward (
 $u'>0$,
 $v'>0$) interaction events appear to shrink. Consequently, the correlation coefficient between
 $u'$ and
 $v'$ is 11 % larger for case 955-thick. Interestingly, the effect of wall thickness is magnified for the JPDF of the low-pass filtered velocities
 $P_{\hat {u}\hat {v}}$, as shown in figures 10(b,d). The probability density of the low-pass filtered velocities for case 955-thin in figure 10(b) is clustered near the origin. In contrast, for case 955-thick in figure 10(d), the peak value of
 $P_{\hat {u}\hat {v}}$ decreases substantially, and the tails of
 $P_{\hat {u}\hat {v}}$ for the sweep and ejection events are stretched, indicating that the intense sweep and ejection events occur more frequently. Moreover, the negative correlation between
 $\widehat {u'}$ and
 $\widehat {v'}$ is more significant than that for the unfiltered velocity fluctuations. Given that low-pass filtered velocity fluctuations most likely result from spanwise rollers, as argued previously, it is conjectured that the increase in
 $R_{cor}$ for case 955-thick is attributed to highly correlated large-scale velocity fluctuations, which are enhanced considerably by spanwise rollers.
Joint probability density function (JPDF) of velocity fluctuations at  $y^{p+} \simeq 10$: (a,c) JPDF of velocity fluctuations
 $P_{uv}$; (b,d) JPDF of low-pass filtered velocity fluctuations
 $P_{\hat {u} \hat {v}}$. Plots for (a,b) case 955-thin, and (c,d) case 955-thick.

These results indicate that two potential mechanisms may be involved in the increased friction coefficient by spanwise rollers. The first is the reinforcement of the negative correlation between the wall-normal and streamwise velocity fluctuations close to the porous/fluid interface. The second is the enhanced wall-normal and streamwise velocity fluctuations away from the porous/fluid interface. Both reinforce the Reynolds shear stress above the porous/fluid interface, resulting in an augmentation of momentum transfer.
3.4. Logarithmic mean velocity profile
This subsection explores the effects of spanwise rollers on the mean velocity profiles. For permeable or rough wall turbulence, the modified log law in (1.1) is used to characterize the streamwise mean velocity profile. A common issue in permeable wall turbulence studies is how we parametrize the log-law parameters  $\kappa$,
 $d_p$ and
 $h_r$. Several approaches have been proposed and tested to determine the log-law parameters. Esteban et al. (Reference Esteban, Rodríguez-López, Ferreira and Ganapathisubramani2022) determined those parameters with an assumption that
 $\kappa$ for the permeable wall turbulence is the same as that for smooth-wall turbulent boundary layers,
 $\kappa _0$, whereas Breugem et al. (Reference Breugem, Boersma and Uittenbogaard2006), Suga et al. (Reference Suga, Matsumura, Ashitaka, Tominaga and Kaneda2010) and Manes et al. (Reference Manes, Poggi and Ridol2011) determined the
 $d_p$ value that forces
 $\gamma =(y+d_p)({\rm d} U^{p+}/{{\rm d}y})$ to be constant in the logarithmic region, which yields a
 $\kappa$ value smaller than
 $\kappa _0$. Alternatively, Kuwata (Reference Kuwata2022b) determined the
 $d_p$ value based on the Jackson model (Jackson Reference Jackson1981) and determined the value of
 $\kappa$ using the profile of the diagnostic function
 $\gamma$, which on the contrary yielded a
 $\kappa$ value larger than
 $\kappa _0$. The controversy regarding the
 $\kappa$ value resides in the fact that there are several possible sets of parameters for plausibly approximating the mean velocity profiles over porous walls because of the presence of three free parameters:
 $\kappa$,
 $d_p$ and
 $h_r$. However, as
 $\kappa$ is linked originally to Prandtl's mixing-length hypothesis,
 $\kappa$ is no longer a free parameter; instead, a physically appropriate value should be prescribed for
 $\kappa$. In this study, we do not resort to
 $\kappa =\kappa _0$ because spanwise rollers alter the turbulence statistics far from the porous/fluid interface, as discussed in the previous subsection, which possibly modifies the
 $\kappa$ value. In addition, as the Reynolds number under consideration is not sufficiently high to perfectly guarantee a logarithmic mean velocity profile (Jiménez & Moser Reference Jiménez and Moser2007; Lee & Moser Reference Lee and Moser2015), we do not rely on the assumption of constant
 $\gamma$ in the logarithmic region. Therefore, we follow the previous work of Kuwata (Reference Kuwata2022b), who did not assume
 $\gamma$ to be constant, and did not rely on
 $\kappa =\kappa _0$. This approach determines
 $d_p$ using the extended Jackson model for pressure-driven turbulence boundary layers proposed by Breugem et al. (Reference Breugem, Boersma and Uittenbogaard2006), where
 $d_p$ is defined as the level at which the mean drag minus the mean pressure gradient acts as follows:
 \begin{equation} d_p = \frac{\displaystyle \int_{{-}h}^0 yf_x \,{{\rm d}y}}{\displaystyle \int_{{-}h}^0 f_x \,{{\rm d}y}}, \end{equation}
where  $f_x$ denotes the
 $x$–
 $z$ plane averaged streamwise drag force exerted by the porous wall minus the mean pressure gradient (Breugem et al. Reference Breugem, Boersma and Uittenbogaard2006; Kuwata Reference Kuwata2022b). The drag force includes the viscous and pressure drag forces, and plays a crucial role in the momentum transfer within the porous wall, which appears in the
 $x$–
 $z$ plane averaged momentum equations.
To determine the von Kármán constant  $\kappa$ using the diagnostic function
 $\gamma =(y+d_p)({\rm d} U^{p+}/{{\rm d}y})$, figure 11 depicts the profiles of
 $\gamma$ for the thin- and thick-wall cases. For comparison, the smooth-wall results at comparable friction Reynolds numbers
 $150$ and
 $300$ from Iwamoto et al. (Reference Iwamoto, Suzuki and Kasagi2002),
 $590$ from Vreman & Kuerten (Reference Vreman and Kuerten2014), and
 $944$ from Hoyas & Jiménez (Reference Hoyas and Jiménez2008), are shown. As is evident from the smooth-wall results shown in figure 11, the profiles do not exhibit a plateau value of
 $\gamma$ owing to the low Reynolds number effects. Thus a logarithmic region cannot be rigorously expected for the present results. Nevertheless, the results have interesting implications regarding the slope of the logarithmic mean velocity. The first notable observation is that in the middle of the boundary layer, the
 $\gamma$ profiles for the thin-wall cases collapse reasonably onto the smooth-wall results, except for the lowest
 $Re_\tau$ cases in figure 11(a). This suggests that the slope of the mean velocity profile is not altered by the thin wall. Similar observations were made for rough wall turbulence (Jiménez Reference Jiménez2004), and this may substantiate the outer layer similarity, in which the wall roughness retards the mean velocity, yet is not felt by the turbulence far from rough walls (Townsend Reference Townsend1980). Thus, in this sense, the present thin porous wall behaves more like a rough wall than a permeable wall. Note that the small discrepancy with the smooth-wall results is due to the large size of the Kelvin cell and the small
 $Re_\tau$ because the similarity hypothesis holds only if the roughness elements are sufficiently small and the Reynolds number is sufficiently high. The reasonable agreement of
 $\gamma$ with the smooth-wall results implies that the thin wall does not change
 $\kappa$ from the smooth-wall value
 $\kappa _0$; that is,
 $\kappa \simeq \kappa _0$.
Comparison of the diagnostic function  $\gamma =(y+d_p)({\rm d} U^{p+}/{{\rm d}y})$: (a)
 $Re_\tau =141$, (b)
 $Re_\tau =331$, (c)
 $Re_\tau =626$, and (d)
 $Re_\tau =955$. For comparison, we include the smooth-wall results at
 $Re_\tau =150$ from Iwamoto, Suzuki & Kasagi (Reference Iwamoto, Suzuki and Kasagi2002) in (a),
 $Re_\tau =300$ from Iwamoto et al. (Reference Iwamoto, Suzuki and Kasagi2002) in (b),
 $Re_\tau =590$ from Vreman & Kuerten (Reference Vreman and Kuerten2014) in (c), and
 $Re_\tau =944$ from Hoyas & Jiménez (Reference Hoyas and Jiménez2008) in (d).

In contrast,  $\gamma$ for the thick-wall cases largely deviates from the smooth-wall results. Interestingly, figures 11(b–d) confirm that
 $\gamma$ is shifted downwards with respect to the smooth-wall results. Given that
 $\gamma$ in the logarithmic region is related to the inverse of
 $\kappa$, the introduction of the downward shift
 ${\rm \Delta} \gamma$, i.e.
 $1/\kappa =1/\kappa _0+{\rm \Delta} \gamma$, may modify the von Kármán constant as follows:
 \begin{equation} \kappa = \frac{ \kappa_{0} }{1-\kappa_{0}\,{\rm \Delta} \gamma}. \end{equation}
Evidently, the positive value of  ${\rm \Delta} \gamma$ yields a larger
 $\kappa$ value compared with the smooth-wall value
 $\kappa _0$. A physical explanation for the increase in
 $\kappa$ can be provided based on the classical mixing length model. The modelled Reynolds shear stress based on the concept of mixing length hypothesis is expressed as
 \begin{equation} {-}R_{12} ={-}\ell_M^2 \left|\frac{{\rm d} U}{{\rm d}y}\right|\frac{{\rm d} U}{{\rm d}y}, \end{equation}
where  $\ell _M$ denotes the mixing length. For the thick-wall cases, where the effects of the K–H instability emerge, figure 7 shows that the Reynolds shear stress is caused primarily by relatively large-scale velocity fluctuations induced by spanwise rollers. Hence the mixing length, which is related to the turbulent vortex scale, can presumably be increased by spanwise rollers. This idea is consistent with that mentioned by Poggi et al. (Reference Poggi, Porporato, Ridolfi, Albertson and Katul2004), who discussed the modelling of vegetation canopy turbulence based on an increased mixing length. Assuming that the inner-scaled total stress, which consists of viscous and turbulent stresses, is unity in the inner layer, the mean velocity gradient is expressed in terms of the mixing length, as
 \begin{equation} \frac{{\rm d} U^{p+}}{{{\rm d}y}^{p+}} = \frac{2}{1+\sqrt{1+4(\ell_M^{p+})^2}}. \end{equation}
This equation indicates that an increased mixing length leads to a decrease in the mean velocity gradient and the diagnostic function  $\gamma =(y+d_p)({\rm d} U^{p+}/{{\rm d}y})$, resulting in an increase in the von Kármán constant
 $\kappa$ through the relationship
 $\kappa =\gamma ^{-1}$. Therefore, it can be argued that the emergence of the effects of the K–H instability is the main cause of the increase in
 $\kappa$. Once
 $\kappa$ and
 $d_p$ are known, the
 $h_r$ value is obtained by collapsing the mean velocity profile into the modified log law. These parameters are summarized in figure 12, where parameters
 $\kappa$,
 $d_p^{p+}$ and
 $h_r^{p+}$ are plotted against
 $Re_K=\sqrt {K}^{p+}$. Here,
 $\kappa _0=0.4$ is used as the smooth-wall value; thus
 $\kappa$ for the thin-wall cases is assumed to be
 $\kappa =\kappa _0=0.4$. For the lowest
 $Re_\tau$ cases, we assume that
 $\kappa$ for case 141-thin remains unchanged from the smooth-wall value, as in the other thin-wall cases, whereas
 $\kappa$ for case 141-thick is estimated from the downshift value of
 $\gamma$ with respect to the thin-wall result from figure 11(a). The surrogate
 $\kappa$ values and the resulting
 $h_r^{p+}$ values are denoted by the open symbols in the figure. Figures 12(a,b) show that
 $d_p^{p+}$ and
 $h_r^{p+}$ are proportional to
 $Re_K$ except for
 $h_r^{p+}$ at
 $Re_\tau =141$ (cases 141-thick and 141-thin), indicating that
 $d_p \propto \sqrt {K}$ and
 $h_r \propto \sqrt {K}$. This means that parameters
 $d_p$ and
 $h_r$ are connected to a physical length scale, even though these parameters are flow properties. This supports the findings of previous experiments on turbulent flows over porous foams by Manes et al. (Reference Manes, Poggi and Ridol2011) and Suga et al. (Reference Suga, Matsumura, Ashitaka, Tominaga and Kaneda2010), although the proportionality constants of these studies disagree with the present results because of the differences in the procedures for obtaining
 $d_p$ and
 $h_r$. Regarding the von Kármán constant
 $\kappa$ in figure 12(c),
 $\kappa$ for the thick-wall cases increases with
 $Re_K$ and become saturated to
 $\kappa \simeq 0.6$ at
 $Re_K>30$. This reflects the dominance of spanwise rollers, as shown in figure 5; the effect of the K–H instability is weak for case 141-thick, but increases with the Reynolds number. The
 $\kappa$ value increases correspondingly, although eventually,
 $\kappa$ reaches a plateau in the ‘ultimate porous wall turbulence regime’ for cases 626-thick and 955-thick where the dominance of velocity fluctuations associated with the K–H instability is almost unaffected by the Reynolds number. The inner-scaled mean velocity profiles along with the resulting log-law profiles are shown in figure 13. For comparison, the smooth-wall results at
 $Re_\tau =944$ from Hoyas & Jiménez (Reference Hoyas and Jiménez2008), and
 $Re_\tau =109$ from Iwamoto et al. (Reference Iwamoto, Suzuki and Kasagi2002), are included. For the porous wall side, the figure confirms that
 $U^{p+}$ profiles over the porous walls can be approximated reasonably using the modified log law of (1.1). The slope of the
 $U^{p+}$ profile for the thick-wall cases in figure 13(a) decreases with
 $Re_\tau$, whereas the slope does not change for thin-wall cases in figure 13(b). For thin-wall cases, as the slopes of the
 $U^{p+}$ profiles are unchanged and
 $d_p \propto \sqrt {K}$, the
 $U^{p+}$ profiles can be expressed as smooth-wall profiles with a downward shift of
 ${\rm \Delta} U^{p+}$. This downward shift is referred to as roughness function
 ${\rm \Delta} U^{p+}$ and is expressed in terms of
 $h_r$ as
 \begin{equation} {\rm \Delta} U^{p+} = \frac{1}{\kappa} {\rm ln} (h_r^{p+}) + B , \end{equation}
where  $B$ is the log-law intercept for smooth-wall turbulence. Using the earlier observation of
 $h_r \propto \sqrt {K}$, we can cast (3.6) into the correlation for
 ${\rm \Delta} U^{p+}$ in the fully rough regime (Flack & Schultz Reference Flack and Schultz2010):
 \begin{equation} {\rm \Delta} U^{p+} = \frac{1}{\kappa} \ln (k^{p+}_s) + B - 8.5, \end{equation}
where the equivalent sand grain roughness can be related to  $k_s=h_r\exp (8.5\kappa )$. The earlier observation of
 $h_r \propto \sqrt {K}$ leads to
 $k_s \propto \sqrt {K}$, suggesting that the equivalent sand grain roughness is related to the square root of the permeability. The thin porous walls in the present study yields
 $k_s \simeq 13\sqrt {K}$, although the proportional constant may depend on the geometry of the porous walls. Hence, the earlier observations of
 $\kappa =\kappa _0$,
 $h_r \propto \sqrt {K}$ and
 $d_p \propto \sqrt {K}$ suggest that the mean velocity profiles over thin walls can be expressed similarly to the rough wall turbulence in the fully rough regime, where the roughness is no longer within the viscous sublayer but protrudes into the logarithmic region. Judging from the roughness Reynolds number for case 141-thin of
 $k^+_s \simeq 90$, the turbulent flow for case 141-thin may not be perfectly within the fully rough regime, although the onset of the fully rough regime remains controversial (Flack, Schultz & Rose Reference Flack, Schultz and Rose2012). This is the reason why
 $h_r \propto \sqrt {K}$ is not retained for case 141-thin. In contrast, for thick-wall cases, the thick walls allow for the development of spanwise rollers, leading to an increased
 $\kappa$. This makes it impossible to use the concept of the roughness function
 ${\rm \Delta} U^{p+}$ because the slopes of the
 $U^{p+}$ profiles over the thick walls are no longer the same as those of the smooth-wall profiles. Moreover, there may be an interaction between roughness-induced turbulent vortices and spanwise rollers. Therefore, the equivalent roughness height
 $h_r$ for the thick-wall cases differs from the corresponding values for the thin-wall cases as shown in figure 12, despite the fact the geometry of the subsurface porous wall remains the same. Interestingly, the effects of the wall thickness are also visible for the
 $U^{s+}$ profile for the smooth-wall side. We observe that the
 $U^{s+}$ profile tends to be lower for the thick-wall cases. The
 $U^{s+}$ profiles for cases 626-thin and 955-thin in figure 13(b) are close to the DNS results at
 $Re_\tau =109$, whereas the corresponding profiles for the thick-wall cases in figure 13(a) are below the DNS profiles. This is reflected in the skin friction coefficient, as shown in figure 3, which shows that the thickening of the wall increases
 $C_f^s$. Although the mechanisms are not clear, it is evident that spanwise rollers, which develop over thick walls, affect the turbulence for the other side of the smooth wall.
Parameters for modified log law versus the permeability Reynolds number  $Re_K$: (a) zero-plane displacement
 $d_p^{p+}$, (b) equivalent roughness height
 $h_r^{p+}$, and (c) von Kármán constant
 $\kappa$. Open symbols denote the surrogate values for the lowest
 $Re_\tau$ cases. The linear fitted lines are added in (a,b).

Inner-scaled mean velocity profiles for the porous wall side  $U^{p+}$ and smooth-wall side
 $U^{s+}$: (a) thick-wall cases, and (b) thin-wall cases. The mean velocity
 $U^{p+}$ is plotted against
 $(y+d_p)^{p+}$, while
 $U^{s+}$ is plotted against the distance from the smooth wall
 $(H-y)^{s+}$. For comparison, the smooth-wall results at
 $Re_\tau =944$ from Hoyas & Jiménez (Reference Hoyas and Jiménez2008), and
 $Re_\tau =109$ from Iwamoto et al. (Reference Iwamoto, Suzuki and Kasagi2002), are included. The thin solid lines denote the modified log-law profiles with the log-law parameters in figure 12.

3.5. Predictive model for the skin friction coefficient
The log-law parameters  $d_p$,
 $h_r$ and
 $\kappa$ are crucial for predicting mean flows over porous walls. Hence, in this subsection, we discuss predictive models for these parameters, with the aid of the earlier findings for
 $\kappa \neq \kappa _0$,
 $h_r \propto \sqrt {K}$ and
 $d_p \propto \sqrt {K}$ for thick walls. To develop widely applicable models, the validity of the developed model for a variety of porous media must be assessed. However, a direct comparison of the log-law parameters in the literature is meaningless because these parameters depend strongly on the determination procedure. Alternatively, we assess
 $C_f^p$ predicted by the modified log law using the modelled log-law parameters, which enables us to briefly assess the validity of the developed models of
 $d_p$,
 $h_r$ and
 $\kappa$ for large amounts of experimental and DNS data. Assuming a flow with a high Reynolds number where a large portion of the clear flow region is occupied by the logarithmic region, the bulk mean velocity
 $U_b^{p+}$ can be approximated by integrating the modified log law:
 \begin{equation} U_b^{p+} \simeq \frac{1}{\delta_p}\int_0^{\delta_p}\frac{1}{\kappa} \ln \left(\frac{y +d_p}{h_r}\right) {{\rm d}y} = \frac{1}{\kappa} \left[\ln \left({\frac{\delta_p +d_p}{h_r} }\right) + \frac{d_p}{\delta_p} \ln\left( {\frac{\delta_p +d_p}{d_p} }\right) -1 \right]. \end{equation}
This yields the skin friction coefficient  $C^p_f=2/(U_b^{p+})^2$:
 \begin{equation} C^p_f = 2\kappa^2\left[\ln \left({\frac{\delta_p +d_p}{h_r} }\right) + \frac{d_p}{\delta_p} \ln\left( {\frac{\delta_p +d_p}{d_p} }\right) -1 \right]^{{-}2}. \end{equation}
An important implication of (3.9) is that for high Reynolds number flows over a porous wall where we assume  $\kappa ={\rm const}.$,
 $d_p \propto \sqrt {K}$ and
 $h_r \propto \sqrt {K}$, the skin friction coefficient depends on the square root of the Darcy number,
 $\sqrt {Da}=\sqrt {K}/\delta _p$, but does not depend on the Reynolds number:
 \begin{equation} C^p_f = 2\kappa^2\left[\ln \left({\frac{1 +C_1\sqrt{Da}}{C_2\sqrt{Da}} }\right) + C_1\sqrt{Da} \ln\left( {\frac{1 +C_1\sqrt{Da}}{C_1\sqrt{Da}} }\right) -1 \right]^{{-}2}, \end{equation}
where  $C_1$ and
 $C_2$ are the proportionality constants for
 $d_p$ and
 $h_r$ with
 $\sqrt {K}$, respectively. The Reynolds number independence of
 $C^p_f$ is consistent with observations in experimental (Suga et al. Reference Suga, Matsumura, Ashitaka, Tominaga and Kaneda2010; Esteban et al. Reference Esteban, Rodríguez-López, Ferreira and Ganapathisubramani2022) and DNS (Motoki et al. Reference Motoki, Tsugawa, Shimizu and Kawahara2022) studies.
For the present porous wall (thick-wall cases), we obtain a set of correlations of the log-law parameters in the ‘ultimate porous wall turbulence regime’ as shown in figure 12:
 \begin{equation} \left.\begin{gathered} \kappa = 0.6, \\ d_p^{p+} = 2.2\,Re_K-10, \\ h_r^{p+} = 0.21\,Re_K + 4.3. \end{gathered}\right\} \end{equation}
For low  $Re_K$ flows (
 $Re_K<30$),
 $h_r^{p+}$ is lower than the linear correlation in (3.11), and
 $\kappa$ approaches the smooth-wall value asymptotically. To reproduce a low
 $Re_K$ limit where the modified log law returns to the standard log law, that is,
 $\kappa =\kappa _0$,
 $d_p^{p+}=0$ and
 $h_r^{p+}=\exp (-B\kappa )$, we introduced damping functions to correct the limiting behaviour of the set of correlations:
 \begin{equation} \left.\begin{gathered} \kappa = 0.6 f_1 + \kappa_0(1-f_1), \\ d_p^{p+} = \max(2.2\,Re_K-10, 0), \\ h_r^{p+} = (0.21\,Re_K + 4.3)f_2 + \exp({-}B\kappa)(1-f_2). \end{gathered}\right\} \end{equation}
Here, we employ simple expressions for the damping functions  $f_1$ and
 $f_2$:
 \begin{equation} \left.\begin{gathered}
f_1 = 1-\exp({-}Re_K^{1.5}/164),\\
f_2 = 1-\exp({-}Re_K^{1.5}/22.6),
\end{gathered}\right\}
\end{equation}
where the damping functions are tuned based on the present DNS results for the thick-wall cases. To test the applicability of the models,  $C^p_f$ predicted by (3.9) with a set of modelled correlations was compared with the available experimental and DNS results. The results are shown in figure 14, which includes
 $38$ reference data for
 $20$ porous media, including experimental data for ceramic foams (Suga et al. Reference Suga, Matsumura, Ashitaka, Tominaga and Kaneda2010), metal foams (Manes et al. Reference Manes, Poggi and Ridol2011; Esteban et al. Reference Esteban, Rodríguez-López, Ferreira and Ganapathisubramani2022), packed beds of spheres (Manes et al. Reference Manes, Pokrajac, McEwan and Nikora2009), rod array (Dunn et al. Reference Dunn, López and García1996) and plate array (Nezu & Sanjou Reference Nezu and Sanjou2008), and the DNS data for the cube arrays (Breugem & Boersma Reference Breugem and Boersma2005; Kuwata & Suga Reference Kuwata and Suga2016b), cylinder arrays (Chu et al. Reference Chu, Wang, Yang, Terzis, Helmig and Weigand2021) and perforated matrix (Kuwata & Suga Reference Kuwata and Suga2017). We also include the DNS data based on the volume-averaged Navier–Stokes equations (Breugem et al. Reference Breugem, Boersma and Uittenbogaard2006; Rosti et al. Reference Rosti, Cortelezzi and Quadrio2015). The porosity
 $\varphi$ and permeability Reynolds number
 $Re_K$ of the tested porous media are summarized in table 3. As shown in table 3, except for the packed beds of spheres (SB) and cylinder arrays (CYA5), the tested porous media have a relatively high porosity value (
 $\varphi \ge 0.6$), and the permeability Reynolds number
 $Re_K$ ranges from
 $1.1$ to
 $1500$. For the cylinder arrays (CYA5 and CYA8) from Chu et al. (Reference Chu, Wang, Yang, Terzis, Helmig and Weigand2021), we prescribed the permeability using the empirical correlation proposed by Macdonald et al. (Reference Macdonald, El-Sayed, Mow and Dullien1979). For the rod array (Dunn et al. Reference Dunn, López and García1996) and plate array (Nezu & Sanjou Reference Nezu and Sanjou2008), we used the permeability values given by Kuwata & Suga (Reference Kuwata and Suga2015). The skin friction coefficient over the metal foam in Esteban et al. (Reference Esteban, Rodríguez-López, Ferreira and Ganapathisubramani2022) was defined based on the free-stream velocity. Accordingly, for these cases, we alternatively define
 $C_f^p$ based on the mean velocity at the edge of the boundary layer
 $y=\delta _p$ as
 \begin{equation} C^p_f = 2\kappa^2\left[\ln \left({\frac{\delta_p +d_p}{h_r} }\right) \right]^{{-}2}. \end{equation}
The figure shows that the predicted  $C^p_f$ correlates well with the actual
 $C_f^p$ value, although the proposed model considerably overestimates
 $C^p_f$ for cases CYA5 and SB, where the porosity values are relatively low. This demonstrates the validity of the proposed model for various porous media with high porosity, despite the fact that the proposed model was optimized using only the present DNS data. It can be interpreted that the wall permeability is a key parameter that characterizes the logarithmic mean velocity profiles over various porous media as long as the porous media have a high porosity (
 $\varphi \ge 0.6$).
Comparison of the predicted and actual  $C_f^p$. The predicted
 $C_f^p$ is given by (3.9) with (3.12) and (3.13). For reference data, we include the experimental data for ceramic foam (Suga et al. Reference Suga, Matsumura, Ashitaka, Tominaga and Kaneda2010), metal foam (Manes et al. Reference Manes, Poggi and Ridol2011; Esteban et al. Reference Esteban, Rodríguez-López, Ferreira and Ganapathisubramani2022), packed beds of spheres (Manes et al. Reference Manes, Pokrajac, McEwan and Nikora2009), rod array (Dunn, López & García Reference Dunn, López and García1996) and plate array (Nezu & Sanjou Reference Nezu and Sanjou2008). Moreover, we include the DNS data for a modelled cube array (Breugem et al. Reference Breugem, Boersma and Uittenbogaard2006), modelled porous wall (Rosti, Cortelezzi & Quadrio Reference Rosti, Cortelezzi and Quadrio2015), cube arrays (Breugem & Boersma Reference Breugem and Boersma2005; Kuwata & Suga Reference Kuwata and Suga2016b), cylinder array (Chu et al. Reference Chu, Wang, Yang, Terzis, Helmig and Weigand2021) and perforated matrix (Kuwata & Suga Reference Kuwata and Suga2017). The thin line denotes that the predicted
 $C_f^p$ is equal to the actual
 $C_f^p$.

Characteristics of the tested porous media.

A plausible explanation for the overestimation of the low-porosity cases is that the proposed model fails to account for inertial drag effects. The drag force acting on the porous medium  $F_x$ can be modelled as a combination of linear and quadratic terms with respect to the velocity, and is given by the Darcy–Forchheimer equation (Whitaker Reference Whitaker1996)
 \begin{equation} F_x = \nu K^{{-}1} U_d +c_F K ^{{-}1/2} U_d \sqrt{U_d^2}, \end{equation}
where  $c_F$ denotes the Forchheimer coefficient. It is evident from the Darcy–Forchheimer equation (3.15) that the coefficient of the inertia term depends on
 $K$ and
 $c_F$. Hence both
 $K$ and
 $c_F$ are essential to account correctly for the effects of porous wall-induced drag. However, the present model does not include
 $c_F$, which drastically increases with decreasing porosity (Ergun Reference Ergun1952; Macdonald et al. Reference Macdonald, El-Sayed, Mow and Dullien1979). Therefore, further correction using
 $c_F$ may be required to extend the model to low-porosity porous media, such as gravel beds and packed spheres. Regarding the effects of porosity
 $\varphi$, it is worth noting that the DNS study for the modelled low-permeable wall by Rosti et al. (Reference Rosti, Cortelezzi and Quadrio2015) demonstrated that the effects of
 $\varphi$ and
 $K$ are quite different;
 $\varphi$ has little effect on the turbulence statistics, whereas the turbulence is affected strongly by
 $K$. This may be supported by the previous DNS study by Breugem et al. (Reference Breugem, Boersma and Uittenbogaard2006), which showed that the
 $\varphi$ gradient terms in the spatial and Reynolds-averaged momentum equations do not contribute significantly to the momentum transfer. However, because the coefficients of the Darcy–Forchheimer equation, i.e.
 $K$ and
 $c_F$, are related to
 $\varphi$ (Ergun Reference Ergun1952; Macdonald et al. Reference Macdonald, El-Sayed, Mow and Dullien1979), indirectly a decrease in
 $\varphi$ attenuates the turbulence enhancement effect (Breugem & Boersma Reference Breugem and Boersma2005; Chu et al. Reference Chu, Wang, Yang, Terzis, Helmig and Weigand2021) via a decrease in
 $K$ and an increase in
 $c_F$.
4. Conclusions
The effects of Reynolds number on permeable porous wall turbulence were studied by performing DNS of turbulent flows over a highly permeable porous medium at different friction Reynolds numbers. The porous wall comprised Kelvin cell arrays with porosity  $0.95$, and the permeability Reynolds number ranged from
 $Re_K \simeq 7$ to
 $Re_K\simeq 50$. For the porous walls, thin and thick porous substrates were studied to identify the effects of spanwise rollers associated with the Kelvin–Helmholtz (K–H) instability. We found that the effect of the K–H instability emerges for the thick porous wall; the effect of the K–H instability is more pronounced with increasing Reynolds number, and spanwise roller vortices dominate turbulence in the clear flow region when
 $Re_K \gtrsim 30$. Spanwise rollers reinforce the negative correlation between the wall-normal and streamwise velocity fluctuations close to the porous/fluid interface, and intensify the turbulent velocity fluctuations away from the porous walls, resulting in increased frictional resistance through Reynolds shear stress enhancement over the porous walls. Hence the augmentation of frictional resistance becomes more significant with increasing Reynolds number, corresponding to the dominance of the velocity fluctuations associated with the K–H instability. Once turbulence is dominated by channel height scale spanwise rollers, which is referred to as the ‘ultimate porous wall turbulence regime’ in this study, the turbulence structure and skin friction coefficient are almost unaffected by the Reynolds number.
An investigation of the Reynolds number dependence of the modified log law reveals that the zero-plane displacement and equivalent roughness height are proportional to the length scale of the porous media, regardless of the wall thickness, whereas spanwise rollers increase the von Kármán constant. For thick porous walls, the zero-plane displacement and equivalent roughness height are modelled as linear functions of the square root of the permeability. Spanwise rollers over thick porous walls increase the von Kármán constant as the Reynolds number increases, and become saturated to  $\kappa \simeq 0.6$ in the ‘ultimate porous wall turbulence regime’ at
 $Re_K>30$. The proposed model based on permeability is validated by comparing the skin friction coefficient obtained from the modified log law with the available DNS and experimental data. The proposed model reasonably predicts the skin friction coefficient for several types of porous media with high porosity. Hence, permeability is regarded as a key parameter that characterizes the logarithmic mean velocity profiles over various porous media with high porosity (
 $\varphi \ge 0.6$), although further correction using the porosity or Forchheimer coefficient may be required to extend this model to low-porosity porous media.
Acknowledgements
The authors express their gratitude to their colleague Dr M. Kaneda for his support.
Funding
This study was partly funded by a research grant (no. 21H01266) from JSPS, Japan. Numerical calculations were carried out on the TSUBAME3.0 supercomputer at the Tokyo Institute of Technology (ID: hp200031).
Declaration of interests
The authors report no conflict of interest.



