


Introduction
Health systems worldwide have faced numerous economic, political, and biological crises from recent history to the present.Reference Kvist, Seitovirta and Nurmeksela 1 , Reference Wu, Shao and Newman 2 In its Health Emergencies Report, the World Health Organization (WHO) reported that various crisis-related issues negatively impact health service delivery. 3 The International Council of Nurses (ICN) has emphasized that in times of crisis, the effective leadership of nurses and nurse managers as health care providers is as necessary as that of political and commercial leaders 4 In addition, nurses are expected to respond to the multifactorial challenges posed by a disasterReference Veenema, Losinski and Newton 5 and demonstrate a broad range of leadership behaviors in times of crisis, including caring for patients, managing infection control, and participating in emergency response planning.Reference Brewer, Hutton and Hammad 6 However, under such challenges, nurse leaders and nursing staff are forced to make quick decisions and change work schedules and procedures rapidly,Reference Turnipseed and VandeWaa 7 negatively affecting the management of nursing servicesReference Brewer, Hutton and Hammad 6 because leader, manager, and clinical nurses are challenged by the limited availability of critical resources such as beds, personnel, medicines, and equipment,Reference Tourish 8 increased number of patients needing care,Reference Kvist, Seitovirta and Nurmeksela 1 overcrowding in emergency and intensive care units or hitting hospital capacity limits in crisis situations, adding to their physical and emotional burdens.Reference Ozmen and Arslan Yurumezoglu 9 , Reference Freysteinson, Celia and Gilroy 10 There is, therefore, a indispensable need for frontline nurse leaders to overcome all challenges in crises. 4 ICN emphasizes the need for strong nurse leaders/managers in crises for the future, and crisis leadership in nursing emerges as a requirement.Reference Turnipseed and VandeWaa 7
Background
From the nursing perspective, the main crisis leadership qualities are open, fast, honest communication, a high degree of collaboration, information sharing, decision-making and fair prioritization, trust building, and competence.Reference Kim 11 These leadership qualities are critical for nurses to maintain the quality of care and safety of patients in crises, ensure team members work efficiently, keep staff morale high and prevent burnout, reinforce the emotional resilience of health professionals, and ensure the overall sustainability of health care services from acute patient care to public health systems. 4 , Reference Asgari, Panahi and Pouy 12 However, according to an integrative review study, nurse managers/leaders had low levels of leadership skills for disasters or crises.Reference Songwathana and Timalsina 13 Although some types of leadership can be useful in nursing services in times of crisis,Reference Kvist, Seitovirta and Nurmeksela 1 crisis leadership by its nature requires specific leadership characteristics.Reference Wu, Shao and Newman 2 , Reference Kim 11 Objectively determining nurse leaders/managers’ crisis leadership skills helps identify training needs for crises,Reference Loke, Guo and Molassiotis 14 ensure continuous improvement of crisis leadership skills, and develop strategies to increase their capacity.Reference Ozmen and Arslan Yurumezoglu 9 , Reference James and Bennett 15 However, few studies, including reviews or concept analysesReference Tourish 8 , Reference Kim 11 and some qualitative studiesReference Freysteinson, Celia and Gilroy 10 have discussed crisis leadership in nursing with quantitative findings using reliable measurement tools needed to support these studies.Reference Yang, Evans and Singer 16 Within the scope of crisis leadership, the literature includes the Crisis Leadership and Staff Outcomes Survey, a multidisciplinary sample of primary health care services operating during the COVID-19 pandemicReference Yang, Evans and Singer 16; The Crisis Leader Efficacy in Assessing and Deciding scale, which measures the competence of general manager populations to evaluate information and make decisions during crisesReference Hadley, Pittinsky and Sommer 17; the Crisis Leadership Model survey, which measures leaders’ competencies and employee satisfaction in coping with the COVID-19 pandemicReference Balasubramanian and Fernandes 18; the Crisis Leadership Scale, conducted with a small sample size for education and training.Reference Zhang, Zheng and Guo 19 However, none of these measurement tools are intended to assess the crisis leadership of nurse managers/leaders in hospitals. In other words, only a few scale studies were conducted in different professional groups to measure crisis leadership, with no scale study to examine crisis leadership specific to nursing. However, researchers noticed that there was a study conducted concurrently with this study in Asian culture that aimed to measure the leadership behaviors of nurse managers in crisis situations, but only a summary was presented.Reference Kim 20 This study provided a one-sided assessment and was structured around different dimensions of crisis situations than our study. There is still a gap in the literature in the search for a valid and reliable measurement tool that can provide data on nurse managers’ pre-crisis, during, and post-crisis situations—in other words, their crisis preparedness and response. The measurement tool introduced in this study can provide concrete data for identifying and developing nurse managers’ crisis leadership skills and developing training and development strategies. Another critical point is that how leaders respond to crises shapes their teams’ perceptions and influences how the organization adapts to crises.Reference Yang, Evans and Singer 16 Therefore, valid and reliable measurement tools are needed to accurately, consistently, easily, and quickly assess the crisis leadership behaviors of nurse leaders and managers during crisis preparedness and response processes.
The purpose of this study was to develop and test the psychometric properties of the “Crisis Leadership Scale for Nurse Managers (CLS-NM),” which allows determining how nurse managers see themselves as crisis leaders and how nurses who follow them evaluate their managers in terms of crisis leadership behaviors.
Methods
Developing the CLS-NM and evaluating its psychometric properties were achieved in three phases: creating the item pool, evaluating the items, and psychometric evaluation (Table 1). These phases were based on strong guidelines used in the literature for developing a new scale.Reference DeVellis and Thorpe 21 , Reference Carpenter 22
Process of scale development and evaluation of psychometric properties

Table 1. Long description
The table is divided into three sequential phases leading to a final scale.
PHASE 1: CREATING THE ITEM POOL
* Literature review and conceptual framework: Research on crisis leadership and Coombs’ Three-Stage Model were examined.
* Qualitative study: Semi-structured interviews with 6 nurses were conducted.
* Outcome: An item pool of 73 items was created.
PHASE 2: EVALUATING THE ITEMS
* Face validity: Opinions from 3 academician nurses led to 8 items being edited.
* Content validity: Expert opinions from 31 individuals were analyzed using C V I and C V R via the Lawshe technique, resulting in 32 items being removed.
* Pilot study: Face-to-face application with 50 participants led to 2 items being edited.
* Outcome: A draft scale of 41 items.
PHASE 3: PSYCHOMETRIC EVALUATION
* Construct validity: E F A (n = 760) using principal axis factoring and direct oblimin rotation resulted in 17 items being removed. C F A (n = 383) using bootstrap maximum likelihood confirmed the structure with factor loads greater than 0.70.
* Convergent and discriminant validity: A V E greater than 0.50, correlation values of 0.83, and C R greater than A V E.
* Reliability: Internal consistency (n = 383) showed Cronbach’s alpha and composite reliability greater than 0.90. Temporal stability (n = 40) showed intraclass correlation coefficients greater than 0.90.
* Outcome: A draft scale with 24 items and 2 sub-dimensions.
FINAL: The process resulted in the Crisis Leadership Scale for Nurse Managers (C L S - N M) consisting of 24 items and 2 sub-dimensions.
*Abbreviations: CFA, confirmatory factor analysis; EFA, exploratory factor analysis; M, mean; SD, standard deviation; NM, nurse manager
The study was reported in accordance with the Strengthening the Reporting of Observational Studies in Epidemiology (STROBE) statement for cross-sectional studies.
Phase 1: Creating the Item Pool
The item pool was created based on extensive literature analysis and qualitative research data.Reference Carpenter 22
Literature review and conceptual framework
Theories about crisis leadership and other developed measurement tools were examinedReference Kim 11 , Reference Yang, Evans and Singer 16 –Reference Kim 20 , Reference Coombs 23 and PubMed, Web of Science, ScienceDirect, and CINAHL databases were searched to access articles and measurement tools related to crisis leadership in nursing, using the following keywords: “crisis, crisis management, crisis leadership, nurse, nursing, scale development, instrument development, validation, reliability”. The titles and abstracts of the articles were reviewed, and those relevant to the research were identified. Then, the full texts were read, and reference lists were examined to find more articles.
In addition to these, Coombs’ Three-Stage Model, which includes pre-crisis, crisis, and post-crisis stages, was adopted as the conceptual framework for the draft scaleReference Coombs 23 (Figure 1).
Conceptual framework including Coombs’ Three-Stage Model.

Qualitative study
At this stage, interviews were conducted with 6 participants who worked in the crisis response to the COVID-19 pandemic and the earthquakes centered in Kahramanmaraş/Turkey on February 6, 2024, both of which caused crises in health care provision in Turkey in the last 5 years. The participants included a nurse (emergency room nurse, National Medical Rescue Team city supervisor), a nurse manager (coordinating care services manager of a complex city hospital in Istanbul), 2 academicians in nursing management (1 specialized in disaster, the other worked in the field in crisis response), a ward charge nurse, and a clinical care nurse.
The semi-structured interview form used for the interviews included 8 questions aiming to reveal crisis leadership behaviors before, during, and after the crisis based on nursing experiences in the crisis. The interviews were held through Zoom meetings. Data collection was terminated when the data saturation point was reached. Thematic analysis of the qualitative interviews was conducted.
The draft scale was finalized in 2 different formats: a form for follower nurses to evaluate their managers and a form for nurse managers to self-assess. The items in the draft scales were the same, with only the possessive suffixes differing, and consisted of 73 items. A 5-point Likert scale with response options ranging from 1 (strongly disagree) to 5 (strongly agree) was used.
Phase 2: Evaluating the Items
Face validity
Three academic nurses reviewed the candidate items’ relevance to the concept, clarity, and comprehensibility. Five items were revised for expression and punctuation, and 3 for semantics.
Content validity
The expert consultation was conducted in 2 phases. For the first expert opinion, 20 experts were consulted, including 12 academicians (with PhD degrees in nursing management and at least 1 article on crisis or leadership), public health nursing experts, nurse managers (in the fight against crisis), clinical nurses (patient caregivers in the fight against crisis), and measurement and evaluation/statistics experts in nursing, 2 each.
The experts rated the items using the Lawshe techniqueReference Lawshe 24, with scores of 1 = item necessary, 2 = item useful but not essential, and 3 = item unnecessary (24). Content validity ratio (CVR) and content validity index (CVI) were calculated. The critical value of CVR should be 0.50 for 20 specialists.Reference Ayre and Scally 25 Accordingly, 32 items with CVR <0.50 were removed from the scale. Then, the 41-item draft scale was presented to 11 experts for the second time, with no item removed this time. The agreement between the experts in the first and second evaluations was calculated using Kendall’s W value.Reference Kocoglu-Tanyer, Dengiz and Sacikara 26
In addition, experts were consulted for the scale’s face validity simultaneously with the content validity. Two items were edited for language and semantics. Two linguists evaluated the scale, correcting 3 items for readability and comprehensibility. As a result, the draft scale was finalized with 41 items.
Pilot study
In the pilot study, the draft scale was applied to 50 nurses/nurse managers to determine whether the scale items were understandable or answerable by the participants and to make any necessary adjustments. The nurses/nurse managers were asked to identify any items that should be removed or added and offer suggestions for improvement.Reference Seçer 27 Accordingly, feedback was received that the items in the scale were readable, understandable, simple, and practical. As a result, in the pilot application, the Cronbach’s alpha value of the scale finalized with 41 items was 0.991.
Phase 3: Psychometric Evaluation
Construct validity
The construct validity was evaluated by exploratory factor analysis (EFA) and confirmatory factor analysis (CFA). In the EFA, the adequacy of the sample size for factor analysis was evaluated by Kaiser–Meyer–Olkin (KMO) test (KMO > 0.80), and the suitability of the sample data for factor analysis was evaluated by Bartlett’s sphericity test (P < 0.05).
In EFA, the principal axis factoring method was used in the extraction of factors to determine the factor structure of the scale because the subscales in the CLS-NM were expected to be related to each other,Reference Pallant 28 and the correlation analysis of this scale showed that the subscales were moderately related (P < 0.05). Besides, the Direct Oblimin method, an oblique rotation method, was preferred in this study. The number of factors of the scale was decided based on the Scree plot and eigenvalue>1 criterion.Reference Carpenter 22 Factor load value <0.55, cross-loading (less than 0.10), and at least three items in each factor were decided according to the criteria.Reference Alpar 29 , Reference Baris, Intepeler and Unal 30
In the CFA, fit indices and standardized factor loadings were evaluated. To increase the model’s power, modification indices were examined by adding covariance between the error terms. Care was taken to ensure that modifications were made one at a time, that the number of modifications did not exceed 5 or 20% of the number of items, and that they were based on a logical foundation.Reference Hair, Black and Babin 31
Convergent and discriminant validity
In addition to CFA, construct validity was confirmed by convergent and discriminant validity. The square root of average variance extracted (AVE), composite reliability (CR), maximum squared variance (MSV), and inter-factor correlation coefficients of the scale were evaluated.Reference DeVellis and Thorpe 21
Reliability
The internal consistency of CLS-NM was evaluated by calculating Cronbach’s α coefficients, item-total score correlation, and composite reliability. The retest method was used to determine the scale’s stability against time. It was administered to 50 nurses/nurse managers with similar characteristics to the sample twice at 30-day intervals, and the intraclass correlation coefficient (ICC) was calculated.
Participants
There were 6 expert participants for the qualitative study in Phase 1 and 31 expert participants for the expert opinion in Phase 2, who were detailed previously.
The pilot study was conducted with 50 nurses/nurse managers randomly selected from the sample.
EFA and CFA were performed in different samples for Phase 3 psychometric evaluation.Reference DeVellis and Thorpe 21 EFA was conducted with 760 participants, CFA and reliability with 383 participants, and test-retest with 40 nurses/nurse managers. This scale development study was conducted with a total of 1270 participants. DeVellis and Thorpe recommend that the sample size be as large as possible.Reference DeVellis and Thorpe 21 Comrey and Lee classify sample sizes as 50 (very poor), 100 (poor), 200 (fair), 300 (good), 500 (very good), and 1,000 (excellent).Reference Comrey and Lee 32 This study was conducted with an excellent sample. However, a sample size of at least 30 is sufficient for both the pilot studyReference Whitehead, Julious and Cooper 33 and test-retest.Reference Çokluk, Şekercioğlu and Büyüköztürk 34
This study used convenience sampling, which is non-probability sampling.
Inclusion criteria: Nurses or nurse managers working at the relevant hospitals must have experienced at least one crisis (such as a natural disaster or a man-made crisis such as a pandemic, fire, or explosion) during their workday, and their participation was voluntary.
Exclusion criteria: Nurses and nurse managers who had never experienced a crisis during their workday.
During the data collection process, 1335 questionnaires were distributed to nurses/nurse managers, and 83 were returned blank. Additionally, 19 questionnaires containing incomplete information were excluded from the analysis. The study was conducted with 1233 participants.
Data Collection
This study was conducted in Ankara, the capital of Turkey, in a complex city hospital that includes 7 specialty hospitals (EFA and test-retest sample) and 2 university hospitals (CFA sample).
In the first stage, experts were consulted via e-mail to create the item pool. Before starting the psychometric evaluation, the managers of all hospitals were asked about the number of nurses in the clinics. Lists of all units were obtained, and each unit was visited. Data collection tools were divided into 2 categories for nurses and nurse managers.
After explaining the study purpose and content, data collection tools were delivered to the nurse managers (draft scale including self-assessment) and clinical nurses (draft scale to evaluate their nurse managers) volunteering to participate in the study and had at least 1 crisis experience. Besides the draft scales, there was an Information Form that inquired about age, gender, education, years of professional experience, position, and education on crisis management. The response time of the data collection tool was 10-15 minutes for each participant. Clinics were visited four days apart, and the completed forms were collected between March and May 2024.
Data Analysis
Data were analyzed with IBM SPSS V23 and AMOS V24. Participants’ characteristics and scale scores were examined using descriptive statistics (number, percentage, mean, standard deviation). The content validity of the scale items was evaluated using the Lawshe method, and CVR and CVI were calculated. Agreement between experts was assessed using Kendall’s W analysis. Corrected item-total correlation coefficients were used to assess the quality of the scale items. EFA and CFA analyses were performed for the construct validity of the scale. First, the skewness and kurtosis ranges of the items for the normal distribution were evaluated. It was determined that the observed variables in confirmatory factor analysis did not meet the assumption of multivariate normality. Therefore, model parameters were estimated using the maximum likelihood method; the bootstrap method was applied to assess the standard errors and confidence intervals of the parameter estimates more robustly. In addition to the classical chi-square test, which may be affected by a violation of the multivariate normality assumption, the overall fit of the model was assessed using the Bollen–Stine bootstrap test. A total of 5,000 bootstrap resamples were used in the analyses.Reference Bollen and Stine 35 AVE, MSV, CR, and subscale correlations were calculated for the scale’s convergent and discriminant validity. Item-total/subscale correlation and Cronbach’s alpha coefficient were used to determine the reliability of the scale. The temporal stability of the scale and ICC values were examined using the test-retest method.
Ethical Considerations
Informed written consent was obtained from all participants before the study. Additionally, the identities of all participants were kept confidential. This study was approved by the Karadeniz Technical University Health Sciences Scientific Research Ethics Committee (Number: 2023/83, Date: 25.11.2023). In addition, all necessary institutional permissions were obtained to conduct the study; Ankara City Hospital Complex (Number: E-72300690-799-237165286, Date: 19.02.2024), Hacettepe University Hospitals (Number: E-27043162-000-00003389947, Date: 20.02.2024) and Gazi University Hospital (Number: E-73050022-903.07-892586, Date: 01.03.2024). The study was conducted in accordance with the Declaration of Helsinki.
Results
Participant Characteristics
The participating nurses’ mean age was 33.38 ± 8.30 years, and the mean years of professional experience was 10.58 ± 9.13 years. 82.9% of the nurses were female, and 84.8% had bachelor’s degrees (Table 2).
Participant characteristics (n = 1233)

Table 2. Long description
The table presents data for 1233 total participants across five columns: Pilot study (n = 50), E F A (n = 760), C F A and internal consistency (n = 383), Temporal stability (n = 40), and Total participants (n = 1233). Data is reported as Mean plus or minus S D or n (%).
* Age: Total mean is 33.38 plus or minus 8.30. Groups range from 32.25 to 35.55.
* Nurse/N M experience: Total mean is 10.58 plus or minus 9.13 years.
* Sex: Total female population is 1022 (82.9%) and male is 211 (17.1%).
* Education degree: The majority hold a Bachelor’s degree (1046 or 84.8%), followed by Graduate degrees (136 or 11.1%) and High school or Associate degrees (51 or 4.2%).
* Position: 788 (63.9%) are Nurses and 445 (36.1%) are Nurse managers.
* Crisis education: 368 (29.8%) answered Yes, while 865 (70.2%) answered No.
Content Validity
The 41-item draft CLS-NM had a CVR between 0.83 and 1.00 and a CVI of 0.98. Concordance among these specialists was assessed using Kendall’s W value (Kendall’s W:0.004, p:0.986).
Construct Validity
Exploratory factor analysis
In the exploratory factor analysis, the KMO value of the 41-item draft CLS-NM was 0.98, and the Bartlett test was x² = 31792.517; P = 0.000 < 0.05. The anti-image correlation values ranged from 0.950 to 0.984.
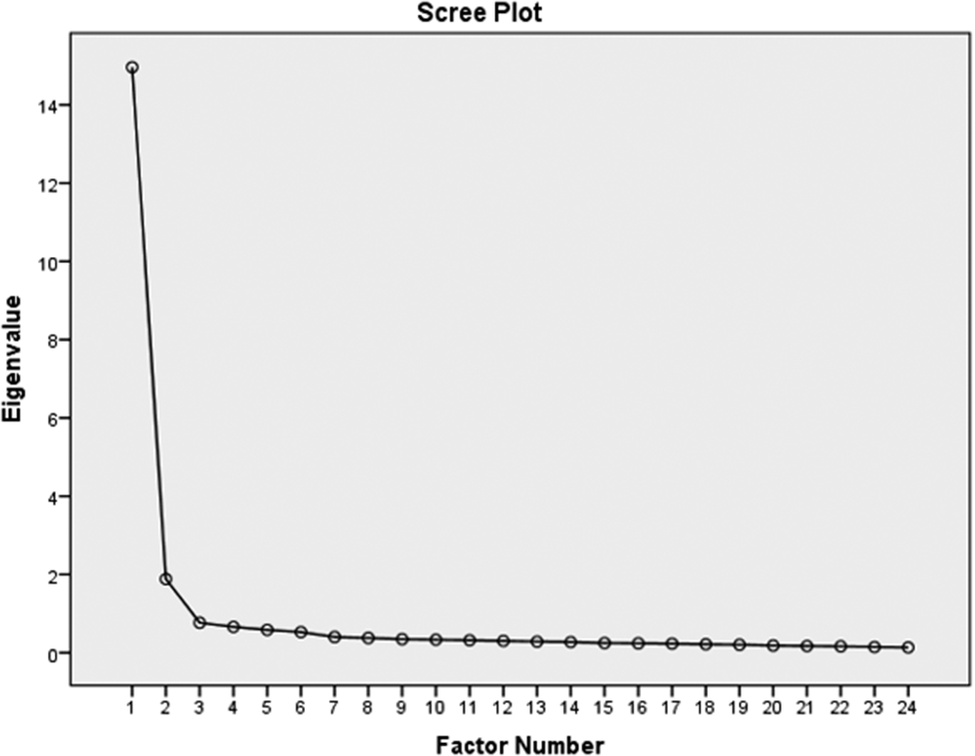
For EFA, 17 items with factor loadings below 0.55 and/or cross-loaded were removed. The scale’s pattern matrix factor loadings were between 0.593 and 0.929. In EFA, there were 2 factors with eigenvalues greater than one. The scree plot showed a break after the second factor (Figure 2). This 2-factor structure explained 67.47% of the total variance of the scale. The variance explained by the subscales was 60.99% and 6.48%, respectively. Moreover, all 24 items showed constant factor loadings of >0.74. Finally, the scale had a Cronbach’s alpha coefficient of 0.978 (Table 3).
Scree plot for exploratory factor analysis.

Figure 2. Long description
The X-axis is labeled Factor Number and ranges from 1 to 24. The Y-axis is labeled Eigenvalue and ranges from 0 to 14 in increments of 2.
Data points are represented by small open circles connected by a solid black line.
* Factor 1 has the highest eigenvalue at approximately 15.
* Factor 2 shows a sharp drop to an eigenvalue of approximately 2.
* Factor 3 drops further to just below 1.
* From Factor 4 through Factor 24, the line forms a nearly horizontal asymptotic curve, with eigenvalues gradually decreasing from approximately 0.8 toward 0.
The sharp bend or elbow in the graph occurs between Factor 1 and Factor 3.
Exploratory factor analysis of the crisis leadership scale for nurse managers (n = 760)

Table 3. Long description
The table presents primary pattern matrix factor loadings for 24 items across two factors.
Factor 1. Leading for crisis preparedness (10 items):
* Item 1: I anticipate possible crises. Loading: 0.711.
* Item 2: I set out a clear vision of possible crises. Loading: 0.822.
* Item 3: I develop emergency action plans for possible crises. Loading: 0.869.
* Item 4: I analyze the physical environment of the organization in relation to a crisis. Loading: 0.920.
* Item 5: I analyze the social environment of the organization in relation to a crisis. Loading: 0.807.
* Item 6: I take precautions for situations that pose a risk to the organization. Loading: 0.643.
* Item 7: I ensure that my team members are ready for crisis situations. Loading: 0.593.
* Item 8: I make effective planning in the crisis process. Loading: 0.638.
* Item 9: I set clear goals for combating the crisis. Loading: 0.637.
* Item 10: I set priorities in line with goals and objectives in the crisis process. Loading: 0.592.
Factor 2. Leading in crisis response (14 items):
* Item 26: I encourage my team to act in line with the desired goals and objectives during the crisis. Loading: 0.682.
* Item 27: I encourage my team members to exhibit high performance in dealing with the crisis. Loading: 0.739.
* Item 28: I create the feeling of ‘We will succeed together’ in my team members during the crisis. Loading: 0.803.
* Item 29: I create an environment where people feel safe during the crisis. Loading: 0.742.
* Item 30: During the crisis process, I receive feedback from my team members and involve them in the process. Loading: 0.738.
* Item 31: I direct my team members to the support resources they need during the crisis. Loading: 0.652.
* Item 32: I treat my team members with respect during the crisis. Loading: 0.893.
* Item 33: I act fairly toward my team members in a crisis situation. Loading: 0.929.
* Item 34: In a crisis situation, I make my team members feel that I trust them. Loading: 0.899.
* Item 35: I gain the trust of my team members with my behaviors in a crisis. Loading: 0.846.
* Item 36: I set an example for my team members with the behaviors I exhibit during the crisis. Loading: 0.851.
* Item 37: I support my team members to cope with the crisis by understanding their emotions. Loading: 0.860.
* Item 38: I appreciate the good work done in dealing with the crisis. Loading: 0.812.
* Item 39: I enable my team to learn from the crisis experience. Loading: 0.666.
Statistical Summary:
* Eigenvalue: Factor 1 is 14.63; Factor 2 is 1.55.
* Explained variance (percent): Factor 1 is 60.99; Factor 2 is 6.48.
* Cumulative variance: Factor 1 is 60.99; Factor 2 is 67.47.
Note. The scale items were translated from Turkish to English for international publication.
Confirmatory factor analysis
For CFA, 2 subscales and 24 items identified in EFA were used. To improve model fit in CFA, modification indices were evaluated for items with high covariance (Figure 3). In the final revised model, fit indices were X2/sd = 4.039, P < 0.001, GFI = 0.81, IFI = 0.92, NFI = 0.90, TLI = 0.91, CFI = 0.92, RMSEA = 0.08, RMR = 0.02, SRMR = 0.04. The standardized factor loadings of all items were statistically significant, between 0.74 and 0.91 (P = 0.000) (Table 4).
Factor structure of crisis leadership scale for nurse managers.

Figure 3. Long description
A path diagram for a confirmatory factor analysis. On the right side, two oval latent factors, F 1 and F 2, are connected by a double-headed curved arrow with a correlation value of .83.
F 1, positioned at the top right, has ten single-headed arrows pointing left to rectangular boxes labeled Item 1 through Item 10. The factor loadings range from .74 to .86.
F 2, positioned at the bottom right, has fourteen single-headed arrows pointing left to rectangular boxes labeled Item 26 through Item 39. The factor loadings range from .80 to .91.
On the far left, each Item box has a small circular error term labeled e 1 through e 24 with a single-headed arrow pointing to the item. Several error terms are connected by double-headed curved arrows indicating covariance:
* e 4 and e 5 with a value of .44.
* e 11 and e 12 with a value of .48.
* e 13 and e 14 with a value of .44.
* e 15 and e 16 with a value of .41.
* e 23 and e 24 with a value of .43.
Validity and reliability analyzes of the crisis leadership scale for nurse managers (n = 383)

Table 4. Long description
The table is divided into three main sections: Factor 1, Factor 2, and Fit Indices.
Section 1: Factor 1 (Items 1 to 10)
* Factor loadings of C F A range from 0.742 to 0.861.
* Mean values range from 4.070 to 4.270 with S D between 0.721 and 0.805.
* Aggregate metrics for Factor 1: A V E is 0.637, M S V is 0.694, C R is 0.946, and Cronbach’s alpha is 0.947.
* Item-total correlations range from 0.655 to 0.816.
Section 2: Factor 2 (Items 26 to 39)
* Factor loadings of C F A range from 0.826 to 0.915.
* Mean values range from 4.190 to 4.440 with S D between 0.775 and 0.929.
* Aggregate metrics for Factor 2: A V E is 0.745, M S V is 0.694, C R is 0.976, and Cronbach’s alpha is 0.977.
* Item-total correlations range from 0.801 to 0.861.
* The correlation between Factor 1 and Factor 2 is 0.833.
* The total Cronbach’s alpha for the scale is 0.978.
Section 3: Fit Indices for the Final Model of C L S minus N M
* X super 2 all over d f: 993.57 all over 246 equals 4.039 (Acceptable range: 3 to 5).
* G F I: 0.81 (Acceptable: greater than or equal to 0.80).
* N F I: 0.90, I F I: 0.92, T L I: 0.91, C F I: 0.92 (All meet acceptable threshold of greater than or equal to 0.90).
* R M S E A: 0.08 (Acceptable: less than or equal to 0.08).
* R M R: 0.02 and S R M R: 0.04 (Both meet good threshold of less than or equal to 0.05).
Abbreviations: CFA, Confirmatory factor analysis; AVE, average variance extracted; MSV, maximum squared variance; CR, composite reliability; CFI, comparative fit index; CI, confidence interval; df, degrees of freedom; GFI, goodness of fit index; NFI, normed fit index; IFI, incremental fit index; RMR, root mean square residual; RMSEA, root mean square error analysis; SRMR, standardized root mean square; TLI, Tucker–Lewis index; X2, chi-square
Convergent and Discriminant Validity
AVE values of the factors were 0.637 and 0.745, MSV values 0.694 and 0.694, CR values 0.946 and 0.976 for Factors 1 and 2, correlations values were 0.833 (Table 4).
Reliability Analysis
For internal consistency, Cronbach’s alpha coefficients were 0.978, 0.947, and 0.977 for the total scale, Factor 1, and Factor 2, respectively. Item total correlation coefficients were between 0.655 and 0.861 for the total scale. The results were statistically significant (P < 0.001). See Table 4 for detailed information. In addition, deleting any item did not result in an increase in Cronbach’s alpha coefficient. Therefore, the items were not deleted.
The re-test of the CLS-NM to determine temporal stability showed a statistically significant positive correlation between the first and last test scores (r = 0.856; P < 0.001). When the initial and post-test scores were compared, no statistically significant difference was found between the mean scores (Z = −2.233, P = 0.056). The total ICC value of the scale was 0.963 (F = 53,738, P < 0.001, CI: 95%) (Table 5).
Temporal stability of the crisis leadership scale for nurse managers (n = 40)

Table 5. Long description
The table contains 11 columns and 3 data rows. The columns are: Factors, r, First application Median (Min.-max.), Second application Median (Min.-max.), Z, P, I C C, C I (95%) Lower bound, C I (95%) Upper bound, F value, and P value.
* Factor 1: r is 0.865. First application median is 5.00 (4.10–5.00). Second application median is 4.95 (4.20–5.00). Z is minus 1.903. P is 0.057. I C C is 0.957. C I lower bound is 0.921 and upper bound is 0.977. F value is 46.000. P value is less than 0.001.
* Factor 2: r is 0.698. First application median is 5.00 (4.29–5.00). Second application median is 5.00 (4.29–5.00). Z is minus 1.611. P is 0.107. I C C is 0.961. C I lower bound is 0.927 and upper bound is 0.979. F value is 50.003. P value is less than 0.001.
* Total: r is 0.856. First application median is 5.00 (4.25–5.00). Second application median is 4.96 (4.25–5.00). Z is minus 2.233. P is 0.026. I C C is 0.963. C I lower bound is 0.932 and upper bound is 0.981. F value is 53.738. P value is less than 0.001.
Abbreviations: CI: Confidence interval; ICC: intraclass correlation coefficient; M: mean; r: Spearman’s rho correlation; SD: standard deviation; Z: Wilcoxon test.
Final CLS-NM
The CLS-NM was finalized with 24 items in 2 subscales: Factor 1: leading for crisis preparedness (10 items) and Factor 2: leading for responding to the crisis (14 items). The 5-point Likert-type scale is scored from (1) strongly disagree to (5) strongly agree. The scoring system depends on calculating the average scores. The average score for the CLS-NM and its subscales ranges from 1 to 5. The scores indicate a low lean level between 1.00 and 2.33, an average lean level between 2.34 and 3.66, and a high lean level between 3.67 and 5.00. Higher scores indicate that managers exhibit crisis leadership behaviors in preparing for and responding to possible crises, while lower scores indicate that they do not.
Discussion
It is argued that a measurement tool specific to nursing is necessary to identify and evaluate the crisis leadership behaviors of nurses who are frontline combatants in crisis situations.Reference Loke, Guo and Molassiotis 14 Therefore, this study developed a multidimensional CLS-NM with which nurses can evaluate their leaders/managers and leaders/managers can evaluate themselves, and tested its validity and reliability.
The CLS-NM is an easily understandable and practical scale with strong psychometric properties that nurses can use to assess their leaders and leaders to self-assess themselves in crises. It can be used to analyze nurse managers/leaders’ crisis leadership behaviors comprehensively.
Scale Contents
The CLS-NM subscales and items were prepared based on the opinions of crisis-experienced experts, models, and studies on crisis leadership in the literature.Reference Tourish 8 , Reference Freysteinson, Celia and Gilroy 10 , Reference Kim 11 , Reference Yang, Evans and Singer 16 –Reference Zhang, Zheng and Guo 19 , Reference Coombs 23
Factor 1: Leading for crisis preparedness
The items in this factor include leader behaviors that are consistent with the literature,Reference Freysteinson, Celia and Gilroy 10 , Reference Kim 11 such as being visionary, developing emergency action plans and taking measures, analyzing the physical and social environment, effective planning, and setting crisis-specific goals and objectives. These proactive behaviors that leader managers exhibit to prepare for the crisis beforehand help them to prevent the crisis or mitigate its negative effects and cope with the crisis effectively.Reference Kim 11 Therefore, as the Coombs model indicates in the pre-crisis period, it is vital for nurse leaders/managers to be ready for crises before they occur, to take measures against risks, to prepare nurses for crises, and to create a supportive environment. The items in this factor, which covers leadership behaviors in crisis preparedness, evaluate the readiness of nurse leaders/managers for crises from the perspective of crisis leadership.
Factor 2: Leading for responding to the crisis
This factor was developed as the crisis response factor of Coombs’ Three Stages Model, encompassing leader behaviors during and after the crisis.Reference Coombs 23 Empowerment of the work team and trust were the prominent concepts at this stage, highly consistent with the literature.Reference Wu, Shao and Newman 2 , Reference Freysteinson, Celia and Gilroy 10 , Reference Kim 11 Furthermore, this subscale includes behaviors such as fairness, respect, and receiving feedback, which can guide leaders and organizations through the most difficult times, including crises.Reference Kvist, Seitovirta and Nurmeksela 1 , Reference Amarat, Güneş and Güler 36 Other behaviors this subscale includes are directing the team to the sources of support they need, supporting them to cope with their emotions, and learning from the crisis, which are important for recovery during and after the crisis.Reference Freysteinson, Celia and Gilroy 10 , Reference Coombs 23 , Reference Göktepe, Güneş and Güler 37 Therefore, this subscale can comprehensively measure the response of nurse leaders/managers to the crisis.
The CLS-NM’s Psychometric Properties
In content validity, CVR and CVI values were well above acceptable values (>0.80), and the items adequately represented the construct.Reference Çokluk, Şekercioğlu and Büyüköztürk 34
For construct validity, EFA was performed to determine the scale’s factor structure, and CFA was performed to confirm the structure.Reference Carpenter 22 In EFA, the KMO coefficient and Bartlett’s sphericity test showed that the sample was appropriate and sufficient.Reference Goretzko, Pham and Bühner 38 Also, the anti-image correlation values of the CLS-NM being well above the desired minimum value (>0.70) showed that factor analysis was feasible.Reference Pallant 28 The total variance explained by the CLS-NM, which was shaped by 2 subscales in the EFA, was above the values recommended in the literature for multidimensional scales (50-60%).Reference Goretzko, Pham and Bühner 38 The variance explained by the subscales accounted for at least 5% of the total variance, as recommended.Reference Seçer 27 The majority of the factor loadings of the items of the CLS-NM being >0.70 in the EFA showed that the structure was well explained.Reference Alpar 29
In the CFA, the CLS-NM model fit indices showed acceptable or good fit.Reference Seçer 27 Only the GFI value was close to the acceptable limit. According to Tabachnick et al., the majority of model indices in CFA being in fit validates the structure.Reference Tabachnick and Fidell 39 Furthermore, the standardized factor loadings of the items in the CLS-NM were quite high compared to the literature.Reference Alpar 29 The convergent and discriminant validity results of CLS-NM were also well above acceptable values.Reference DeVellis and Thorpe 21 The results showed that validity was achieved in CLS-NM.
Reliability analyses of the CLS-NM after CFA were evaluated with item total and subscale correlation coefficients for internal consistency, Cronbach’s alpha coefficient, and temporal stability with the retest method.Reference DeVellis and Thorpe 21 According to Pallant 2023, Cronbach Alpha coefficient >0.80 should be preferred for good internal consistency in Likert-type scales.Reference Pallant 28 The high Cronbach’s alpha coefficient of CLS-NM in total and subscales proved the internal consistency of the scale. Also, item total and subscale correlation values for CFA were well above acceptable values in this study.Reference DeVellis and Thorpe 21 These results proved that the CLS-NM is reliable, and its items are homogeneous and discriminative. Finally, the correlation coefficient of >0.70 in the results obtained with the re-test analysis and the ICC results showed that the scale had an acceptable level of stability.Reference Alpar 29 These results proved that the CLS-NM is a valid and reliable measurement tool.
The CLS-NM provides accurate and consistent data on specific crisis leadership behaviors to be exhibited in crisis situations. It can serve as a potential reference for nurses to evaluate their leaders and for nurse leaders/managers to assess and develop themselves for future crises. In managing crises, nurse leaders/managers can evaluate the expectations of the nurses they lead. The scale can be used to identify gaps and develop training programs to improve nurse leaders/managers’ preparedness for crisis situations and their ability to respond effectively. Additionally, self-assessment using this scale can contribute to the development of individual interventions. The data collected with this scale can also support the development of strategies for nurturing strong crisis leader nurses and improving institutional goals and policies for crisis management. CLS-NM allows cross-cultural comparisons of crisis leadership behaviors exhibited by nurse leaders/managers in different countries/cultures regarding crisis preparedness and response. Finally, CLS-NM can be used as a measurement tool in analytical and experimental research.
Limitations
The results of the psychometric analysis of the CLS-NM are limited to the statements of nurses and nurse managers working in nine hospitals in the capital of Turkey. Also, criterion validity was not performed in this study. Although attention was paid to the distribution of nurses and nurse managers in all stages of the study, this distribution may not be one-to-one because there are not as many nurse managers or leaders as there are nurses in hospitals. However, the previous sections support the finding that enough nurse managers/leaders were reached to conduct this study. Limited to 2 dimensions of leadership in crisis preparedness and responding, the scale can be analyzed in larger and more diverse samples.
Conclusion
The CLS-NM is a simple, easy-to-understand, and practical scale with strong psychometric properties that allows nurse followers to assess their managers and leaders and allows them to self-assess. It can be used to comprehensively analyze nurse managers’ crisis leadership behaviors for crisis preparedness and response. Comprising 24 items, the CLS-NM measures leadership behaviors of nurse managers in crisis situations through two subscales: leading for crisis preparedness and leading for responding to the crisis. The scale can be used to identify gaps and develop training programs to improve nurse leaders/managers’ preparedness for crisis situations and their ability to respond effectively. Additionally, self-assessment using this scale can contribute to the development of individual interventions. The data collected with this scale can also support the development of strategies for nurturing strong crisis leader nurses and improving institutional goals and policies for crisis management.
Supplementary material
The supplementary material for this article can be found at http://doi.org/10.1017/dmp.2026.10439.
Acknowledgments
The authors thank all nurses and nurse managers who participated in the study.
Author contribution
Made substantial contributions to conception and design, or acquisition of data, or analysis and interpretation of data: ÇTK, HÖ, SD, GA. Involved in drafting the manuscript or revising it critically for important intellectual content: ÇTK, HÖ, SD, GA. Given final approval of the version to be published. Each author should have participated sufficiently in the work to take public responsibility for appropriate portions of the content; ÇTK, HÖ, SD. Agreed to be accountable for all aspects of the work in ensuring that questions related to the accuracy or integrity of any part of the work are appropriately investigated and resolved: ÇTK, HÖ, SD.
Funding statement
None.
Competing interests
None.
AI tool usage notification
The graphical summary of this article was generated using the ChatGPT tool.




 Open access

