I. INTRODUCTION
Flexible substrates for electronic devices enable applications that require large area or nonplanar form factors, for example, wearable medical devices,Reference Khan, Ostfeld, Lochner, Pierre and Arias1 curved displays,Reference Choi, Kim and Ha2 sensors molded in automobile bodies, or imagers on missiles’ nose cones. When used as a flexible substrate, not only do shape memory polymers (SMPs) provide mechanical flexibility to an electronic device, they have the unique capability to return to their original as-fabricated shape upon the application of an external thermal stimulus.Reference Zhao, Qi and Xie3 These properties allow for the fabrication of implantable medical devices, such as neural interfaces,Reference Ware, Simon, Hearon, Liu, Shah, Reeder, Khodaparast, Kilgard, Maitland, Rennaker and Voit4 that are rigid and planar during room-temperature processing, yet can conform to body tissue’s three-dimensional shape and mechanical softness upon implantation.Reference Reeder, Kaltenbrunner, Ware, Arreaga-Salas, Avendano-Bolivar, Yokota, Inoue, Sekino, Voit, Sekitani and Someya5 Thermoset thiol–ene/acrylate SMPs can withstand higher processing temperatures, above 250 °C,Reference Gutierrez-Heredia, Rodriguez-Lopez, Garcia-Sandoval and Voit6 than many conventional polymer substrates such as PET (maximum of 150 °C),Reference MacDonald7 yet have better transparency than high temperature polyimide substrates.Reference Choi, Kim and Ha2 Their low residual strain upon thermal cycling allows thermoset SMP substrates to retain their original dimensions after each thermal cycle,Reference Voit, Ware, Dasari, Smith, Danz, Simon, Barlow, Marder and Gall8 which is beneficial for processing of large-area circuitry where precise alignment of patterned features across large lateral distances is required. Vacuum deposited metal oxide thin film transistors (TFTs) patterned and annealed by traditional methods have been demonstrated on these substrates.Reference Gutierrez-Heredia, Rodriguez-Lopez, Garcia-Sandoval and Voit6 To take full advantage of low cost, large area, and high throughput manufacturing on these substrates, it is necessary to further develop nonvacuum, solution-based oxide thin films that are compatible with roll-to-roll processing. These films must also demonstrate electronic properties comparable to those achieved by conventional vacuum-based processes. This work demonstrates the first example of low-temperature solution-processing of oxide TFTs on SMP substrates, which achieve excellent performance.
The first challenge to overcome is the incompatibility of traditional thermal processing of solution-deposited oxide films with the thermal budget of the polymer substrates. Conventional solution deposition methods such as sol–gel processing typically require high calcination temperatures (∼400 °C for amorphous alumina)Reference Fu, Cao and Zhu9–Reference Brinker and Scherer11 to complete the conversion of precursor films to metal oxides. These temperatures are much higher than the degradation temperatures even for the most temperature-tolerant polymers such as polyarylate (325 °C) and polyimide (350 °C).Reference Choi, Kim and Ha2 Recent research efforts aiming to reduce the required annealing temperature generally fall into two categories: (i) Solution combustion synthesis incorporates a fuel (such as urea or acetylacetone) and an oxidizer (NO3−) into the precursor solution, providing chemical energy to the precursor film and lowering the external temperature required for oxide formationReference Liu, Zhu, Guo, Meng and Liu12–Reference Wang, Yu, Guo, Huang, Zeng, Zhou, Chi, Bedzyk, Chang, Marks and Facchetti14; (ii) Exposure to a UV lampReference Tetzner, Lin, Regoutz, Seitkhan, Payne and Anthopoulos15–Reference Hwang, Seo, Jeon and Bae17 or laser,Reference Dellis, Isakov, Kalfagiannis and Tetzner18 or annealing in the presence of a microwave fieldReference Jun, Song, Jeong, Woo, Kim, Bae and Moon19 provides energy from electromagnetic waves, rather than thermal energy, to help overcome the oxide formation barrier. With these methods, oxide electronic devices have been successfully made on polymer substrates.Reference Kim, Heo, Kim, Park, Yoon, Kim, Oh, Yi, Noh and Park16,Reference Park, Kim, Jo, Sung, Kim, Lee, Kim, Kim, Yi, Kim, Yoon and Park20,Reference Park, Desai, Salleo and Jimison21
Even with oxide processing temperatures below the degradation temperature of the polymer substrate, the mechanical property mismatch between oxides and polymers presents an additional challenge. When unpatterned sol gel films are annealed on polymer substrates, the difference between the large coefficient of thermal expansion (CTE) of the substrateReference Ware, Simon, Arreaga-Salas, Reeder, Rennaker, Keefer and Voit22 and that of the oxide results in extensive cracking of the oxide film.Reference Daunis, Gutierrez-Heredia, Rodriguez-Lopez, Wang, Voit and Hsu23 Common polymer substrates, such as PET, have a CTE of 15 ppm/°C.Reference MacDonald7 Using a CTE value of 5 ppm/°C for oxides, the strain mismatch upon heating from 25 °C to 250 °C is 0.2%. The strain mismatch added to the brittle nature of oxide materials leads to extensive cracking when annealing large-area solution-deposited oxide films on polymer substrates. This issue does not occur in vacuum deposition of films because the films are deposited at room or low temperature and patterned by conventional photolithography—depositing photoresist, soft baking, UV patterning, developing, etching, and removing photoresist—to small areas before post-annealing (activating) at higher temperature. Because stress is released at the edges of the patterned features, cracks are not observed in vacuum deposited oxide films on SMP.Reference Gutierrez-Heredia, Rodriguez-Lopez, Garcia-Sandoval and Voit6 Thus, it is desirable to pattern the sol–gel precursor films prior to annealing to form oxides. This becomes an issue for solution-deposited films since precursor films are readily soluble in many common solvents and are easily attacked by acidic and basic solutions, making it impossible to pattern these films by conventional photolithographic techniques. Additive printing techniques such as ink-jet printing can accomplish patterned precursor film deposition,Reference Lee, Chang and Herman24 but suffer from throughput limitations due to the serial nature of the deposition. The ability to pattern combustion precursor oxide films by exposure to a UV light source through a shadow mask has been previously demonstrated.Reference Rim, Chen, Liu, Bae, Kim and Yang25 By modifying this method, we successfully overcome the challenges of fabricating TFTs using a solution process on SMP substrates for the first time by patterning different metal oxide precursor films at room temperature and subsequently annealing at higher temperatures to form oxide dielectric and semiconductor films.
II. EXPERIMENTAL SECTION
A. SMP substrate fabrication and characterization
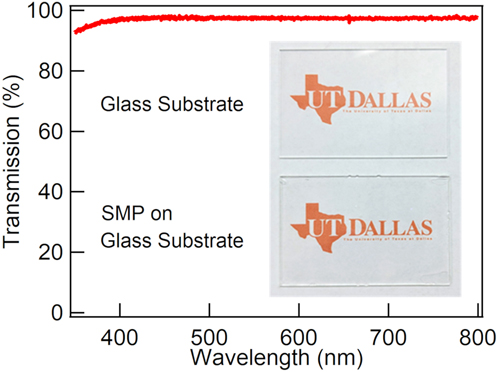
To make 50 μm thick thermoset thiol–ene/acrylate SMP films, tricyclodecane dimethanol diacrylate (TCMDA), 1,3,5-triallyl-1,3,5-triazine-2,4,6(1H,3H,5H)-trione (TATATO), and 2,2-dimethoxy-2-phenyl acetophenone (DMPA) are purchased from Sigma-Aldrich (St. Louis, MO) and tris[2-(3-ercaptopropionyloxy)ethyl] isocyanurate (TMICN) is purchased from Wako Chemicals USA, Richmond, VA. 0.015 g of DMPA is first mixed with 3.58 g of TATATO, followed by the sequential addition and mixing of 3.92 g TCMDA and 7.53 g TMICN. The solution is spin coated onto a substrate at 700 rpm for 60 s. The film is then cured under 254 nm UV illumination for 2 min followed by 365 nm UV for 60 min. The substrate is ready to use after being placed in a vacuum oven at 70 °C overnight. The optical transmission spectrum of SMP is shown in Fig. 1 for a 50 µm film deposited on glass. The photograph in the inset of Fig. 1 shows that SMP is colorless and has >97% transmission between 400 and 800 nm. For fabricating TFTs, SMP films are deposited on Si substrates, which provide good thermal conduction to the oxide layers when annealing on a hotplate. A SiO2/SiN (20 nm SiO2, 800 nm SiN) layer is deposited on SMP substrates by plasma-enhanced chemical vapor deposition at 225 °C prior to device fabrication. This layer serves to promote adhesion of the solution-deposited metal oxides to the substrates, as well as to act as a buffer layer to absorb the thermal stress due to CTE mismatch between oxide films and polymer substrates. A 0.005″ thick invar mask is placed on top of the sample to define the bottom contacts. A magnet beneath the sample holds the mask in place and 100 nm of Al are deposited by thermal evaporation.
Transmission spectrum of a 50 µm SMP substrate on glass slide. Transmission is >97% from 400 to 800 nm. Inset: photographs of blank glass slide (top) and glass slide with SMP (bottom).

B. TFT fabrication
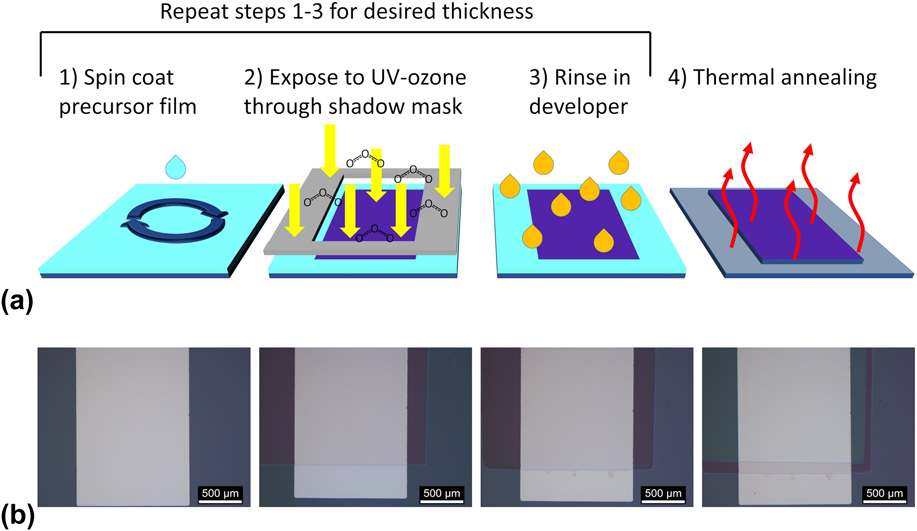
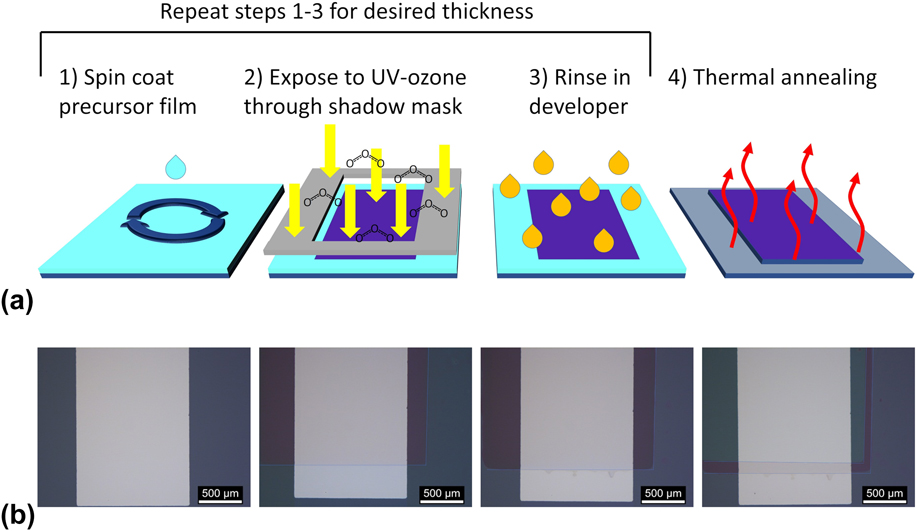
To make oxide films, all chemicals are purchased from Alfa Aesar and used as received. Al2O3 precursor solution is prepared by dissolving Al(NO3)3·9(H2O) in 2-methoxyethanol (MOE) to form a 0.4 M solution. The solution is stirred in an uncapped vial on a hotplate at 110 °C overnight to evaporate most of the excess water introduced with the metal nitrate. Fresh MOE is added to the solution to make up the lost volume, and the solution is stirred for another 20 min before being filtered through a 0.2 µm filter. To form a patterned film, the precursor solution is first spin coated onto the SMP substrate with a patterned Al gate at 3000 rpm for 30 s as shown in step 1 of Fig. 2(a). The sample is then placed on a hotplate at 80 °C for 2 min to dry the film. In step 2, an invar mask is held in place by a magnet to define the gate dielectric pattern, and the device is exposed to UV-ozone (UVO, Bioforce Nanosciences Procleaner Plus, Bioforce Nanosciences, Salt Lake City, UT) through the mask at room temperature for 40 min. To remove the undeveloped portions, the film is rinsed in a developing solution of acetic acid (1 mL) and DI water (5 mL) in methanol (15 mL) for 10 s and immediately rinsed in DI water and dried by a N2 stream (step 3). Steps 1–3 are then repeated to ensure a pinhole free film of the desired thickness (80 nm). In step 4, the sample is placed on a hotplate at 80 °C and the hotplate temperature is increased at a rate of 10 °C/min until the surface of the sample reaches 250 °C as measured by using a thermocouple. This temperature is held for 20 min and the hotplate is turned off and the sample was allowed to cool to room temperature. Figure 2(b) shows optical images after each of the steps during the deposition of two coats of Al2O3 gate dielectric on top of an Al gate, resulting in a crack-free patterned oxide film on an SMP substrate.
Photochemical self-patterning of oxide films from sol–gel precursors. Blanket deposition (step 1), photopatterning (steps 2 and 3), and annealing (step 4) of sol–gel precursor films. (a) Schematic of the process for forming patterned oxide films. (b) Optical images of the film after corresponding processing step in (a). Dashed lines are drawn to show boundaries of patterned oxide feature.
In2O3 is deposited by a similar procedure [Fig. 2(a)] using a 0.1 M concentration of In(NO3)3·3(H2O) in MOE and the addition of 0.1 M acetylacetone (acac) and 0.1 M ammonium. The solution is stirred overnight at room temperature before use. Since the In2O3 precursor contains combustion fuel, we found that a UVO exposure of 10 min is sufficient to form a pattern that can withstand the developing solution. The final annealing temperature is varied between 150 and 250 °C. The total In2O3 film thickness is 13–15 nm depending on the final annealing temperature.
After deposition and annealing of Al2O3 and In2O3, metal-insulator-metal (MIM) capacitors and TFT devices are completed by defining a 400 × 400 µm top contact or source-drain contacts with a 100 × 1000 µm channel, respectively, by thermal evaporation of 100 nm Al through a shadow mask.
C. Materials and device characterization
Oxide layer thicknesses are determined by ellipsometry of films deposited on Si measured from 280 to 1690 nm at 55°, 65°, and 75° (J.A. Woollam, Lincoln, NE, M2000DI) and fit using a B-spline model. X-ray diffraction (XRD) spectra are taken at grazing incident angle (0.5°) using a Rigaku Ultima III diffractometer (Rigaku, Tokyo, Japan) with Cu Kα radiation (λ = 1.5418 Å) at an operating voltage/current of 40 kV/44 mA. Atomic force microscopy (AFM) is performed in tapping mode (Asylum Research, Goleta, CA, MFP-3D). UV-vis spectrometry (Ocean Optics, Largo, FL, USB 4000) is measured from 178 to 890 nm. SMP absorption is referenced to the bare glass substrates. Metal-oxide precursor solutions are diluted by 1000× and the absorption is referenced to pure 2-MOE in a quartz cuvette with a 1 cm path length. X-ray photoelectron spectroscopy (XPS) is performed on a Ulvac-PHI VersaProbe2 (Ulvac-PHI, Chigasaki, Japan) with a monochromated Al Kα source (1486.8 eV) at an angle of 45° to the sample surface with an energy step of 0.2 eV and a pass energy of 23.5 eV. XPS data are analyzed using commercial software (MultiPak, Ulvac-PHI, Chigasaki, Japan). Fourier transformed infrared (FTIR) spectra are measured using a Nicolet iS50 FT-IR (Thermo Fisher Scientific, Waltham, MA) from 450 to 6000 cm−1 under N2 purge.
Electrical measurements are performed in air in a Cascade Microtech probestation. Capacitance versus frequency is measured at a DC bias of 0 V and AC bias of 50 mV from 20 Hz to 300 kHz on an Agilent 4284A Precision LCR Meter (Agilent Technologies, Santa Clara, CA). The capacitor area is defined by the top contact at 0.0016 cm2. Transfer and output curves of the TFTs are measured on a Keithley 4200 (Keithley Instruments, Cleveland, OH) semiconductor characterization system.
III. RESULTS AND DISCUSSION
A. Chemical studies of photochemical processing
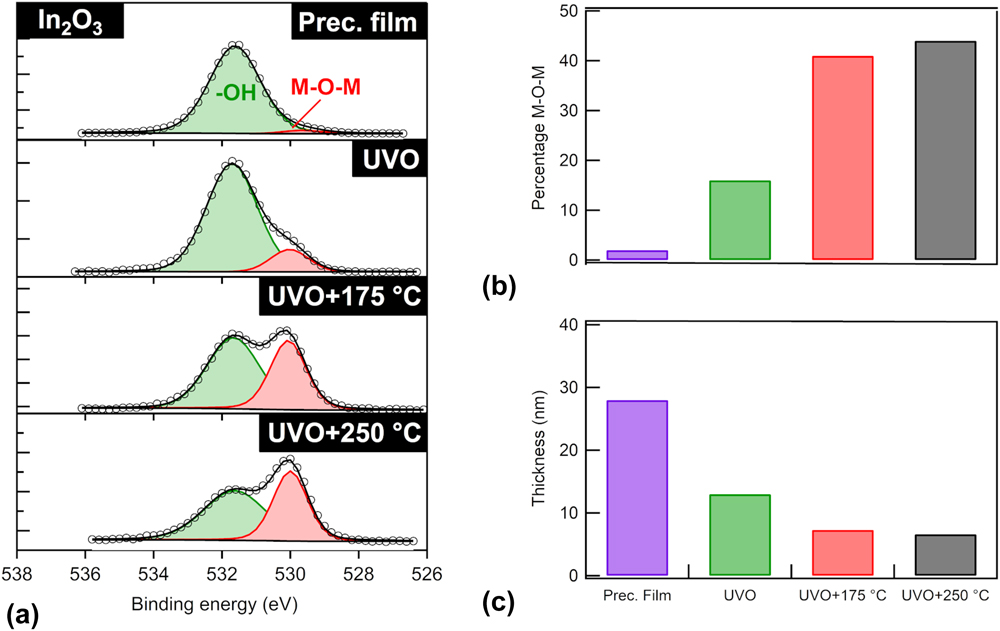
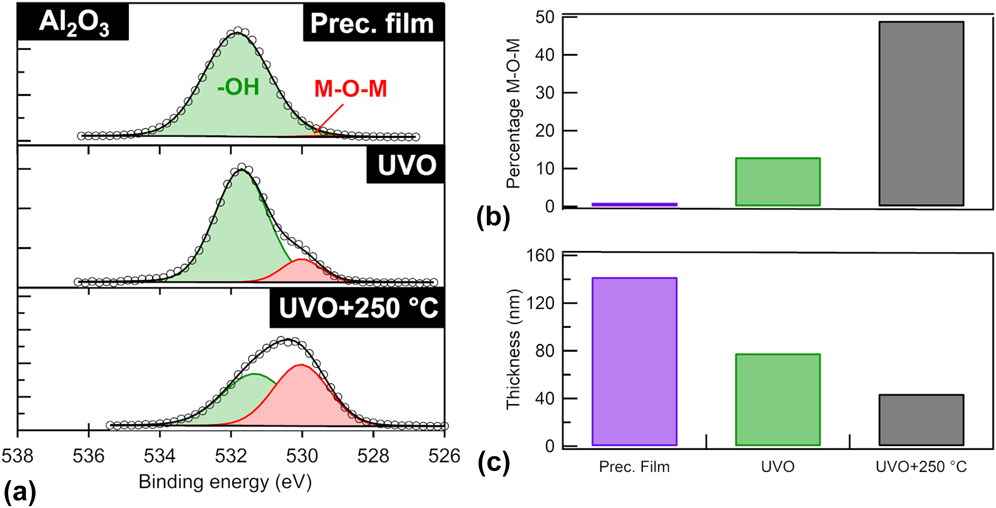
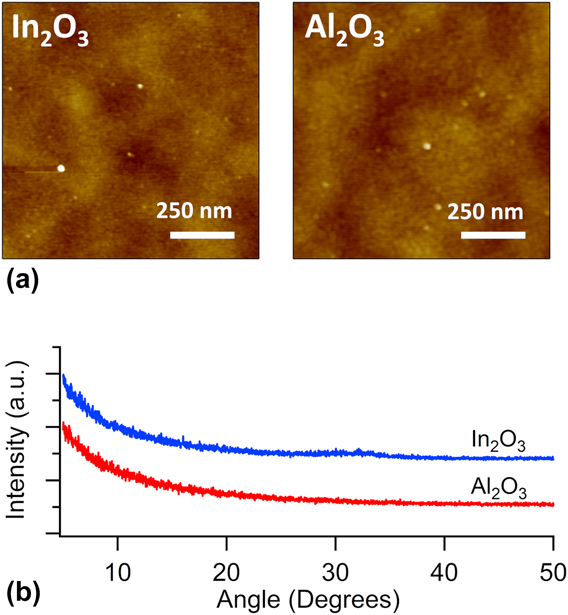
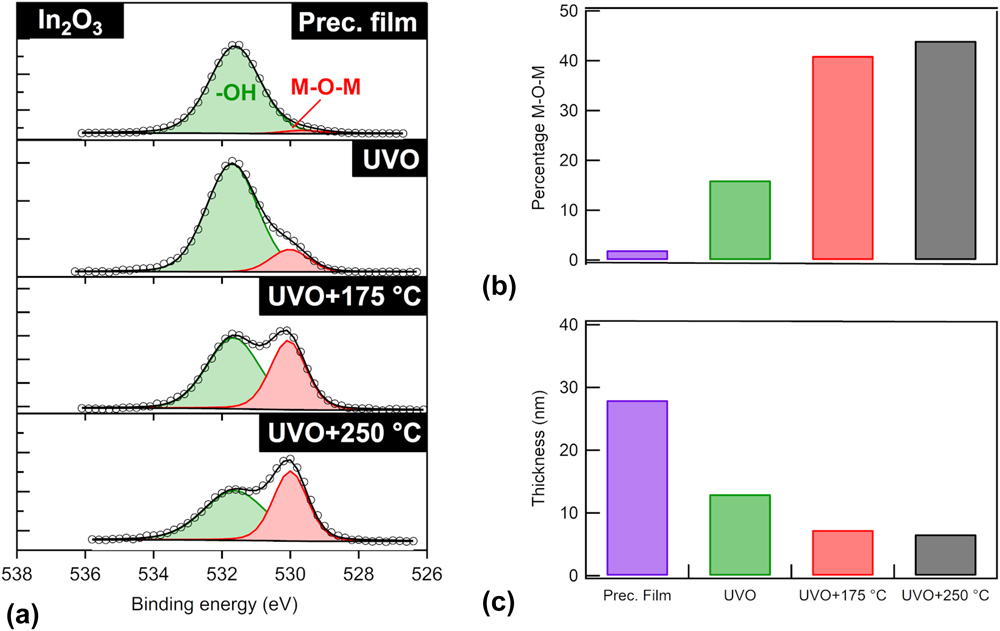
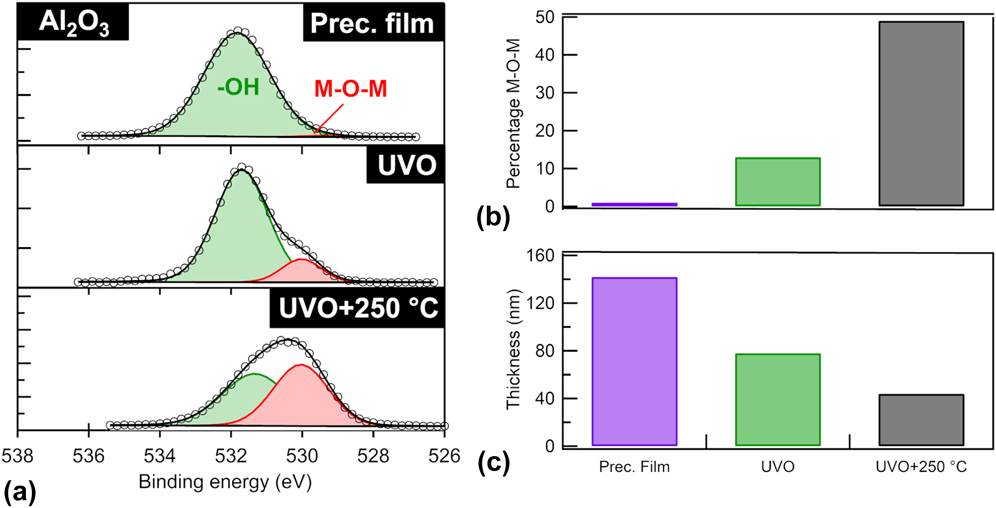
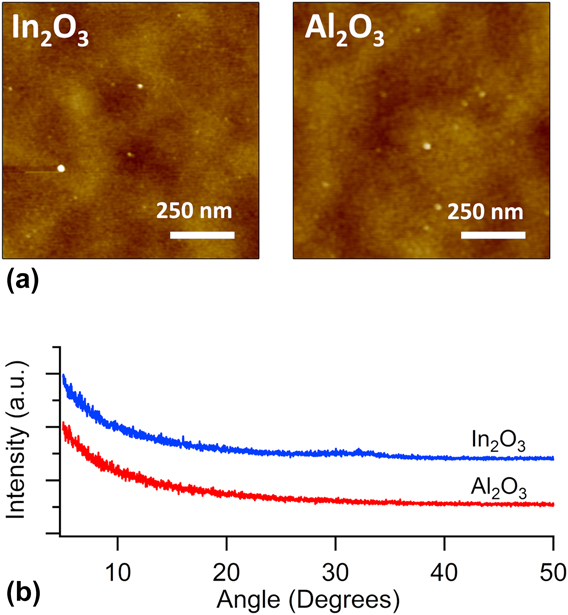
To better understand the photochemical patterning and thermal annealing in the oxide conversion, film thickness and XPS spectra of the O1s binding energy for In2O3 [Fig. 3] and Al2O3 [Fig. 4] are measured at several stages during the film formation process. The O1s signal in the XPS spectrum can be deconvoluted into two peaks, one at 530.0 eV which is attributed to oxygen in the metal oxide lattice (M–O–M) and one at 531.6 eV which is attributed to oxygen in hydroxide species (–OH).Reference Tetzner, Lin, Regoutz, Seitkhan, Payne and Anthopoulos15,Reference Park, Kim, Jo, Sung, Kim, Lee, Kim, Kim, Yi, Kim, Yoon and Park20,Reference Jo, Kim, Kim, Kang, Kim, Kim, Ko, Kim and Park26 The M–O–M peak in Fig. 3(a) is minimal for a dried In2O3 precursor film, 2% of the total O1s signal [Fig. 3(b)]. For dried Al2O3 precursor film, the M–O–M component is 1% of the total O1s signal [Figs. 4(a) and 4(b)]. Nearly all the oxygen signal at this stage of processing is from the –OH species. After UVO exposure, the M–O–M peak dramatically increases by 8-fold to 16% of the O1s signal for In2O3 and by 12-fold to 12% for Al2O3. Due to the M–O–M network formation, a decrease in solubility of the film in a weakly acidic solution ensues, allowing for development of the film pattern (ellipsometry shows no thickness change with rinsing in developing solution). UVO exposure also reduces the thickness of the films by about 50%, from 28 nm for the In2O3 precursor film to 13 nm after UVO [Fig. 3(c)], and from 142 nm for the Al2O3 precursor film to 78 nm after UVO [Fig. 4(c)]. The thickness reduction is attributed to both the decomposition of metal nitrates and removal of residual solvent, leading to the densification of the film with increasing M–O–M bonding. Subsequent thermal annealing of UVO exposed regions further increases the M–O–M peak as the metal–oxygen network continues to form. The M–O–M signal increases to 41% of the total O1s signal for In2O3 films annealed at 175 °C, to 44% for those annealed at 250 °C [Fig. 3(b)], and to 48% for Al2O3 annealed at 250 °C. Correspondingly, the oxide film thickness decreases to 7.3 nm at 175 °C and to 6.6 nm at 250 °C for In2O3 [Fig. 3(c)], and to 44 nm for Al2O3 annealed at 250 °C [Fig. 4(c)], as the films densify at the higher annealing temperatures. Note that the XPS and ellipsometry studies used one coat of sol gel films; hence, the thicknesses are half of the films used in the devices below. XRD [Fig. 5(a)] and AFM [Fig. 5(b)] measurements of films annealed at 250 °C show that the oxide films remain amorphous with a smooth surface.
XPS and ellipsometry of In2O3 films during processing. (a) O1s spectra with deconvoluted metal oxide lattice (M–O–M) peaks and hydroxide (–OH) peaks for the dried In2O3 precursor film, In2O3 precursor film exposed to UVO for 10 min, and UVO-exposed In2O3 film then annealed at 175 and 250 °C. (b) Bar graphs showing the (M–O–M) peak contribution and (c) thickness from ellipsometry at specified processing stage.
(a) XPS O1s spectra of the dried Al2O3 precursor, Al2O3 film exposed to UVO for 40 min, and exposed Al2O3 film annealed at 250 °C showing deconvoluted M–O–M and –OH peaks. (b) Percentage of XPS O1s signal from M–O–M peak. (c) Ellipsometry thickness of the film at each processing stage.
(a) Tapping mode AFM images of In2O3 (left) and Al2O3 (right) films from the transistor device annealed at 250 °C showing low surface roughness: rms roughness for In2O3 is 0.40 nm and for Al2O3 is 0.42 nm. The scale bars represent 250 nm and the full color scale represent 10 nm height variation. (b) Grazing angle XRD spectra for In2O3 (top) and Al2O3 (bottom) films annealed at 250 °C showing an amorphous film structure.
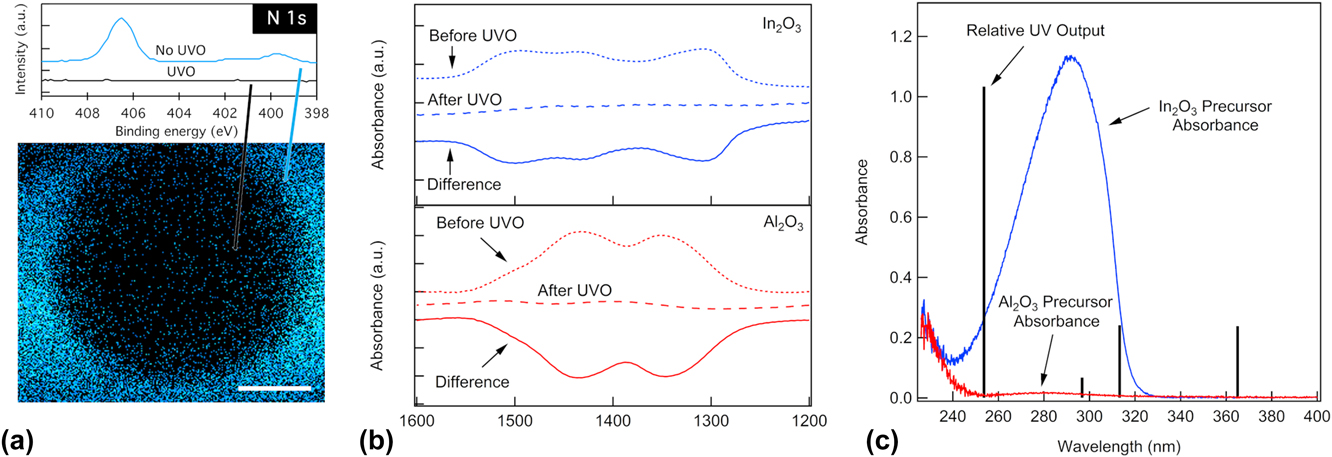
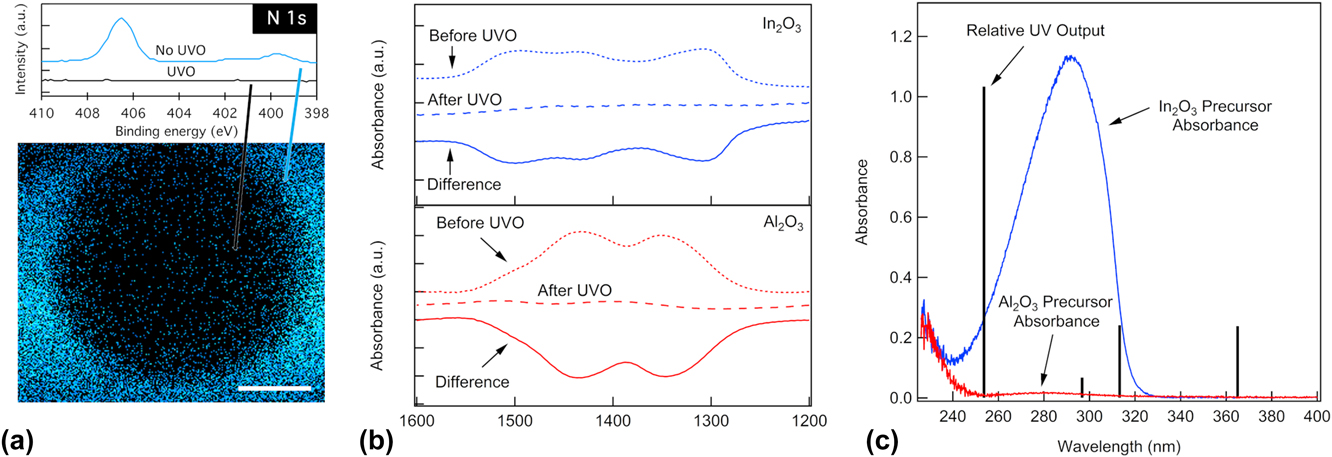
During the UVO exposure, in addition to the conversion of M–O–M network and densification of the film, nitrates from the metal precursors are removed. Figure 6(a) shows a map of the N1s signal intensity at 406.5 eV (NO3−)Reference Honda and Hirokawa27,Reference Baltrusaitis, Jayaweera and Grassian28 performed on an In2O3 precursor film exposed to UVO through a shadow mask. Nitrates remain in the unexposed portion of the film outside of the circular pattern (top spectrum) and are removed from the exposed portion (bottom spectrum). The loss of nitrates observed in XPS is also corroborated by FTIR spectroscopy in the N–O vibration region before and after UVO exposure [Fig. 6(b) for In2O3 and Fig. 6(c) for Al2O3]. It is evident that nitrate is decomposed in both In2O3 and Al2O3 precursor films and the oxide conversion has begun. This is consistent with a reaction mechanism where nitrate ions absorb UV light, decompose, and produce oxygen and nitrogen dioxide radicals that assist in the M–O–M bond formation.Reference Hwang, Lee, Jeong, Lee, Pearson, Petty and Kim29 As stated in Sec. II, In2O3 precursor includes a fuel (acac) but Al2O3 precursor does not. This is because of the larger thickness required for the Al2O3 dielectrics. Using the combustion synthesis precursor formulation, thin (<20 nm) In2O3 semiconductor films can be formed with high quality by depositing and patterning two coats of precursors [Fig. 2(a)] followed by a single thermal annealing step (175–250 °C). However, for thicker films, the inclusion of a fuel results in high porosity due to the release of gaseous combustion by-products during annealing.Reference Yu, Smith, Zhou, Zeng, Guo, Xia, Alvarez, Aghion, Lin, Yu, Chang, Bedzyk, Ferragut, Marks and Facchetti30 For the Al2O3 dielectric layer, which needs to be thick (∼80 nm) to ensure low gate leakage current for TFT operation, it would be necessary to deposit as many as 8 or more coats and to anneal after every 1 to 2 coats if a combustion precursor formulation were used.Reference Rim, Chen, Liu, Bae, Kim and Yang25 To minimize the laborious processing, acac is not added to the precursor for the Al2O3 dielectric, allowing for thicker films of ∼40 nm per coat to be deposited twice, followed by a single annealing step at 250 °C.Reference Daunis, Gutierrez-Heredia, Rodriguez-Lopez, Wang, Voit and Hsu23 From XPS and FTIR results shown above, a similar extent of M–O–M bond formation and nitrate removal can be achieved, except that the Al2O3 films not containing acac require four times longer UVO exposure than that required for In2O3 films with acac. The absorption spectra of the precursor solutions [Fig. 6(c)] show that while both nitrate and acac absorb in the UV, the latter increases the absorption at 253.7 nm, the dominant wave length of the mercury-vapor lamp, by a factor of 26. Additionally, the strong absorption peak seen at shorter wavelengths in Fig. 6(c) (<240 nm) for both In2O3 and Al2O3 precursors is attributed to nitrate ions and likely continues to increase at wavelengths below the detection capabilities of the UV-vis measurement. The additional output by the Hg lamp at 184 nm (not shown) is expected to be absorbed by nitrates in both precursors.Reference Hwang, Lee, Jeong, Lee, Pearson, Petty and Kim29 Hence, acac is not necessary for M–O–M bond formation [Figs. 3 and 4], although it accelerates the conversion reaction by increasing UV absorption.Reference Rim, Chen, Liu, Bae, Kim and Yang25 Very recently, similar UV patterning of sol gel precursor films was demonstrated on rigid substrates using specially synthesized compounds as both metal oxide precursors and UV absorbers.Reference Sanctis, Hoffmann, Bruns and Schneider31 Here, we show that direct photochemical patterning on flexible substrates can be effectively performed using commercially available chemicals.
(a) XPS map of N1s signal intensity surrounding a single 600 µm diameter UVO exposed circle on an In2O3 film. Scale bar is 200 µm. Top: N1s spectra for the unexposed precursor area (blue, top) and UVO exposed area (black, bottom). (b) N–O vibration region of FTIR spectra before and after UVO annealing for (top) an In2O3 film and (bottom) an Al2O3 film. The loss of absorbance from 1250 to 1550 cm−1 in the differential spectrum indicates the removal of nitrates from the film. (c) UV-vis of In2O3 (blue) and Al2O3 (red) precursor solutions with vertical bars representing the normalized output of the Hg vapor UV lamp.
B. Device characteristics
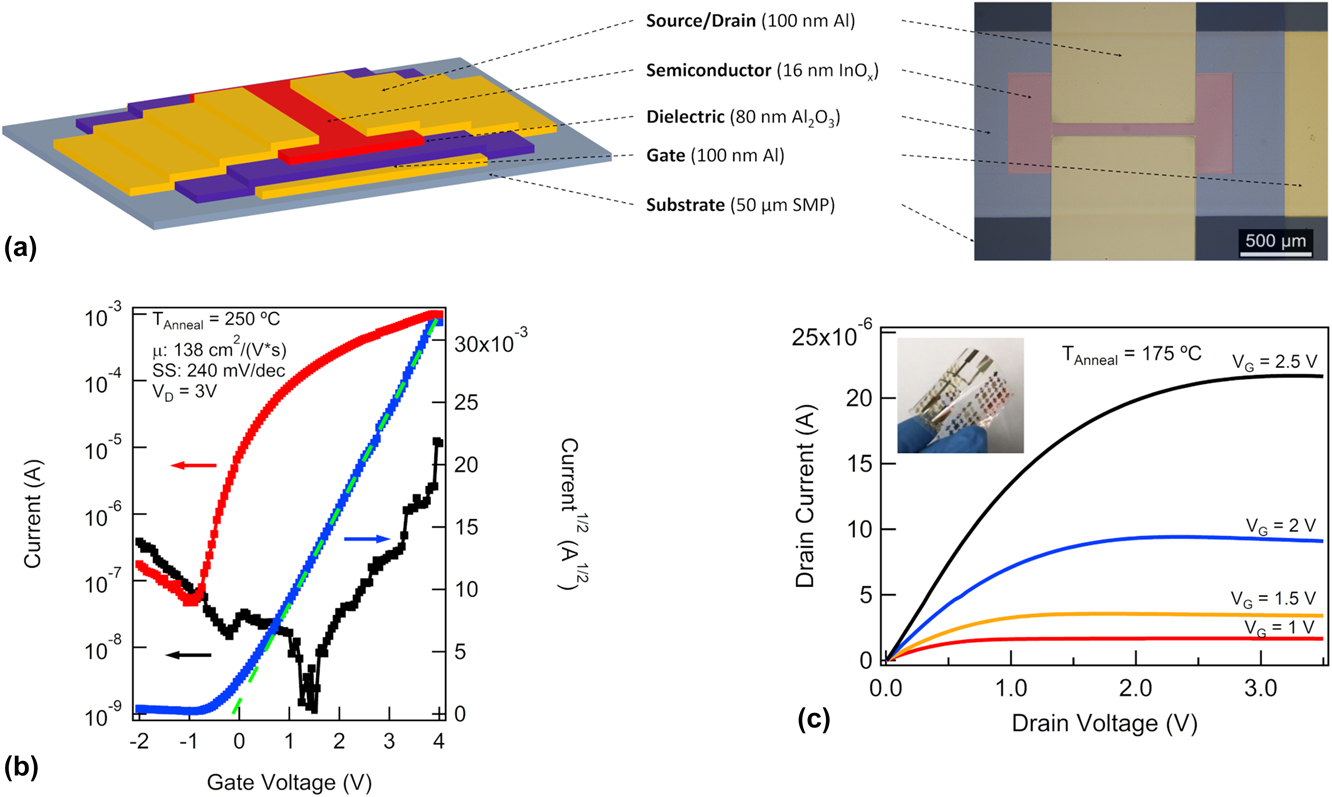
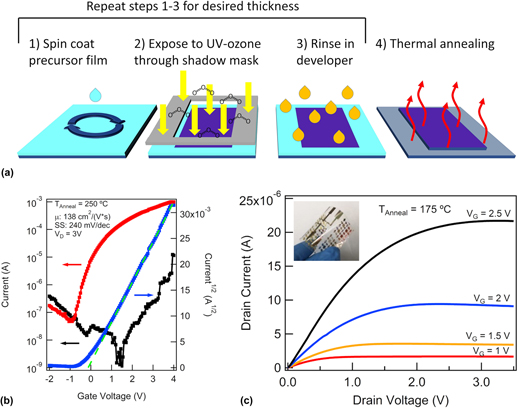
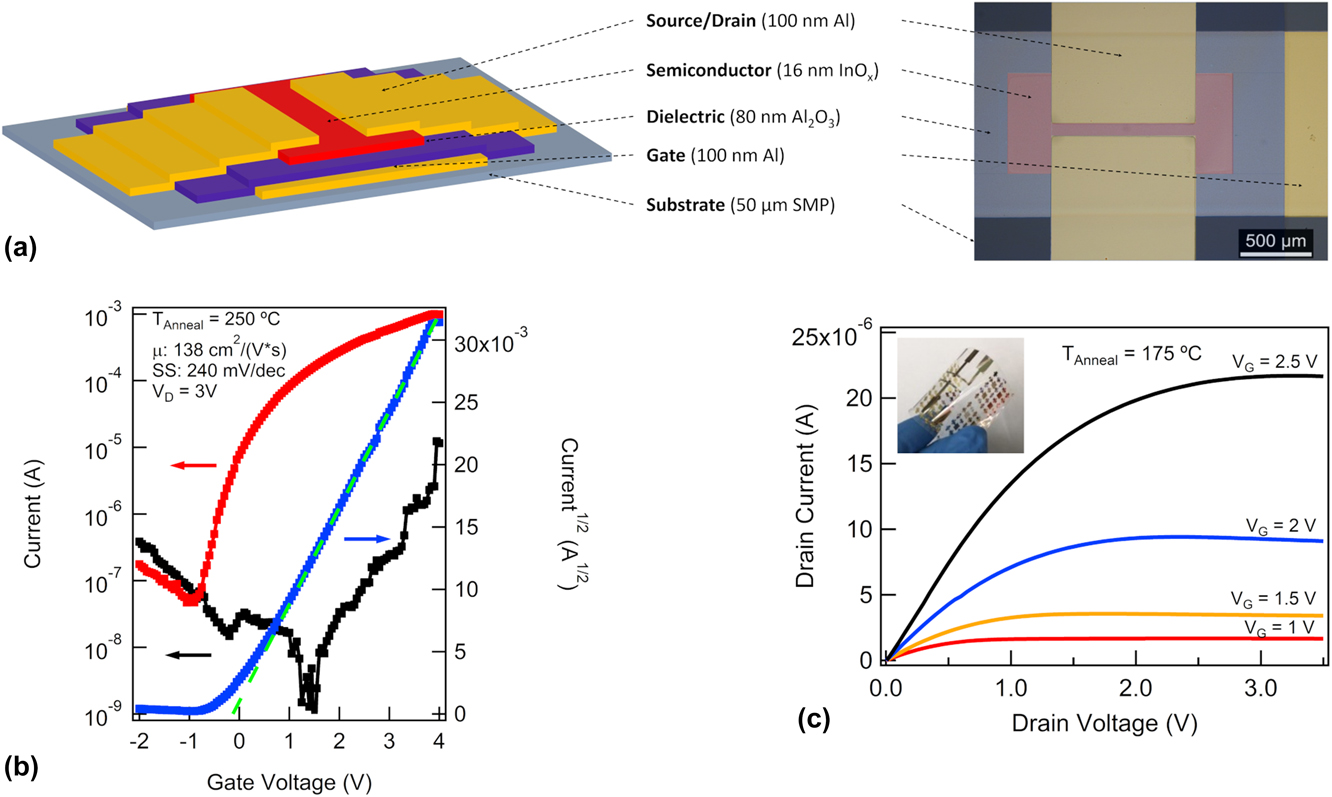
MIM capacitors and TFTs are fabricated using the above method to form patterned Al2O3 dielectric and In2O3 semiconductor films. The TFT device structure is shown in Fig. 7(a). Field effect mobility is extracted from transfer curves [drain current (I D) versus gate voltage (V G)] [Fig. 7(b)] in the saturation regime with drain voltage (V D) = 3 V [Fig. 6(c)] using the following equation:
 $${\mu _{{\rm{FE}}}} = {\left( {{{{\rm{d}}\sqrt {{I_{\rm{D}}}} } \over {{\rm{d}}{V_{\rm{G}}}}}} \right)^2} \times 2 \times {L \over {W \times C}}\quad ,$$
where µFE is the saturation field effect mobility, the derivative  ${{{\rm{d}}\sqrt {{I_{\rm{D}}}} } / {{\rm{d}}{V_{\rm{G}}}}}$ is taken as the slope of the linear portion of the I D1/2 versus V G curve [shown as a dashed green line in Fig. 7(b)], L and W (100 and 1000 µm) are the length and width of the TFT channel as defined by the top contacts, and C is the areal capacitance of the dielectric measured on an MIM structure [Fig. 8(b)]. From the transfer curve of a single device annealed at 250 °C shown in Fig. 7(b), we find μFE = 138 cm2/(V s) (using C measured at 10 kHz) with an on/off current ratio (I on/off) above 104 and subthreshold swing (SS) of 240 mV/dec. This mobility value is high, but it is comparable to previously reported metal oxide semiconductors (including In2O3 and In–Ga–Zn oxide) on solution-processed Al2O3 gate dielectrics.Reference Rim, Chen, Liu, Bae, Kim and Yang25,Reference Nayak, Hedhili, Cha and Alshareef32–Reference Zhang, Huang, Duan, Dong, Zhang and Qiu35 Currently, the origin of the high mobility is not well understood. Below we consider two factors that could over-estimate the saturation mobility using Eq. (1).
TFT on SMP device structure and performance. (a) Schematic and optical image (false color added for emphasis) of device structure with SMP substrate, aluminum gate, Al2O3 gate dielectric, In2O3 semiconductor, and Al source and drain. (b) Transfer curve with drain current (I D, red), gate current, (I G, black), and I D1/2 (blue) versus gate voltage (V G) for a TFT with In2O3 annealed at 250 °C and V D = 3 V. Green dashed line shows I D1/2 versus V G fit used for mobility extraction. (c) Output curves showing drain current (I D) versus drain voltage (V D) for a device with In2O3 annealed at 175 °C. Inset: Photograph of transistors and capacitors on SMP delaminated from the carrier substrate.
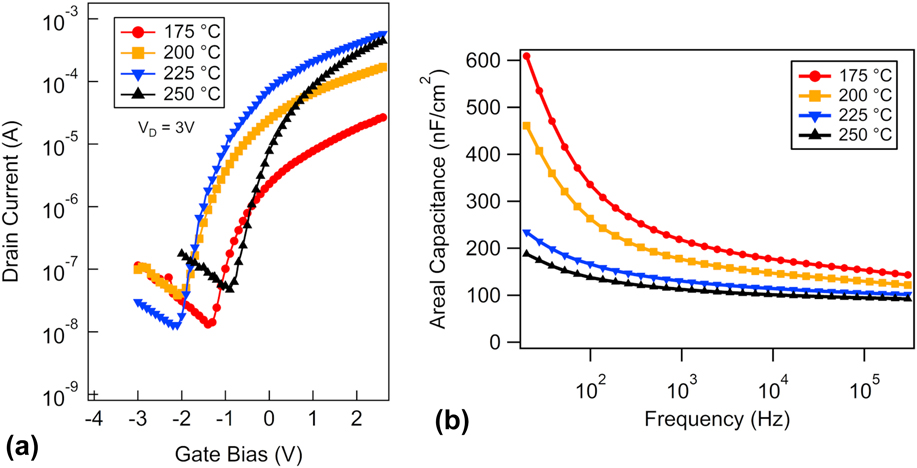
Device performance for varying annealing temperatures of In2O3. (a) I D versus V G curves for representative devices annealed from 175 to 250 °C taken at V D = 3 V. (b) Areal capacitance versus frequency measurements from 20 Hz to 300 MHz of Al/Al2O3/Al MIMs for different In2O3 annealing temperatures.
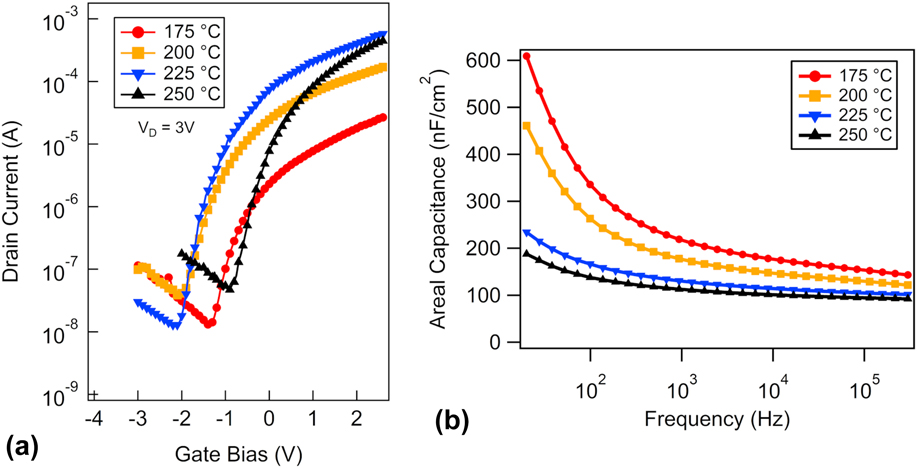
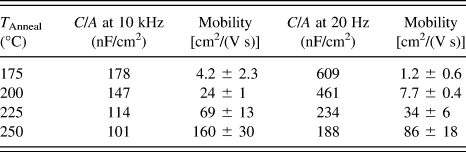
The effect of In2O3 processing temperature on TFT operation [Fig. 8(a)] and on MIM (Al/Al2O3/Al) capacitance–frequency (C–f) behavior [Fig. 8(b)] is examined. While transistors with In2O3 annealed at 150 °C do not present channel modulation, those annealed at 175 °C show an average mobility of 4 cm2/(V s) increasing to an average of 160 cm2/(V s) for those annealed at 250 °C. These mobility values are calculated using C measured at 10 kHz [Table I]. I on/off ranges from ∼104 to ∼105. It is important to note that there is significant frequency dispersion evident in the capacitance measurements indicating polarizable defects (such as –OH) or mobile ions in the dielectric. Because these defects only respond to lower frequency electric fields, the apparent capacitance of the dielectric is higher at low frequency. As TFT measurements are taken under quasi-static conditions, this results in an over estimation of the channel mobility by under estimation of the gate capacitance. For this reason, mobility values using the capacitance measured at 20 Hz are also shown in Table I. Although all gate dielectrics are annealed at 250 °C prior to semiconductor deposition, the frequency dispersion in the capacitance is still less in devices with a higher final semiconductor annealing temperature. Furthermore, the capacitance values at 10 kHz correspond to relative permittivity εr = 9.1 to 15.7 as In2O3 processing temperature decreases. The higher-than-bulk permittivity values are attributed to the –OH content of the dielectric.Reference Xu, Wang, Xie, Chen, Cao and Xu34 Since the capacitors are constructed on the same devices as the TFTs and undergo all the same processing conditions, the dielectric annealed at a lower temperature contains a larger amount of –OH, hence higher εr and larger capacitance–frequency dispersion. Note that when Nayak et al. reported a mobility value of 127 cm2/(V s) for a solution-processed In2O3 TFT on Al2O3 dielectric, they used capacitance value measured at 1 MHz to calculate the mobility. They also observed –OH in the XPS O1s spectra of Al2O3 similar to Fig. 4(a).Reference Nayak, Hedhili, Cha and Alshareef32
The average channel mobility for TFTs with In2O3 annealed at different temperatures. Mobility is calculated using gate capacitance measured at both 10 kHz and 20 Hz.

Additionally, the mobility is over estimated because of the fringe current when the channel is in the on state. Because the patterned semiconductor is 50% wider than the channel as defined by the source and drain contacts [Fig. 7(a)], the mobility may be overestimated by up to 50%. Even after taking these considerations into account, the mobility value for the TFT made at 250 °C remains quite high at 57 cm2/(V s), but is in line with a number of other reports on solution-processed Al2O3 dielectric.Reference Liu, Zhu, Sun, Xu and Noh36 Additional mechanisms for the high channel mobility values reported here and in the literature are the subject of a follow up study.
IV. CONCLUSION
We demonstrate that photochemical self-patterning of sol–gel precursor films prior to annealing enables high-performance metal oxide TFTs on an SMP substrate by solution processing. Exposure to UVO through a shadow mask defines patterns in the precursor films. Chemical and thickness analyses reveal that UVO exposure initiates the metal oxide conversion process by decomposing the metal precursors and facilitating the formation and densification of metal-oxide networks. Subsequent thermal annealing at elevated temperatures produces high-quality oxide film patterns on the SMP substrate without cracks. TFTs on SMP using Al2O3 gate dielectric and In2O3 semiconductor fabricated by this method demonstrate excellent device performance, with mobility up to 160 cm2/(V s), SS as low as below 110 mV dec−1, and threshold voltage near 0 V using processing temperature ≤250 °C. Further research on UVO patterning and conversion of solution-processed metal oxide films as it relates to electrical device performance and stability will advance large-scale processing of high-performing devices on SMP and other low-temperature substrates.
ACKNOWLEDGMENTS
The authors thank Dr. Robert Wallace for the use of the spectroscopic ellipsometer, Michael Womble for assistance in XRD measurements, and Sean Dillon and James Tran for help in FTIR measurements. This work is supported in part by the Center for Engineering Innovation and by SPARC. W.V. acknowledges support from the DARPA Young Faculty Award and DARPA Director’s Fellowship (No. D13AP00049). J.W.P.H. acknowledges the support from Texas Instruments Distinguished Chair in Nanoelectronics.