Introduction
Figure–ground segregation is a fundamental visual ability that allows an organism to separate an object from its background. Many factors affect figure–ground assignment in humans, including surroundedness, symmetry, smaller size, or synchronous motion (Palmer, Reference Palmer1999). In primates, figure–ground segregation occurs relatively early in the course of visual processing, most likely in areas V1 and V2 that contain cells sensitive to figure–ground status or to border ownership (Zhou et al., Reference Zhou, Friedman and Von Der Heydt2000; Supér, Reference Supér, Lazareva, Shimizu and Wasserman2012), but little is known about figure–ground segregation in avian brain.
Earlier, we explored the metabolic activity of areas associated with figure–ground discrimination in the avian brain (Acerbo et al., Reference Acerbo, Lazareva, McInnerney, Leiker, Wasserman and Poremba2012). Unlike primates, birds process most of their visual input in the collothalamic, or retino-collicular pathway, which appears to be functionally analogous to the mammalian lemnothalamic, or retino-geniculate-striate pathway (Nguen et al., Reference Nguen, Spetch, Crowder, Winship, Hurd and Wylie2004; Shimizu et al., Reference Shimizu, Patton and Husband2010). Retinal input in the avian brain is first transmitted to a contralateral optic tectum (TeO) then to the thalamic nucleus rotundus (Rt). Although information in the outer layers of the TeO is organized retinotopically (Hamdi & Whitteridge, Reference Hamdi and Whitteridge1954; Karten & Revzin, Reference Karten and Revzin1966; Hellmann & Güntürkün, Reference Hellmann and Güntürkün2001), it is segregated functionally in the Rt, with color-sensitive cells in the dorsoanterior region, motion-sensitive cells in the posterior region, and luminance-sensitive cells in the central region (Wang et al., Reference Wang, Jiang and Frost1993). In addition to excitatory input from TeO, the Rt also receives inhibitory input from several thalamic nuclei, with the nucleus subpretectalis/interstitio-pretecto-subpretectalis complex (SP/IPS) providing the main source of inhibitory modulation of rotundal activity (Mpodozis et al., Reference Mpodozis, Cox, Shimizu, Bischof, Woodson and Karten1996; Tömböl et al., Reference Tömböl, Németh, Sebestény and Alpár1999; Hu et al., Reference Hu, Naito, Chen, Ohmori and Fukuta2003).
Earlier, we reported that figure–ground discrimination was associated with a strong activity of the Rt and the SP/IPS complex (Acerbo et al., Reference Acerbo, Lazareva, McInnerney, Leiker, Wasserman and Poremba2012). In contrast, color discrimination was correlated with a strong activity of the Rt but not the SP/IPS; this lack of inhibitory control suggested that the Rt may not be directly involved in color discrimination despite the presence of color-sensitive neurons (Wang et al., Reference Wang, Jiang and Frost1993). Finally, shape discrimination was associated with a significantly lower activity of the Rt and the SP/IPS, again suggesting that the Rt may not be directly involved in this task.
Here, we further explored the involvement of the Rt and the SP/IPS in color discrimination, shape discrimination, and figure–ground discrimination by conducting bilateral chemical lesions of the SP/IPS complex after acquisition of all three discriminations. Because direct lesions of the Rt produce severe deficits in both brightness discrimination and shape discrimination (Hodos & Karten, Reference Hodos and Karten1966), we have instead concentrated on lesions of the SP/IPS that provides inhibitory control of the Rt. Based on the results of our earlier research, we expected that the SP/IPS lesions would impair figure–ground discrimination but not shape discrimination or color discrimination.
Materials and methods
Nine pigeons (Columba livia) were trained concurrently to perform figure–ground, shape, and color discriminations within a single session. Because the color discrimination task was included only as a control condition, no attempt was made to match the red and green colors according to the pigeon’s spectral sensitivity. Indeed, the average luminance of the green color was approximately 2.5–3 times higher than the average luminance of the red color when measured inside the operant chamber. It is therefore possible that the birds may have been discriminating these colors based on some combination of hue and brightness. The birds were maintained at 85% of their free-feeding weights by controlled daily feeding, and all procedures were approved by Drake University Institutional Animal Care and Use Committee.
We used six custom-built operant chambers, equipped with an infrared touchscreen (17″, CarrolTouch Model # D27566-001, Elo Touch Solutions, IL) placed in front of a 17″ LCD Dell monitor (Dell UltraSharp™ 1708FP, Dell, TX, producing 300 cd/m2 white luminance). A house light (an incandescent 28V-0.4 Amp lamp, model 1819, with filament type C-2F producing 4 lumens) provided illumination during the experimental session. The birds were reinforced with millet delivered by a grain hopper (MedAssociates Model # ENV-205M, Med Associates Inc., VT) located outside of the operant chamber. All experimental procedures were developed in MATLAB® using functions provided by Psychtoolbox (Brainard, Reference Brainard1997).
Fig. 1 shows the sequence of events during a trial. Pigeons were first presented with a black cross on a white square and had to peck on the square in order to initiate the trial. Next, a 9 × 9 cm stimulus display containing a 5 × 7 cm figural region with a 1 × 1 cm yellow square (a target) appeared, and the pigeons had to peck the target from 1 to 10 times (fixed ratio, FR). The FR was adjusted on a bird-by-bird basis to make errors more aversive. The target appeared equally often on the figure and on the ground, so that the location of the figure could not cue the location of the target.
A sequence of events in the course of figure–ground, color trial, and shape trials. The same images could be shown during all three trial types. The assignment of response keys to the discriminative task was randomized across birds. The colors of the figure and background were randomly red and green, and the location of the figure was varied across trials. The dashed lines indicate other potential locations of the target. On shape trials, the targets located outside of the figure were eliminated to ensure that the birds attended to the shapes. However, because the location of the figure varied, all four target locations were utilized across the trials.

Upon completion of the FR, two choice keys were presented. The location of the keys determined the to-be-performed discriminative task. For example, if the keys were shown at the middle left and the middle right of the display (Fig. 1, left panel), then the bird had to perform a figure–ground discrimination in which one key was correct if the target was located on the figural area and another key was correct if the target was located on the background. If the keys were shown at the upper left and upper right corners of the display (Fig. 1, middle panel), then the bird had to perform color discrimination, selecting one key if the target was located on the red area and another if the target was located on the green area. Neither the figural status nor the shape of the figural region was relevant for this task. Finally, if the choice keys were shown to the lower left and the lower right of the stimulus display (Fig. 1, right panel), then the bird had to perform shape discrimination. The assignment of the sets of keys to the discriminative tasks was randomized across birds.
If the choice was correct, then a 7-s access to grain was given, and the intertrial interval (ITI) ensued ranging from 10 to 25 s. If the incorrect choice was made, the house light was turned off and a correction trial was given. On the correction trials, the ITI was adjusted on a bird-by-bird basis to make the incorrect choices more aversive and ranged from 15 to 52 s for different birds. Only the initial response on a trial was scored for data analyses.
Randomizing the color of figure and background, the location of the figure, the location of the target, and the shape of the figure produced 64 unique displays (2 colors × 4 figure locations × 4 target locations × 2 shapes) used in the color discrimination task and in the figure–ground discrimination task. For the shape discrimination task, the trials with a target located outside of the figural region were eliminated to encourage the birds to attend to the shape of the figure; therefore, a total of 32 unique displays were possible. At the beginning of a training session, one block of 64 figure–ground trials, one block of 64 color trials, and two blocks of 32 shape trials were generated. Then, from each of these blocks, 40 random trials were chosen to create a training session consisting of 120 trials. The order in which the blocks were presented was also randomly selected at the beginning of each training session.
Once the birds reached the training criterion (see Results), they were anesthetized with Nembutal (20 mg/kg, i.m.) followed by chloral hydrate (300 mg/kg, i.m.). The pigeons in the experimental group (n = 5) received bilateral injections of 0.5 µl ibotenic acid (15 µg/µl) using a Hamilton syringe and a syringe pump (Harvard Apparatus, Model 22, MA, Harvard Apparatus, MA). The pigeons in the sham group (n = 4) received bilateral injections of 0.5 µl artificial cerebrospinal fluid. The injection coordinates estimated with a pigeon brain atlas (Karten & Hodos, Reference Karten and Hodos1967) were anterior 4.75, lateral 3.4, and ventral 9.5. The injection lasted 2 min at a rate of 0.25 µl/min, and the cannuli were left in place for additional 2 min to ensure diffusion. Following the surgery, pigeons were allowed to recover for 5 days. After that, they were retrained for five completed sessions using the same training procedure, allowing for pre-postsurgery comparison. Preliminary analyses did not reveal any statistically significant interactions of session with any other factors; therefore, the results were pooled for all future analyses.
After postoperative retraining, the birds were given an overdose of Nembutal (50 mg/kg) and perfused transcardially with 0.9% saline followed by 4% paraformaldehyde in 0.1 M phosphate buffer (PB). The brains were placed in 4% paraformaldehyde in PB for at least 24 h followed by 30% sucrose in PB until saturation. The brains were then frozen, sliced coronally in 40 µm sections, mounted, and Nissl-stained for lesion volume analysis.
We examined lesion sites microscopically and compared them with their respective plates in pigeon brain atlas (Karten & Hodos, Reference Karten and Hodos1967) to confirm the size and extent of necrosis and gliosis (Fig. 2). We used ImageJ package, ver. 1.42 (Bingman et al., Reference Bingman, Gasser and Colombo2008) to calculate a volume of the entire SP and the entire IPS and the volume of the lesioned area for each of the structures. We then computed percent of lesion volume for the SP and IPS separately for each hemisphere and an overall percent of lesion volume. To reduce the influence of asymmetrical lesions in the statistical analyses, we computed a weighted average of the lesion volume, W%: (L% × R%)/100, where L% is percent of lesion volume in the left hemisphere and R% is percent of lesion volume in the right hemisphere (Hodos & Bobko, Reference Hodos and Bobko1984).
Anatomical key and lesion reconstruction for the birds in the experimental group with a chemical lesion of the SP/IPS complex. Black areas indicate necrosis and/or gliosis. Rt—nucleus rotundus, IPS—nucleus isthmo-pretecto-subpretectalis, SP—nucleus subpretectalis. The numbers A4.25–A5.25 indicate millimeter anterior to interaural zero in the pigeon brain atlas (Karten & Hodos, Reference Karten and Hodos1967).

For statistical analyses of behavioral data, we used the nonlinear mixed effects technique with a logistic regression and a binomial error distribution in the R statistical package (lme4 library; available at www.r-project.org). This approach is more appropriate for dichotomous (0 or 1) accuracy data than analysis of variance and is analogous to a repeated measures nonlinear regression analysis (Dixon, Reference Dixon2008; Young et al., Reference Young, Clark, Goffus and Hoane2009). Because of the binomial distribution of errors, the analysis returns z values rather than F values.
Results and discussion
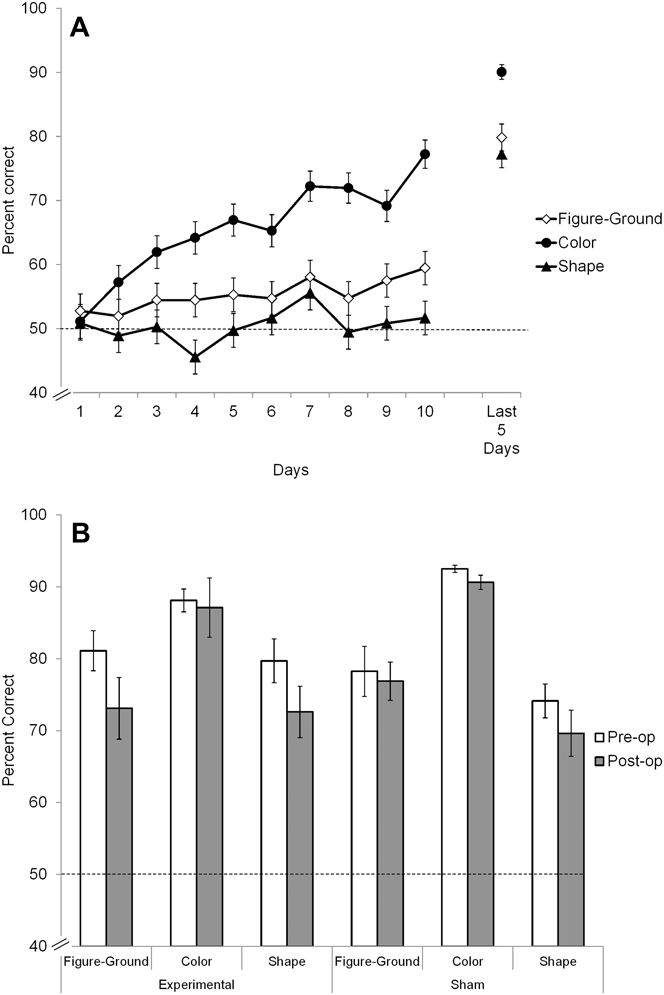
Fig. 3A illustrates the mean accuracy achieved for each of the three discriminative tasks during first 10 training sessions. Consistent with our earlier results (Acerbo et al., Reference Acerbo, Lazareva, McInnerney, Leiker, Wasserman and Poremba2012), by the 10th training session, the accuracy in color discrimination, t(8) = 9.11, P < 0.0001, and figure–ground discrimination, t(8) = 3.21, P = 0.01, was statistically above the chance level according to a two-tailed t-test. Shape discrimination accuracy, however, failed to significantly rise above chance, t(8) = 0.60, P = 0.57. To improve shape discrimination accuracy, the birds were next given shape-only training session when their performance on shape discrimination task fell below 50%. These sessions consisted of 4 blocks of 32 trials for a total of 128 trials. To limit possible forgetting of the other two tasks, the shape-only sessions were given for no more than three consecutive days. After that, the birds were returned to the standard sessions for at least 1 day. All nine birds were exposed to the shape-only sessions for an average of 38 days, ranging from 4 to 63 days. The training continued until the birds reached a criterion of 70% or better to each discriminative task within a single session and had completed at least five consecutive sessions since the last exposure to the shape-only session. As Fig. 3A illustrates, by the end of training, shape discrimination accuracy still remained somewhat lower than figure–ground or color discrimination accuracy (77.2, 79.8, and 90.1%, respectively).
Mean accuracy (A) during first 10 training sessions in figure–ground, color, and shape discrimination tasks and (B) during five final sessions before the lesion (preoperative) and after the lesion (postoperative). Dashed line indicates the chance level (50%). Error bars indicate the standard error of means.

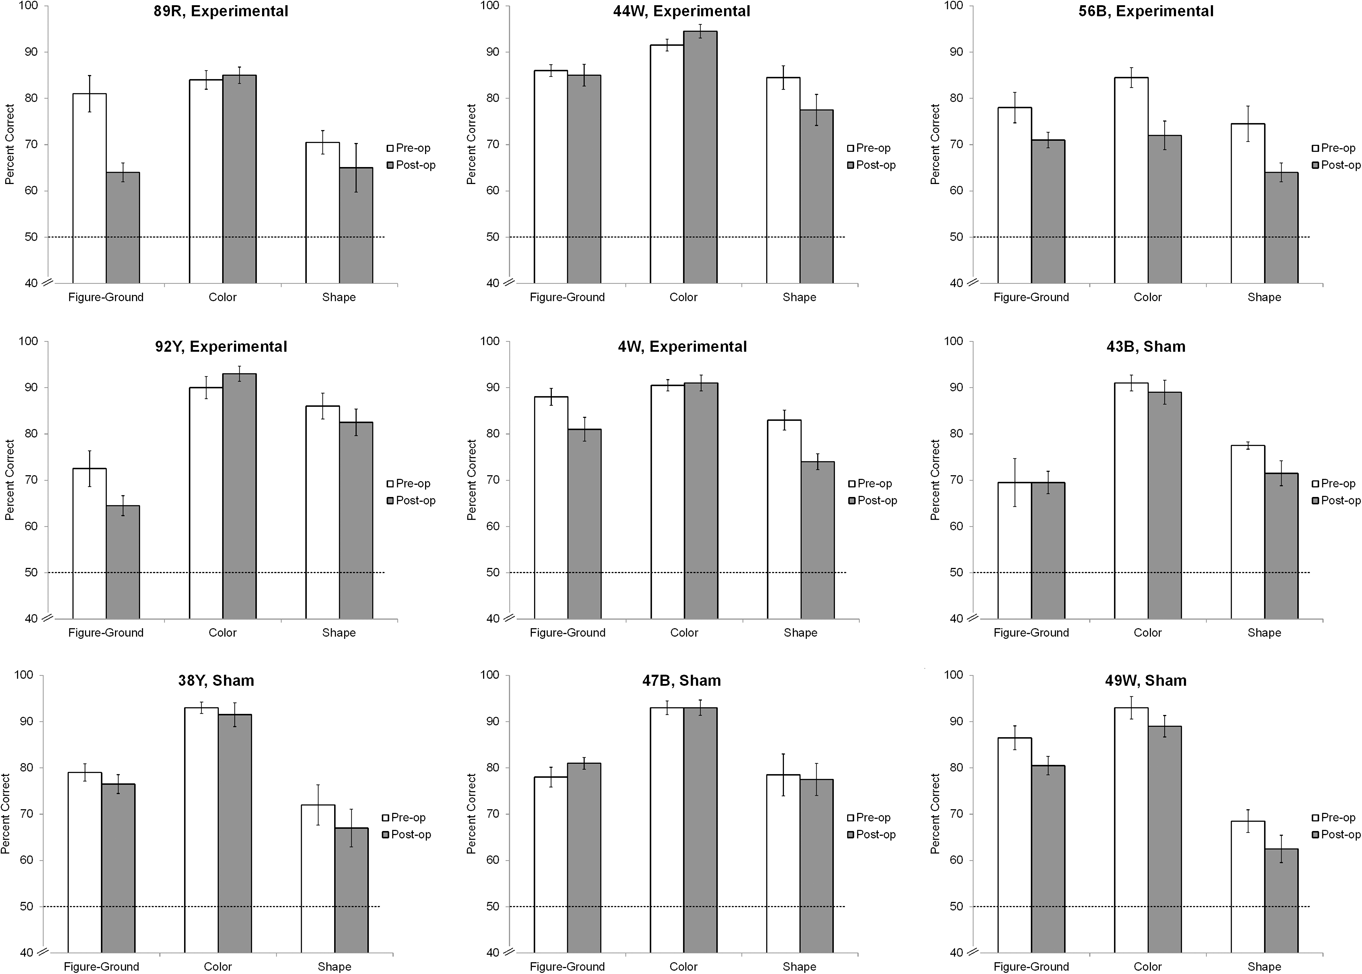
Fig. 3B shows the mean preoperative and postoperative accuracy in the experimental group and in the sham group separately for each task (see Fig. 4 for bird-by-bird data). For the figure–ground task, we found a significant interaction between group and time (z = 2.38, P = 0.017), indicating the decrease in postoperative accuracy in the experimental group (z = −4.29, P < 0.001) but not in the sham group (z = −0.66, P = 0.506). There was no significant main effect of group (z = −1.43, P = 0.153) or time (z = −1.37, P = 0.172) in color discrimination task accuracy, suggesting that the SP/IPS lesion had no effect on color discrimination. Finally, we found the significant main effect of time (z = −4.11, P < 0.0001) but no significant main effect of group (z = 1.14, P = 0.254) or group × time interaction (z = −1.14, P = 0.256) in the shape discrimination task, indicating that the decrease in postoperative accuracy was equivalent in both groups. Given that the shape discrimination task was more difficult than either color or figure–ground discrimination (cf. Fig. 3A), this decrease is best attributed to forgetting rather than to lesion-specific deficits. Importantly, there were no significant differences in accuracy between the groups prior to the lesion for any of the tasks.
Mean accuracy during five final sessions before the lesion (preoperative) and after the lesion (postoperative) for the individual birds. Dashed line indicates the chance level (50%). Error bars indicate the standard error of means.

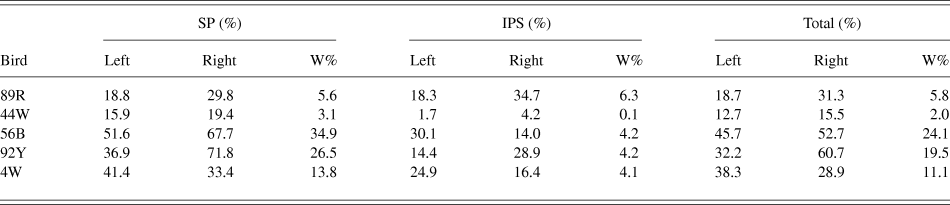
Table 1 shows the results of the volumetric analyses of lesions. To determine whether the behavioral deficits were caused by the overall effect of the lesions irrespective of location, we conducted a series of Spearman’s correlations between W% and postlesion accuracy separately for each task. We found no significant correlations between task accuracy and overall volume of lesion (all P’s ≥ 0.286), indicating that behavioral deficits could not be attributed to an overall lesion volume. Consistent with the pattern of behavioral deficits (Fig. 3B), there were no significant correlations of accuracy in color discrimination task with the volume of lesion in either the SP or the IPS (all P’s ≥ 0.104), suggesting that the lesions of the SP/IPS complex had no discernible effect on color discrimination accuracy. Together with our earlier report (Acerbo et al., Reference Acerbo, Lazareva, McInnerney, Leiker, Wasserman and Poremba2012), these results strongly imply that the Rt may not be directly involved in color discrimination despite the presence of color-sensitive cells (Wang et al., Reference Wang, Jiang and Frost1993). We also found no significant correlations of accuracy in the shape discrimination task with the volume of lesions of either the SP or the IPS (all P’s ≥ 0.285), further suggesting that the decrement in the shape discrimination accuracy is best attributed to forgetting rather than to a lesion of a specific area.
The results of lesion reconstruction analysis for the experimental group. W% stands for index of bilateral damage

Finally, we found a strong and significant negative correlation of the IPS volume with the accuracy in the figure–ground discrimination task (r = −0.90, P = 0.037) but no significant correlation with the SP volume (r = −0.30, P = 0.624), suggesting that inhibitory input from the IPS rather than the SP may be responsible for the regulation of figure–ground discrimination. The very strong negative correlation between the IPS lesion volume and figure–ground discrimination accuracy is particularly striking given the moderate damage to the structure caused by the lesions (cf. Table 1). However, given the small number of animals, this hypothesis needs to be confirmed in future experiments.
Overall, our results demonstrate that the inhibitory input provided by the SP/IPS complex to Rt is critical for accurate figure–ground discrimination in pigeons, and support our earlier hypothesis (Acerbo et al., Reference Acerbo, Lazareva, McInnerney, Leiker, Wasserman and Poremba2012) that visual processing at the thalamic level, rather than at the telencephalic level as in primates (Zhou et al., Reference Zhou, Friedman and Von Der Heydt2000; Supér, Reference Supér, Lazareva, Shimizu and Wasserman2012) plays an essential role for figure–ground discrimination in the avian brain. This result is also important for the understanding of the evolutionary development of visual pathways in vertebrates, and further supports the notion that an anatomically different and evolutionary distinct avian collothalamic pathway is functionally similar to the primate lemnothalamic pathway (Nguen et al., Reference Nguen, Spetch, Crowder, Winship, Hurd and Wylie2004; Shimizu et al., Reference Shimizu, Patton and Husband2010).
Acknowledgment
This research has been partially supported by A&S Faculty Development grant to O.F.L., This research has been partially supported by A&S Faculty Development grant to O.F.L. and by Drake University Summer Undergraduate Research Fellowship to E.N.S. We are grateful to Toru Shimizu for numerous discussions of early results, to Mike Young for help with statistical analyses of the data, and to Emily Leiker and Katie Goodwin for their work on the initial stages of the project.