1. Introduction
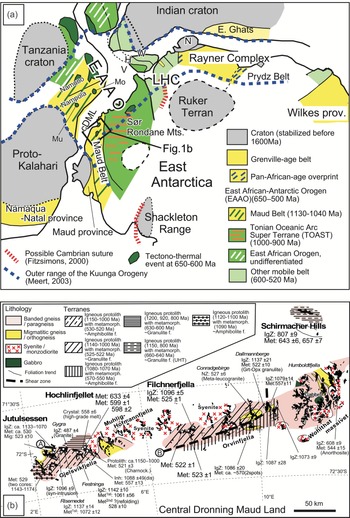
Understanding the evolutionary history of orogenic belts is crucial to revealing the continental growth of the active Earth. Geochemical data contribute to the estimation of the geological background and provinces of orogenic belts. The formation of the Gondwana supercontinent was a global event that resulted in the formation of widespread orogenic belts, including the East Africa–Antarctica Orogen (EAAO) (Fig. 1a; Jacobs & Thomas, Reference Jacobs and Thomas2004) at 650–500 Ma, or two separate East Africa Orogen (EAO) events (Stern, Reference Stern1994) at 650 ± 50 Ma and the subsequent Kuunga Orogeny at 550 ± 50 Ma (Meert, Reference Meert2003; Grantham et al. Reference Grantham, Macey, Ingram, Roberts, Armstrong, Hokada, Shiraishi, Jackson, Bisnath, Manhica, Satish-Kumar, Motoyoshi, Osani, Hiroi and Shiraishi2008). The orogenic belt extends more than 8000 km and acts as the collision zone between East and West Gondwana.
(a) Reconstruction of East Antarctica and adjacent parts of Gondwana at 500 Ma (after Fitzsimons, Reference Fitzsimons2000; Shiraishi et al. Reference Shiraishi, Dunkley, Hokada, Fanning, Kagami, Hamamoto, Satish-Kumar, Motoyoshi, Osani, Hiroi and Shiraishi2008; Grantham et al. Reference Grantham, Macey, Horie, Kawakami, Ishikawa, Satish-Kumar, Tsuchiya, Graser and Azevedo2013; Jacobs et al. Reference Jacobs, Elburg, Läufer, Kleinhanns, Henjes-Kunst, Estrada, Ruppel, Damaske, Montero and Bea2015; Ruppel et al. Reference Ruppel, Jacobs, Eagles, Läufer and Jokat2018). The Lützow-Holm Complex (LHC) is situated adjacent to the East African–Antarctic Orogen (EAAO). Key sutures and orogenic belts are taken from Fitzsimons (Reference Fitzsimons2000) and Meert (Reference Meert2003). Abbreviations: H – Highland Complex; N – Napier Complex; V – Vijayan Complex; W – Wanni Complex; cDML – central Dronning Maud Land; Mo – Monapo Complex; Mu – Mugeba Complex. (b) Map showing study area and preliminary terrane division of central Dronning Maud Land. Published U–Pb ages obtained by SHRIMP and secondary ion mass spectrometry (SIMS) are also shown (after Baba et al. Reference Baba, Horie, Hokada, Owada, Adachi and Shiraishi2015 and references therein). Dashed lines A and B represent possible terrane boundary. Abbreviations: Crystal – crystallization age from melt; dis – discordia age; f. – facies; Grt-Opx – garnet-orthopyroxene; IgZ – igneous zircon; Inh – inherited; Met – timing of peak metamorphism; Metamorph. – metamorphism, Mig – timing of migmatization; NZ – newly crystallized zircon; UHT – ultra-high temperature.

The mountain range of central Dronning Maud Land (DML) is sub-parallel to and 200–250 km inland from the edge of the East Antarctica ice sheet (Fig. 1a). Central DML occupies the core part of the past EAAO or EAO and Kuunga Orogeny. The main collisional event in central DML was in the range of the Kuunga Orogeny (e.g. Pan-African I at c. 560–550 Ma and Pan-African II at c. 530–490 Ma; Jacobs et al. Reference Jacobs, Bauer and Fanning2003). Zircon U–Pb age data obtained from metamorphic rocks from several localities in central DML have revealed different timings of metamorphism at c. 640 Ma, 600 Ma and 520 Ma (Baba et al. Reference Baba, Hokada, Kaiden, Dunkley, Owada and Shiraishi2010, Reference Baba, Horie, Hokada, Owada, Adachi and Shiraishi2015). Therefore, the older EAO event of 650 ± 50 Ma extends to the Antarctic region.
Grantham et al. (Reference Grantham, Macey, Ingram, Roberts, Armstrong, Hokada, Shiraishi, Jackson, Bisnath, Manhica, Satish-Kumar, Motoyoshi, Osani, Hiroi and Shiraishi2008, Reference Grantham, Macey, Horie, Kawakami, Ishikawa, Satish-Kumar, Tsuchiya, Graser and Azevedo2013) proposed a megathrust tectonic model forming meganappe/klippen for the geological evolution of central and eastern DML. Grantham et al. (Reference Grantham, Macey, Ingram, Roberts, Armstrong, Hokada, Shiraishi, Jackson, Bisnath, Manhica, Satish-Kumar, Motoyoshi, Osani, Hiroi and Shiraishi2008) pointed out that the Schirmacher Hills have ages comparable with those of the Namuno terrane and klippen (Mugeba and Monapo complexes) in northern Mozambique (Fig. 1). Still, the distinctive ultra-high temperature (UHT) metamorphism in the Schirmacher Hills (Baba et al. Reference Baba, Owada, Grew, Shiraishi, Fütterer, Damaske, Kleinschmidt, Miller and Tessensohn2006, Reference Baba, Hokada, Kaiden, Dunkley, Owada and Shiraishi2010) has not been detected in these localities. The Nampula terrane in southern Mozambique, the footwall of the megathrust, which is equivalent to central DML (Grantham et al. Reference Grantham, Macey, Horie, Kawakami, Ishikawa, Satish-Kumar, Tsuchiya, Graser and Azevedo2013), does not preserve 640 Ma and 600 Ma metamorphic events. In addition, c. 800 Ma magmatism dated from the Schirmacher Hills is limited to several localities in the Namuno terrane (Bingen et al. Reference Bingen, Jacobs, Viola, Henderson, Skår, Boyd, Thomas, Solli, Key and Daudi2009) and needs to be better detected in these klippen.
Baba et al. (Reference Baba, Horie, Hokada, Owada, Adachi and Shiraishi2015) have proposed a preliminary terrane division based on the protolith age and the timing of metamorphism in central DML (Fig. 1b). However, the interrelationships and tectonic settings of the different metamorphic ages are not fully understood. Jacobs et al. (Reference Jacobs, Elburg, Läufer, Kleinhanns, Henjes-Kunst, Estrada, Ruppel, Damaske, Montero and Bea2015, Reference Jacobs, Opås, Elburg, Läufer, Estrada, Ksienzyk, Damaske and Hofmann2017) proposed two basement provinces in central to eastern DML: the Grenville-aged Maud Belt and the Tonian Oceanic Arc Super Terrane (TOAST) (Fig. 1a). According to their models, central DML belongs to the Grenville-aged Maud Belt, which has older protolith ages ranging from 1130 to 1040 Ma, with metamorphic overprints at 600 Ma, 570–550 Ma and 530–515 Ma. The TOAST represents juvenile subduction-related oceanic arcs ranging from 1000 to 900 Ma. Therefore, the simple collision of the two vast continents, East and West Gondwana, is now debatable, considering the presence of the TOAST.
Previous studies have reported many ages from central to eastern DML; however, there is little information about the tectonic setting of the precursors of the metamorphic rocks. This study reveals the tectonic setting of the mafic metamorphic rocks of four localities in central DML based on their geochemistry and previously published age data.
2. Geological setting
The central DML nunataks consist of high-grade metamorphic rocks and a series of post-tectonic igneous rocks. The metamorphic rocks are banded gneisses associated with supracrustal components and migmatites of various compositions that have been metamorphosed under amphibolite- to granulite-facies conditions. The igneous rocks are mainly A-type granitoids, and they are exposed over a large area from Sverdrupfjella in the west to Wohlthatmassivet in the east (Fig. 1b). They are considered to have formed owing to the melting of an over-thickened crust derived from the collision of East and West Gondwana during the Pan-African orogeny in the late Neoproterozoic to early Palaeozoic era (Jacobs et al. Reference Jacobs, Bauer and Fanning2003). The older Mesoproterozoic (c. 1.1 Ga) rocks in central DML were reworked during the early Palaeozoic era with intense reworking in central DML as compared to those of western DML (e.g. Heimefrontfjella and Kirwanveggen).
2.a. Schirmacher Hills
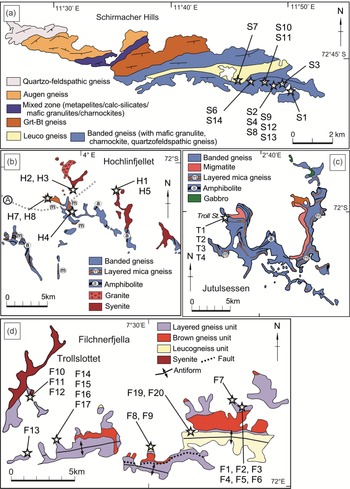
The Schirmacher Hills (11° 20′–11° 55′ E, 70° 45′ S) are an isolated exposure on the Princess Astrid coast in central DML. The high-grade metamorphic rocks are divided into the following units (Fig. 2a): (1) quartzo-feldspathic gneiss, (2) augen gneiss, (3) a mixed zone including metapelite and calc-silicate gneiss, mafic granulite and charnockite, (4) garnet-biotite gneiss, and (5) banded gneiss (Sengupta, Reference Sengupta1993; Rameshwar Rao et al. Reference Rameshwar Rao, Sharma and Gururajan1997).
Simplified geological map of the study area showing the sample localities. (a) Schirmacher Hills (modified after Sengupta, Reference Sengupta1993; Rameshwar Rao et al. Reference Rameshwar Rao, Sharma and Gururajan1997); (b) Hochlinfjellet and (c) Jutulsessen (modified after Ohta, Reference Ohta1993); (d) Filchnerfjella (Owada et al. Reference Owada, Baba, Läufer, Elvebold, Shiraishi and Jacobs2003).

The banded gneiss unit is predominantly composed of biotite-hornblende or biotite gneiss with a smaller fraction of garnet-bearing gneiss, mafic to intermediate granulite, garnet-amphibolite, garnet-rich biotite gneiss and pyroxenite. The mafic granulite has variable amounts of garnet, clinopyroxene and orthopyroxene and occurs as discontinuous layers and blocks. Highly deformed gneisses occur locally. The analysed mafic granulites and gneisses originated from the banded gneiss unit in the eastern part of the Schirmacher Hills (Fig. 2a).
2.b. Hochlinfjellet
Hochlinfjellet (72° 05′ S, 4° 03′ E) is located in the western part of the Mühlig–Hofmannfjella (72° 00′–72° 05′ S, 3° 50′–5° 30′ E) (Fig. 2b). A regional geological map of this region was published by Ohta (Reference Ohta1993). This area consists mainly of banded gneiss and migmatized biotite-hornblende schist/gneiss (Paulsson & Austrheim, Reference Paulsson and Austrheim2003; Bucher & Frost, Reference Bucher and Frost2006) (Fig. 2b). The banded gneisses include layered micaceous gneisses, marbles, calc-silicate rocks, garnet-sillimanite gneisses, quartzo-feldspathic gneisses, amphibolites and metamorphosed basic dykes, which predominate west of the Hochlinfjellet nunataks. They were deformed and locally migmatized to various degrees. Post-tectonic intrusions of A-type granitoids, syenite, occur extensively in the nunataks between Hochlinfjellet and Filchnerfjella.
2.c. Jutulsessen
Jutulsessen is located in the central portion of Gjelsvikfjella (2° 30′–2° 50′ E, 72° 00′–72° 05′ S). The geology of this region (Fig. 2c) is identical to that of Hochlinfjellet (Ohta, Reference Ohta1993). Investigation near Troll Station showed the presence of garnet-sillimanite-bearing pelitic gneiss and garnet-clinopyroxene-, garnet-hornblende- and garnet-orthopyroxene-bearing mafic gneisses. All samples were collected near Troll Station.
2.d. Filchnerfjella
Filchnerfjella (Fig. 2d) is located near the eastern edge of the Mühlig–Hofmannfjella and is underlain by granulite-facies metamorphic rocks that are intruded by a series of post-tectonic charnockite, syenite, quartz-syenite, granite and several generations of dykes (Owada et al. Reference Owada, Baba, Läufer, Elvebold, Shiraishi and Jacobs2003, Reference Owada, Baba, Osanai, Kagami, Satish-Kumar, Motoyoshi, Osani, Hiroi and Shiraishi2008; Engvik & Elvevold, Reference Engvik and Elvevold2004). The metamorphic rocks are divided into three units (Fig. 2d): (1) garnet-bearing leucocratic gneisses (leucogneiss unit); (2) orthopyroxene-bearing brown gneisses with dark-coloured feldspars (brown gneiss unit); and (3) variably coloured and layered gneisses comprising alternating layers of gneiss associated with rock units of (1) and (2) (layered gneiss unit; Owada et al. Reference Owada, Baba, Läufer, Elvebold, Shiraishi and Jacobs2003). The detailed lithological composition of each unit is described in Baba et al. (Reference Baba, Horie, Hokada, Owada, Adachi and Shiraishi2015). Mafic gneisses with various mineral assemblages of garnet-clinopyroxene-hornblende, garnet-hornblende, two-pyroxene and garnet-orthopyroxene-hornblende were collected for analysis.
2.e. Metamorphism and age relationships
The metamorphic pressure–temperature (P–T) paths of the studied regions commonly show a clockwise trajectory (Baba et al. Reference Baba, Horie, Hokada, Owada, Adachi and Shiraishi2015). An isothermal decompression retrograde path characterizes the inland nunataks of Filchnerfjella, Jutulsessen and Hochlinfjellet, as evidenced by the corona texture of orthopyroxene symplectite and plagioclase replacing garnet (Owada et al. Reference Owada, Baba, Läufer, Elvebold, Shiraishi and Jacobs2003; Baba et al. Reference Baba, Owada, Shiraishi, Satish-Kumar, Motoyoshi, Osani, Hiroi and Shiraishi2008). Cordierites replacing garnet and sillimanite in the pelitic gneisses from Filchnerfjella and Hochlinfjellet also indicate a history of decompression metamorphism. U–Pb zircon age data show two separate metamorphism stages, at 630–600 Ma for Hochlinfjellet and 520 Ma for Filchnerfjella. Since zircons with texturally similar internal domains were analysed, they were interpreted to have formed close to the peak metamorphism, and not during the prolonged retrograde cooling phase (Elvevold et al. Reference Elvevold, Engvik, Abu-Alam, Myhre and Corfu2020).
The coastal outcrop of Schirmacher Hills recorded UHT conditions with a clockwise P–T path involving an isobaric cooling (IBC) retrograde history (Baba et al. Reference Baba, Owada, Grew, Shiraishi, Fütterer, Damaske, Kleinschmidt, Miller and Tessensohn2006, Reference Baba, Hokada, Kaiden, Dunkley, Owada and Shiraishi2010) in marked contrast to those of the inland nunataks. Garnet-bearing mafic granulite exhibits tiny garnet grains formed on large plagioclase grains, clinopyroxene and quartz (Baba et al. Reference Baba, Owada, Shiraishi, Satish-Kumar, Motoyoshi, Osani, Hiroi and Shiraishi2008). Garnet coronae developed around orthopyroxene and ilmenite also suggest an IBC history. The U–Pb zircon age for this coastal outcrop reveals UHT metamorphism occurring at 660–640 Ma, which is older than that of the inland nunataks. Jacobs et al. (Reference Jacobs, Mikhalsky, Henjes-Kunst, Läufer, Thomas, Elburg, Wang, Estrada and Skublov2020) reported similar metamorphic ages older than 600 Ma from the other lithologies in the Schirmacher Hills and neighbouring exposures.
3. Analytical methods
To determine the bulk whole-rock chemical compositions of the 47 samples, rock slabs of each sample, c. 10 × 10 × 3 cm, were selected to avoid local exotic veins. The samples were ground in a stainless steel mortar to ∼2 mm, and divided by coning and quartering to obtain a 25 g aliquot, which was then pulverized in a quartz ball mill using a FRITSCH Pulverisette 6. Before fusion, all powdered samples were heated at 900 °C for 2.5 h to remove volatiles and oxidize the ferrous iron. These samples were carefully weighed at 1.0000 ± 0.0005 g, thoroughly mixed with 5× excess Li-metaborate, and fused to form a glass bead in an induction furnace using a TK-4200 Bead Sampler (Tokyo-Kagaku Co., Ltd) by heating in several stages: first at 800 °C for 2 min, then at 1200 °C for 2.5 min and, finally, swing heating at 1200 °C for 3 min. The whole-rock element contents were determined using a SHIMAZU-1800 X-ray fluorescence (XRF) spectrometer instrument at the University of the Ryukyus, equipped with a Rh-tube operated at 60 kV and 50 mA. The XRF analytical procedure described by Shinjo & Miyamoto (Reference Shinjo and Miyamoto2007) was followed. Raw X-ray intensities were converted to concentrations using a calibration curve that was prepared using 14 natural and synthetic standards. The theoretical coefficients for the matrix correction were calibrated using the attached standard software (PCXRF ver. 1.11).
Trace and rare earth elements (REEs) of 36 selected samples were analysed by inductively coupled plasma mass spectrometry (ICP-MS) and by instrumental neutron activation analysis (INAA) at Activation Laboratories, Canada (code 4B2-research + 4BINAA).
4. Sample description
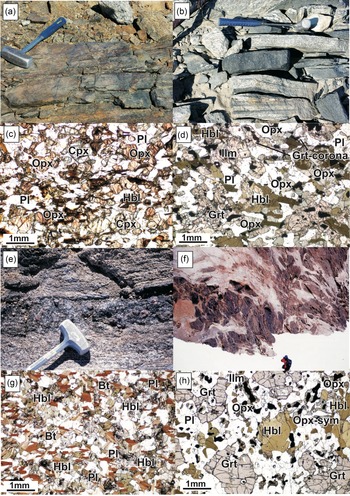
A total of 47 mafic gneisses from central DML were selected for analysis (Fig. 3a, b, e, f). Table 1 lists the mineral assemblages of the analysed mafic gneisses. The mafic gneisses have various assemblages: hornblende, clinopyroxene, orthopyroxene, garnet, plagioclase, quartz, secondary biotite and cummingtonite with accessory minerals of Fe–Ti oxides, apatite, titanite and calcite (Fig. 3c, d, g, h). There were slight differences in the abundance and occurrence of the constituent minerals among the sampling areas.
Occurrences of mafic granulite/gneiss and photomicrographs of analysed rocks. (a, b) Mafic granulite/gneiss layers occurring concordantly with host felsic gneisses in the Schirmacher Hills. (c, d) Photomicrographs of samples S5 and S8. (e) Mafic granulite occurring as a continuous layer in the layered gneiss unit in Filchnerfjella. (f) Mafic gneiss blocks in the leucogneiss unit in Filchnerfjella. (g, h) Photomicrographs of samples F9 and F18. Length of the hammer head for scale is 12 cm.

Relative mineral abundances of analysed samples

Sym – symplectite; Sec – secondary; abundance: +++ > ++ > + > – ; n – not present.
In Filchnerfjella, mafic gneisses mainly consist of hornblende, orthopyroxene, biotite, plagioclase and quartz, and are occasionally associated with garnet or clinopyroxene. Orthopyroxene occurs as fine grains between garnet and hornblende and sometimes occurs as symplectite with plagioclase and coronae around the ilmenite. Garnets and clinopyroxene were not detected in the same sample. Detailed petrographic descriptions of the mafic rocks in Filchnerfjella have been presented by Owada et al. (Reference Owada, Baba, Läufer, Elvebold, Shiraishi and Jacobs2003).
In the Schirmacher Hills, garnet, orthopyroxene and biotite dominate the mafic gneisses/granulites, and hornblende and clinopyroxene are subordinate. Cummingtonite occurs as a secondary mineral, replacing orthopyroxene and clinopyroxene in many samples. Most garnet occurs as irregularly shaped grains and sometimes as coronae around the ilmenite and orthopyroxene.
Samples from Jutulsessen lack the orthopyroxene–clinopyroxene association. However, orthopyroxene symplectite develops; replacement of garnet and hornblende is similar to Filchnerfjella. In Hochlinfjellet, garnet-clinopyroxene-bearing mafic rocks are rare, but orthopyroxene symplectite was observed in one sample (Baba et al. Reference Baba, Owada, Shiraishi, Satish-Kumar, Motoyoshi, Osani, Hiroi and Shiraishi2008).
5. Results
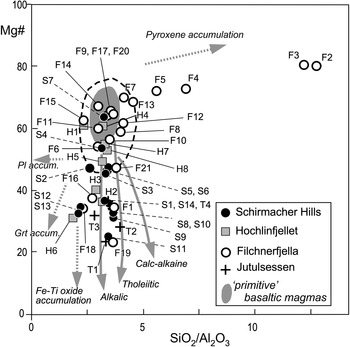
The chemical compositions of the mafic gneisses/granulites are listed in Table 2 and online Supplementary Material Table S1. The Mg number versus SiO2/Al2O3 diagram (Kempton & Harmon, Reference Kempton and Harmon1992; Kempton et al. Reference Kempton, Downes and Embey-Isztin1997) for the mafic gneisses in central DML is shown in Figure 4. In general, the progress of magmatic differentiation and the accumulation of Fe–Ti oxides causes a decrease in the Mg number. The SiO2/Al2O3 ratios reflect the magmatic fractionation series: alkalic, tholeiitic and calc-alkaline. These ratios increase with pyroxene accumulation and decrease with plagioclase accumulation. Primitive basaltic magmas plot in a narrow field, as shown in Figure 4 (Kempton et al. Reference Kempton, Downes and Embey-Isztin1997). These data around the primitive basaltic magmas within a range of Mg no. = 42–70 and SiO2/Al2O3 = 2.5–5.0, represented as a dashed solid line, are used in subsequent discrimination diagrams in the later discussion.
Selected whole-rock compositions of the mafic gneisses and granulites in central DML

Fe as Fe2O3. Detection limit of ICP-MS is listed in parentheses.
Mg number versus SiO2/Al2O3 diagram for the mafic granulite/gneiss. The grey field represents ‘primitive’ basaltic magmas; grey arrows show differentiation trends of tholeiite and calc-alkaline. The dashed grey arrows showing the generalized direction of compositional change with accumulation of the indicated mineral phases are from Kempton & Harmon (Reference Kempton and Harmon1992) and Kempton et al. (Reference Kempton, Downes and Embey-Isztin1997). Data plotted inside of the dashed circle were used for discrimination.

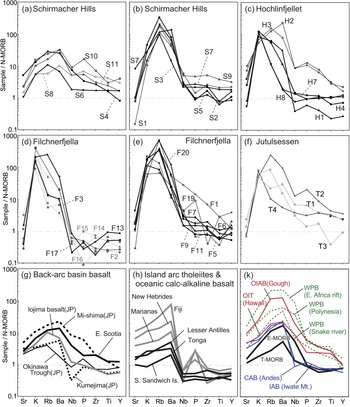
The normal mid-ocean ridge basalt (N-MORB)-normalized trace-element patterns and chondrite-normalized REE element patterns for the analysed samples are shown in Figures 5 and 6. The compositional data range of SiO2 is from 42 to 52 wt %. The grey lines represent the data belonging to the ultra-basic compositions (SiO2 = 42–45 wt %). Two types of trace-element patterns were found in the Schirmacher Hills: one is low to moderate K, Rb and Ba enrichment (e.g. S4, S6 and S8 in Fig. 5a), and the other is high enrichment (S2, S3 and S5 in Fig. 5b). Both types showed a flat pattern or slight decrease from Nb to Y. Some samples displayed negative P and Ti anomalies (Fig. 5b). Trace-element patterns for the mafic to ultramafic rocks from Filchnerfjella are characterized by high large ion lithophile element (LILE) (K, Rb and Ba) enrichment and a flat to slight decrease in the high-field-strength elements (HFSEs) (Fig. 5d, e). Low abundances of HFSEs compared to N-MORB (Fig. 5d) were observed in some Filchnerfjella samples. Except for the ultramafic rock, these patterns resemble island arc and continental arc basalts (Fig. 5h, k). Hochlinfjellet and Jutulsessen had similar abundance patterns (Fig. 5c, f). The trace elements in H4, H7 and H8 are almost identical to N-MORB with respect to the Nb to Y contents (Fig. 5c).
N-MORB-normalized trace-element concentrations in the mafic granulite/gneiss. (a–f) This study. (g, h, k) References for basaltic rock in various tectonic settings. Data for Iojima (Japan: JP), Okinawa Trough (JP) Mi-shima (JP) and Kume-jima (JP) are taken from Ito & Shiraki (Reference Ito and Shiraki1999 and references therein). E. Scotia is taken from Saunders & Tarney (Reference Saunders and Tarney1979). Abbreviations: CAB – continental arc basalt; E-MORB – enriched mid-ocean ridge basalt; IAB – island arc basalt; OIB – oceanic island basalt; OIAB – oceanic island alkali basalt; OIT – oceanic island tholeiite; T-MORB – transitional mid-ocean ridge basalt; WPB – within-plate basalt. Normalization factors from Sun & McDonough (Reference Sun, McDonough, Saunders and Norry1989).

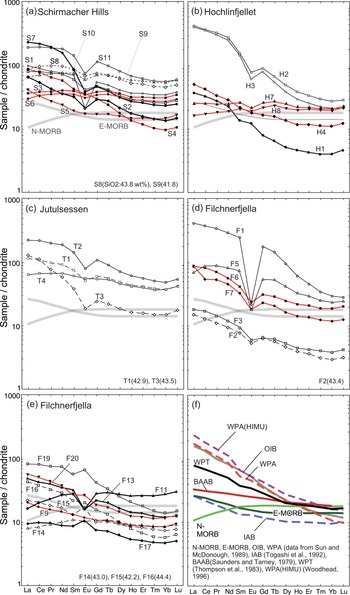
Chondrite-normalized REE patterns. (a–e) This study. (f) Reference data for normal mid-ocean ridge basalt (N-MORB), enriched mid-ocean ridge basalt (E-MORB), oceanic island basalt (OIB) and within-plate alkali basalt (WPA) from Sun & McDonough (Reference Sun, McDonough, Saunders and Norry1989), island arc basalt (IAB) from Togashi et al. (Reference Togashi, Tanak, Yoshida, Ishikawa, Fujinawa and Kurasawa1992), back-arc basin basalt (BABB) from Saunders & Tarney (Reference Saunders and Tarney1979), within-plate tholeiite (WPT) from Thompson et al. (Reference Thompson, Morrison, Dickin, Hendry, Hawkesworth and Norry1983) and WPA (HIMU) from Woodhead (Reference Woodhead1996). Solid lines represent data plotted inside of the dashed circle in Figure 4. Dashed line is data with a low SiO2 content of between 45 and 42 wt %. Red lines are the data used for the discrimination plots.

The REE pattern (Fig. 6a) for the rocks from the Schirmacher Hills can be divided into several groups: (1) almost flat (S3, S6, S8 and S9), (2) depleted from light REEs (LREEs) to heavy REEs (HREEs), parallel to the enriched MORB (E-MORB) pattern (S5 and S4), and (3) those with negative Eu anomalies (S1 and S2). The rocks from Hochlinfjellet (H7 and H8) and Jutulsessen (T4) showed an almost flat pattern (Fig. 6b, c). Samples from Filchnerfjella are characterized by moderate to high enrichment in LREEs and depletion in HREEs (Fig. 6d, e). Several samples preserved both negative and positive Eu anomalies.
6. Discussion
6.a. Precursors of the mafic gneisses/granulites
We selected the samples likely to have preserved primitive basaltic compositions based on the Mg number versus SiO2/Al2O3 diagram (Fig. 4). Suda et al. (Reference Suda, Kawano, Yaxley, Korenaga, Hiroi, Satish-Kumar, Motoyoshi, Osani, Hiroi and Shiraishi2008) conducted the same selection and reported reliable results even for the high-grade gneisses. The majority of the compositions of the analysed samples plotted either around the compositional field of ‘primitive’ basaltic magmas or corresponded to the tholeiitic fractionation trend. We selected the samples within the dashed circle in the first step here.
Metamorphic rocks, especially high-temperature metamorphic rocks, are considered to undergo various element transport processes caused by a metamorphic differentiation, partial melting and dehydration with increasing metamorphic grade. In the second step, samples with abnormal REE contents, particularly Eu anomalies, were excluded to eliminate the uncertain effects mentioned above. For example, the negative Eu anomaly is presumably influenced by plagioclase-bearing melt loss during high-grade metamorphism. The negligibly affected samples were S3, S4, S5, S6, H4, H7, H8, F6, F7, F9 and F20. Considering those with a SiO2 content in the range of 45–52 wt %, these sample compositions were plotted in several discrimination diagrams to determine the tectonic setting of the precursor mafic rocks.
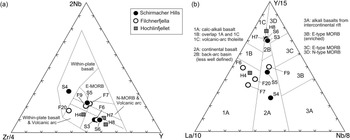
Figure 7a, b shows the Zr–Nb–Y diagram (Meschede, Reference Meschede1986) and La–Nb–Y diagram (Cabanis & Lecolle, Reference Cabanis and Lecolle1989). The analysed samples plotted in a wide range of fields in both diagrams. The Schirmacher Hills samples were seen as a continuous trend through within-plate basalt (WPB), volcanic arc and N-MORB (Fig. 7a), similar to the HFSE depletion of the Northeast Japan arc (Shuto et al. Reference Shuto, Nakajima, Ohki, Uematsu, Watanabe and Yamamoto1995). Other samples from Hochlinfjellet (H7 and H8) plotted in similar fields to samples S3 and S6, but sample H4 was slightly different. Samples F6, F7, F20 and H4 plotted in the field of calc-alkali basalts in Figure 7b. In Figure 7b, samples S3, S6, H7 and H8 plotted in the narrow 2B field, representing back-arc basin basalt (less well defined). Other data plotted in the fields of continental basalts.
Discrimination plots for the selected mafic gneiss/granulite data based on Figures 5, 6 and 7 (see text). (a) Zr–Y–Nb discrimination diagram (Meschede, Reference Meschede1986) for the mafic rocks. Dashed line shows HFSE depletion trend of the Northeast Japan arc (Shuto et al. Reference Shuto, Nakajima, Ohki, Uematsu, Watanabe and Yamamoto1995). (b) La–Nb–Y discrimination diagram (Cabanis & Lecolle, Reference Cabanis and Lecolle1989). MORB – mid-ocean ridge basalt.

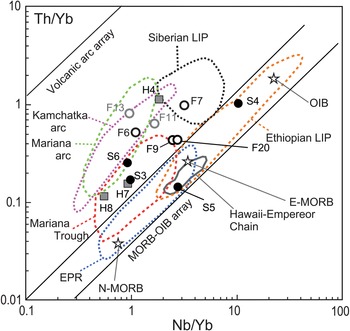
Figure 8 shows the Th/Yb–Nb/Yb diagram (Pearce, Reference Pearce2008), which discriminates between rocks enriched by subduction, crustal contamination and deep crustal recycling. The fields of the different localities of basaltic rocks are shown. The field for the Mariana Trough representing a back-arc setting was obtained from Pearce (Reference Pearce2008). Pearce (Reference Pearce2008) noted that ‘Back-arc basin basalts (BABB) may lie within the MORB–OIB array if the subduction component does not influence the inflowing mantle. However, the compositions were displaced from the MORB–OIB array.’ The data for the mafic gneisses from the Schirmacher Hills plotted over a wide range. Samples S4 and S5 plotted within the mid-ocean ridge – ocean island basalt (MORB–OIB) array fields. Other data for S3 and S6 plotted in the field of the Mariana Trough basalts together with those of H7 and H8. The field represents BABB, and the plotted data were identical, with a slight increase in arc proximity, as in the above note from Pearce (Reference Pearce2008). Sample H4 displayed a high Th/Yb ratio and plotted in the field of arc basalt. Two samples from Filchnerfjella plotted in a narrow range of Th/Yb = 0.4 and Nb/Yb = 2.5. Additional data with slight Eu anomalies (F11 and F13, represented by a grey circle in Fig. 8) plotted in the field of the Mariana and Kamchatka arcs.
Th/Yb versus Nb/Yb discrimination diagram (modified after Pearce, Reference Pearce2008). The fields for the Siberian large igneous province (LIP) (from Desta et al. Reference Desta, Ishiwatari, Sumiaki Machi, Arai, Tamura, Ledneva, Sokolov, Moiseev and Bazylev2015 and references therein); Ethiopian LIP (Beccaluva et al. Reference Beccaluva, Bianchini, Natali and Siena2009); Kamchatka arc (Churikova et al. Reference Churikova, Dorendorf and Worner2001); Mariana arc and Mariana Trough (Pearce, Reference Pearce2008); East Pacific Rise (EPR) (Turner et al. Reference Turner, Beier, Niu and Cook2011); and Hawaiian–Emperor Chain (Huang et al. Reference Huang, Regelous, Thordarson and Frey2005) are shown for comparison. N-MORB, E-MORB and OIB are from Sun & McDonough (Reference Sun, McDonough, Saunders and Norry1989).

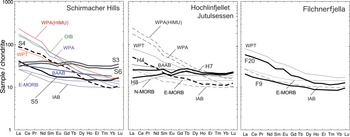
The REE patterns of the selected samples are shown in Figure 9. Samples from the Schirmacher Hills display different patterns: almost flat (S3 and S6), and slightly and highly depleted from LREEs to HREEs (S5 and S4). The REE patterns of samples S4 and S5 are almost parallel to those of the within-plate basalts (WPB, OIB and WPA) and E-MORB, respectively. Similar flat REE patterns of S3 and S6 can be seen in samples H7 and H8 from Hochlinfjellet, respectively. H7 and H8 contain REE abundances between N-MORB and BABB. Samples S3 and S6 were slightly enriched in HREEs compared to that of BABB. Another sample, H4, resembled that of S4. Two samples from Filchnerfjella were almost parallel to island arc basalt (IAB) (F9) and within-plate tholeiite (WPT) (F20). Table 3 summarizes the possible tectonic settings of the protoliths according to the above discrimination.
Chondrite-normalized REE patterns of the selected samples. Reference data and abbreviations are as in Figure 6.

Summary of inferred tectonic setting using different discrimination diagrams

BABB – back arc basin basalt; OIB – oceanic island basalt; WPB – within-plate basalt; IAB – island arc basalt; CAB – continental arc basalt; VAB – volcanic arc basalt; WPT – within-plate tholeiite; OIT – oceanic island tholeiite; WPA – within-plate alkali basalt; IAT – island arc tholeiite; E-MORB – enriched mid-ocean ridge basalt; N-MORB – normal mid-ocean ridge basalt; T-MORB – transitional mid-ocean ridge basalt; Grt – garnet; REE – rare earth elements.
6.b. Tectonic setting and timing
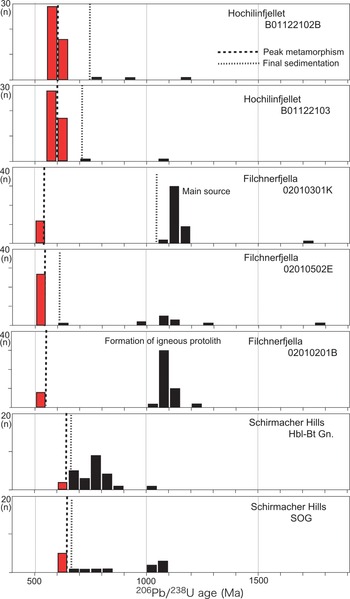
Figure 10 shows a concordant age histogram of the three localities in central DML based on the U–Pb ages published by Baba et al. (Reference Baba, Hokada, Kaiden, Dunkley, Owada and Shiraishi2010, Reference Baba, Horie, Hokada, Owada, Adachi and Shiraishi2015). Ravikant et al. (Reference Ravikant, Bühn and Pimentel2018) and Elvevold et al. (Reference Elvevold, Engvik, Abu-Alam, Myhre and Corfu2020) reported U–Pb zircon age data obtained by laser-ICP-MS and isotope dilution thermal ionization mass spectrometry (ID-TIMS) in the Schirmacher Hills and Hochlinfjellet, although they ignored the internal texture of zircon concerning the metamorphic event, resulting in uncertainty. We referred to reliable data obtained by spot analyses to consider the zircon internal domain (Jacobs et al. Reference Jacobs, Bauer and Fanning2003, Reference Jacobs, Mikhalsky, Henjes-Kunst, Läufer, Thomas, Elburg, Wang, Estrada and Skublov2020).
Age histograms of the zircon concordia ages from three localities in central DML. Data are taken from Baba et al. (Reference Baba, Hokada, Kaiden, Dunkley, Owada and Shiraishi2010, Reference Baba, Horie, Hokada, Owada, Adachi and Shiraishi2015).

6.b.1. Schirmacher Hills
Metamorphism involving UHT and tectonothermal events in the Schirmacher Hills pre-dates other inland nunataks. Based on the geochemical results of Rameshwar Rao et al. (Reference Rameshwar Rao, Rashid and Panthulu2000), Baba et al. (Reference Baba, Hokada, Kaiden, Dunkley, Owada and Shiraishi2010) proposed that the c. 650 Ma UHT metamorphic event in the Schirmacher Hills occurred in a back-arc tectonic setting and pre-dated the main collisional event of central DML (c. 550–500 Ma).
Shuto et al. (Reference Shuto, Nakajima, Ohki, Uematsu, Watanabe and Yamamoto1995) reported that basaltic rocks exposed along the Japanese Sea exhibit geochemical variation. As with the opening of the Japanese Sea, within the development of the back-arc basin, basaltic rock compositions vary from an HFSE-enriched OIB source to an N-MORB source to a highly incompatible HFSE-depleted IAB source (dashed line in Fig. 7a), with decreasing age. Our data show that the geochemical compositions of the mafic gneiss/granulites from the Schirmacher Hills are comparable with WPB/OIB to N-MORB (Fig. 7a), and the trace-element patterns resemble those of the basaltic rocks in the current back-arc setting (Japanese Sea: Mishima, E-Scotia in Fig. 5). A back-arc setting for the mafic rock in the Schirmacher Hills is most likely based on the other discrimination diagrams (see Table 3); therefore, the previous inference of Baba et al. (Reference Baba, Hokada, Kaiden, Dunkley, Owada and Shiraishi2010) is confirmed.
The oscillatory zircon concordant core age from the felsic gneiss (e.g. Hbl-Bt in Fig. 10) and the granitic gneiss in the Schirmacher Hills and adjacent nunatak was c. 800 Ma (Baba et al. Reference Baba, Hokada, Kaiden, Dunkley, Owada and Shiraishi2010; Jacobs et al. Reference Jacobs, Mikhalsky, Henjes-Kunst, Läufer, Thomas, Elburg, Wang, Estrada and Skublov2020). The main protoliths for these basement rocks were formed by magmatism at c. 800 Ma. Jacobs et al. (Reference Jacobs, Mikhalsky, Henjes-Kunst, Läufer, Thomas, Elburg, Wang, Estrada and Skublov2020) proposed that a possible tectonic setting for these basement rocks is an active continental margin setting. However, older zircon ages (>1000 Ma) expected to be derived from a pre-existing older continental origin are lacking (see Fig. 10); hence, a juvenile arc or oceanic arc setting are likely to be alternative settings.
The mafic gneisses analysed here occur as layers and discontinuous blocks. Their timing of emplacement could not be determined owing to subsequent deformation. The analysed samples preserve compositions similar to primary magmatic compositions (Fig. 4) and display minor Eu anomalies, suggesting that they did not suffer significant metamorphic disturbance. We assume that they were emplaced close to the metamorphic peak (c. 650 Ma) in a back-arc setting.
6.b.2. Hochlinfjellet
The geochemical compositions of the two mafic gneisses (H7 and H8) from Hochlinfjellet are similar to those of the Schirmacher Hills. They are assumed to be derived from magmatism in the same tectonic setting. These mafic gneisses were collected from the same locality where the metasedimentary rocks record metamorphic ages of 630 Ma and 600 Ma (Baba et al. Reference Baba, Horie, Hokada, Owada, Adachi and Shiraishi2015). Sample B01122102B contains oscillatory zoned zircons with ages of c. 1.2 Ga, 0.9 Ga and 0.8 Ga, but these older age grains are sparse. Therefore, the contribution of a continental component to the protoliths of the basement rocks is limited. Samples H7 and H8 were collected from the central part of Hochlinfjellet (Fig. 1b), but sample H4 from the southern part has an IAB signature. This geochemical difference is correlated with the differences in metamorphic ages. Jacobs et al. (Reference Jacobs, Bauer and Fanning2003) reported that a basement rock in an inland nunatak of Hochlinfjellet has metamorphic ages of 558 Ma and 530–520 Ma. Based on the difference in metamorphic age compared to the central part (630–600 Ma), Baba et al. (Reference Baba, Horie, Hokada, Owada, Adachi and Shiraishi2015) proposed a possible terrane boundary between them (see line A, Figs 1b, 2b). This terrane boundary is supported by the geochemical differences in the mafic gneisses.
6.b.3. Filchnerfjella
Most of the mafic gneisses in Filchnerfjella showed distinctive Eu anomalies and did not preserve the primary magmatic compositions (Figs 4, 6). The compositions may suggest element mobilization by addition or extraction of partial melt and metamorphic differentiation during the prograde stage. The unaffected samples (F9 and F20) have geochemical affinities with continental or island arc basalt (Table 3). The meta-sediment (02010502E) in the layered gneiss unit (Fig. 2d) contains zircon grains with ages of c. 1800–1700 Ma, 1200 Ma, 950 Ma and 650 Ma (Fig. 10). The protolith of the metasedimentary rock was derived from a mature continental component. The metamorphic ages are well concentrated from 530 to 520 Ma, and the youngest detrital zircon of c. 650 Ma is present (Baba et al. Reference Baba, Horie, Hokada, Owada, Adachi and Shiraishi2015). At the peak metamorphism of the Schirmacher Hills and Hochlinfjellet, the metasedimentary protolith for Filchnerfjella is considered to be the final depositional stage in a continental arc setting. Sample 02010201B is an orthopyroxene-bearing homogeneous gneiss in the brown gneiss unit that possibly originated from c. 1100 Ma igneous rocks. The timing of the emplacement of the mafic protolith is not well constrained. However, we can assume that (1) it was formed coeval with the c. 1100 Ma igneous activity and intruded into felsic igneous rocks in a continental arc, or (2) it was emplaced into the sedimentary rocks at the subduction zone in a marginal continental arc. Samples F9 and F20 were collected from the leucogneiss unit. Similar geochemical patterns were obtained for samples F6, F7, F11 and F13 in the layered gneiss unit (Fig. 2), which involves voluminous layered mafic gneiss (Owada et al. Reference Owada, Baba, Läufer, Elvebold, Shiraishi and Jacobs2003). Combining the wide range of U–Pb ages for the detrital zircons in sample 02010502E from the layered gneiss unit with the disturbed geochemical signature of the mafic gneiss implies repeated magmatic events. They occurred in a continental arc setting to form mafic gneiss protoliths and have continued for a long time. Filchnerfjella lacks an 800 Ma zircon population and has a different geochemical affinity than that of the Schirmacher Hills, implying that they formed in a different geological setting and with different timing.
7. Conclusion
Precursors for the mafic gneiss and granulite in central DML were formed in different geological backgrounds and tectonic settings. The mafic gneisses and granulites from the Schirmacher Hills were derived from basaltic rocks extruded in a back-arc setting. From the perspective of the protolith ages of the basement rocks and geochemical variation, they were emplaced during 800–650 Ma, close to the peak metamorphism without metamorphic differentiation and partial melting that could have occurred during the prograde stage. Similar protoliths were recognized in inland nunataks of Hochlinfjellet. In Filchnerfjella, mafic gneisses/granulites were derived from basaltic rocks formed in marginal continental arcs or island arcs. However, metamorphic processes influenced their geochemical composition during the prograde metamorphic stage. Our results imply that the outcrops in central DML with different metamorphic ages contain mafic gneisses/granulites derived from precursor rocks formed in different tectonic settings. This geological background supports the preliminary terrane division of Baba et al. (Reference Baba, Horie, Hokada, Owada, Adachi and Shiraishi2015). Furthermore, the principle concept supports the tectonic model of Jacobs et al. (Reference Jacobs, Mikhalsky, Henjes-Kunst, Läufer, Thomas, Elburg, Wang, Estrada and Skublov2020), which involves separate tectonothermal events between the Schirmacher Hills and inland nunataks.
Supplementary material
To view supplementary material for this article, please visit https://doi.org/10.1017/S0016756823000092.
Acknowledgements
We thank Y. Osanai and T. Toyoshima for giving us an opportunity to re-visit the Schirmacher Hills during the 49th Japanese Antarctic Expedition at the Sør Rondane Mountains and K. Shiraishi for the arrangement of the Norway–Germany–Japan joint expedition 2001–2002. S. Elvevold and A. Läufer are grateful for their collaboration in the fieldwork during the joint expedition in the inland nunatak of central DML. SB acknowledges R. Shinjo, H, Matsushita and N, Miyagi for their support with XRF analyses at the University of the Ryukyus. We thank anonymous reviewers for constructive comments, and T. Johnson for editorial handling. This work was partly supported by the National Institute of Polar Research [General Collaboration Projects 25–17 and 2–20], the Research Organization of Information and Systems [ROIS-DS-JOINT 004RP2018] and the Japan Society for the Promotion of Science (JSPS) [15K05346 to SB].
Conflicts of interest
None.