1. Introduction
Adult women in developing countries perform most kitchen-related activities at the household level. These key activities include collecting and preparing cooking fuel as well as cooking food (Choumert-Nkolo et al., Reference Choumert-Nkolo, Motel and Le Roux2019). In Zambia, women aged 15 years and older spend an average of 10.6 h per week in the kitchen, compared to 4.4 h for men. Similarly, girls between the ages of 6 and 15 years spend twice as much time in the kitchen as boys, averaging 3.3 h per week (Luzi et al., Reference Luzi, Lin, Koo, Rysankova and Portale2019). The more time women and girls spend cooking, the higher their exposure to indoor pollution.
Moreover, 83 per cent of Zambia's population relies solely on solid or traditional cooking energy solutions (CES). Charcoal and firewood are the primary sources of cooking fuel, while fire stovesFootnote 1 and Mbaula Footnote 2 are the main stoves used for cooking (Luzi et al., Reference Luzi, Lin, Koo, Rysankova and Portale2019). The rural–urban disparities are significant, with only 2 per cent of individuals in rural areas having access to clean cooking energy, compared to over 30 per cent in urban areas (World Bank, 2018). This heavy reliance on solid or traditional cooking energy negatively impacts human welfare, particularly for children, girls and women who are directly exposed to indoor pollution (Foell et al., Reference Foell, Pachauri, Spreng and Zerriffi2011). Morrissey (Reference Morrissey2017) argues that prolonged exposure to inefficient cooking energy has severe health consequences, including respiratory illnesses that can lead to death. Additionally, extended exposure not only affects women's health but also reduces their leisure time (Jeuland et al., Reference Jeuland, Pattanayak, Samaddar, Shah and Vora2020), limits income-generating opportunities, and restricts productive time both at home and outside (Alam and Chowdhury, Reference Alam and Chowdhury2010).
To mitigate the negative effects of exposure to traditional or solid cooking energy, it is essential to empower users to facilitate the transition to improved or modern CES. However, merely having a modern cooking stove is insufficient for achieving clean energy access at the household level (International Energy Agency and World Bank, 2014). Bhatia and Angelou (Reference Bhatia and Angelou2015) argue that access to clean cooking energy should be viewed as a continuum of improvements that encompass both quantity and quality. Consequently, the multi-tier framework (MTF) was introduced to measure household access to cooking energy. The MTF assesses six key cooking energy attributes: exposure, efficiency, convenience, fuel availability, affordability and safety. This approach provides a more comprehensive measure of cooking energy access by categorizing households into overall tiers (0–5) based on their primary cooking energy attributes (Groh et al., Reference Groh, Pachauri and Rao2016).
Therefore, using the MTF dataset for Zambia, this study has three main objectives. First, it estimates the overall effect of household access to cooking energy under the MTF on selected welfare indicators. Second, it examines gender-disaggregated effects to assess how access to CES under the MTF impacts men and women differently. Third, it analyses the effects of accessing CES across different locations, considering the significant rural–urban disparities observed in developing countries.
Two socioeconomic welfare indicators – health and time allocated to various activities among adult household members – are identified as outcome variables. The health outcome is measured by any reported case of respiratory illness in the past 14 days among adult household members (15 years and older). Time allocation to various activities is defined by the time spent on fuel collection and preparation, cooking, and income generation.
This study is organized into seven sections. The introduction forms the first section, followed by a review of related empirical literature in section 2. Section 3 presents household access to cooking energy under the MTF in Zambia, while section 4 discusses the data, welfare indicators, and household characteristics. Sections 5 and 6 outline the empirical estimation strategy and present the empirical results, respectively. Finally, section 7 provides the discussion and conclusion of the study.
2. Review of empirical literature
2.1. Health impacts of traditional vs. clean cooking
Traditional cooking methods, which rely on solid fuels such as firewood and charcoal, have well-documented negative health consequences, particularly in developing countries. Exposure to indoor air pollution from the combustion of these fuels is a leading cause of respiratory illnesses. The World Health Organization estimates that nearly 4.3 million deaths occur annually due to smoke inhalation from solid fuel combustion (Jeuland and Pattanayak, Reference Jeuland and Pattanayak2012). Additionally, Jagoe et al. (Reference Jagoe, Rossanese, Charron, Rouse, Waweru, Waruguru, Delapena and Piedrahita2020) highlight that the time spent collecting, preparing and cooking with these fuels often constrains users from pursuing better opportunities, perpetuating cycles of poverty and limiting social mobility, particularly among women and children who bear the brunt of this burden. Women, especially, are disproportionately affected, as they often walk long distances to gather firewood, resulting in adverse physical health outcomes over time (Cundale et al., Reference Cundale, Thomas, Malava, Havens, Mortimer and Conteh2017).
In contrast, the adoption of clean cooking technologies has been shown to significantly improve health outcomes. Lewis et al. (Reference Lewis, Hollingsworth, Chartier, Cooper, Foster, Gomes, Kussin, MacInnis, Padhi, Panigrahi and Rodes2017) report a 72 per cent reduction in particulate matter and a 78% decrease in polycyclic aromatic hydrocarbons with the use of improved cookstoves in India, which led to fewer hospital visits for acute respiratory infections. Similarly, Smith et al. (Reference Smith, McCracken, Weber, Hubbard, Jenny, Thompson, Balmes, Diaz, Arana and Bruce2011) found that households in Guatemala with improved cookstoves experienced a nearly 60 per cent reduction in carbon monoxide exposure, correlating with a decreased risk of pneumonia, despite no significant reduction in respiratory problems observed by physicians. These studies underscore the health benefits of transitioning to clean cooking technologies, suggesting a reduction in harmful exposures and better health outcomes.
However, not all studies show consistent positive effects. Pillarisetti et al. (Reference Pillarisetti, Vaswani, Jack, Balakrishnan, Bates, Arora and Smith2014) indicates that, in some cases, the health benefits of improved cookstoves are non-statistically significant. These discrepancies are often attributed to improper use and underutilisation of improved cookstoves (Anderman et al., Reference Anderman, DeFries, Wood, Remans, Ahuja and Ulla2015), as well as a lack of awareness about their health benefits (Duflo et al., Reference Duflo, Greenstone and Hanna2008). Such behavioural responses can significantly hinder the effectiveness of clean cooking technologies in reducing smoke inhalation and improving health outcomes.
2.2. Economic impacts of clean cooking technologies
The economic implications of adopting clean cooking technologies are substantial. Several studies have demonstrated that these technologies significantly reduce fuel consumption and associated household expenditures. In Tanzania, Masatsugu (Reference Masatsugu2017) found that the use of improved cookstoves led to notable reductions in firewood consumption. Similarly, Bensch and Peters (Reference Bensch and Peters2015) reported substantial declines in fuelwood use in Senegal following improved cookstove adoption. In India, Lewis et al. (Reference Lewis, Hollingsworth, Chartier, Cooper, Foster, Gomes, Kussin, MacInnis, Padhi, Panigrahi and Rodes2017) observed up to a 91 per cent reduction in firewood use among households transitioning to biogas, liquefied petroleum gas (LPG), or electric stoves. In Peru, Adrianzén (Reference Adrianzén2013) found a 46 per cent reduction in daily firewood consumption. These fuel savings often result in financial gains that households can reallocate to improve other aspects of welfare, such as diet or small enterprise investments. Evidence from India (Jain, Reference Jain2014) supports this, showing how reduced fuel costs can enhance broader economic well-being.
In addition to cost savings, clean cooking technologies have also been linked to improved livelihoods. In rural Indonesia, Hnyine et al. (Reference Hnyine, Sagala, Lubis and Yamin2015) found that lower cooking energy costs contributed to increases in household income and overall welfare. Similar findings from Senegal (Hooper et al., Reference Hooper, Dièye, Ndiaye, Diallo, Sack, Fan, Neuzil and Ortiz2018) reinforce this link between clean energy adoption and improved economic outcomes. Together, these studies underscore the potential for clean cooking technologies not only to improve health but also to reduce household expenses and enhance economic resilience.
2.3. Time allocation and gender dynamics
A critical aspect of clean cooking adoption is its impact on time allocation, particularly for women, who often bear the primary responsibility for fuel collection and cooking in many developing countries. Studies have consistently shown that improved cookstoves can significantly reduce the time spent on these activities. For instance, Krishnapriya et al. (Reference Krishnapriya, Chandrasekaran, Jeuland and Pattanayak2021), examining six developing countries, found that households using improved cookstoves saved an average of 34 min per day. In the context of Bangladesh, Mobarak et al. (Reference Mobarak, Dwivedi, Bailis, Hildemann and Miller2012) similarly noted that time savings from clean cooking technologies can benefit both men and women, with implications for household productivity. Empirical evidence from Senegal (Bensch and Peters, Reference Bensch and Peters2015) and India (Brooks et al., Reference Brooks, Bhojvaid, Jeuland, Lewis, Patange and Pattanayak2016) reinforces these findings, demonstrating reductions in time devoted to fuel collection and cooking following the adoption of clean cooking technologies.
These time savings are particularly meaningful for women, who often have limited access to education and formal employment due to domestic responsibilities. Drawing on research from Nepal, Darlami (Reference Darlami2021) highlights that reducing the burden of fuel collection can enable women to participate more actively in income-generating activities and education, thereby promoting gender equity and empowerment. Overall, by alleviating time poverty, clean cooking solutions contribute not only to household efficiency but also to broader socio-economic development.
2.4. Synthesis of key findings
The empirical literature presents compelling evidence that the adoption of improved cookstoves can significantly enhance user welfare through improved health outcomes, economic savings and time reallocation. However, it also highlights the complexities surrounding user behaviour and the importance of ensuring proper use and awareness of clean cooking technologies. The studies reviewed show that while there are clear benefits, the effectiveness of these technologies often depends on proper implementation, user education, and behavioural change. The International Energy Agency and World Bank (2014) stress the need for a holistic approach that considers various attributes of cooking energy – such as efficiency, affordability and safety – to measure and enhance access to cooking energy (Prah et al., Reference Prah, Carrión, Oppong, Tawiah, Mujtaba, Gyaase, Kwarteng, Ae-Ngibise, Agyei, Twumasi, AGbokey, Asante and Jack2020). Therefore, future policies and interventions should not only focus on technology adoption but also on ensuring that users can maximize the benefits of clean cooking technologies through appropriate usage and awareness-building.
3. Household access to cooking energy under MTF in Zambia
Bhatia and Angelou (Reference Bhatia and Angelou2015) introduced the MTF for measuring household cooking energy access with the objective of capturing multiple attributes of cooking energy access that could inform both policy and investment decisions. The measure is both technology- and fuel-neutral, aiming to capture the underlying factors that affect the user experience. The MTF is based on six cooking energy attributes: cooking exposure, efficiency, convenience, safety, affordability and availability (Luzi et al., Reference Luzi, Lin, Koo, Rysankova and Portale2019). The first two attributes (exposure and efficiency) are technical attributes that define clean cooking energy access, while the remaining contextual attributes capture the household's cooking experience.
Furthermore, each cooking energy attribute is assigned a tier that defines the level of access. There are six incremental tiers (0–5), with zero (0) being the lowest and five (5) the highest. Households assigned to the lower tiers (0–1), based on cooking energy attributes, are those that entirely depend on solid fuels and traditional cookstoves, while those assigned to higher tiers (4–5) use clean primary cooking energy. Intermediate tiers (2–3) offer access to improved cookstoves and significantly more efficient fuels. By adopting Bhatia and Angelou's (Reference Bhatia and Angelou2015) MTF approach to measuring household access to cooking energy, this study assigns households to tiers based on cooking energy attributes.
According to Luzi et al. (Reference Luzi, Lin, Koo, Rysankova and Portale2019), households in Zambia adopt one or more of the three primary sources of cooking fuel: electricity, charcoal and/or firewood. The World Bank/ESMAP (2018) shows that charcoal with traditional Mbaula cookstoves accounts for 48 per cent of primary cooking energy users, while 39 per cent of households rely on firewood with fire stoves. However, 13 per cent of households use electric stoves with electricity as their primary source of cooking energy. This means that 87 per cent of households in Zambia depend on solid fuels as their primary cooking energy.
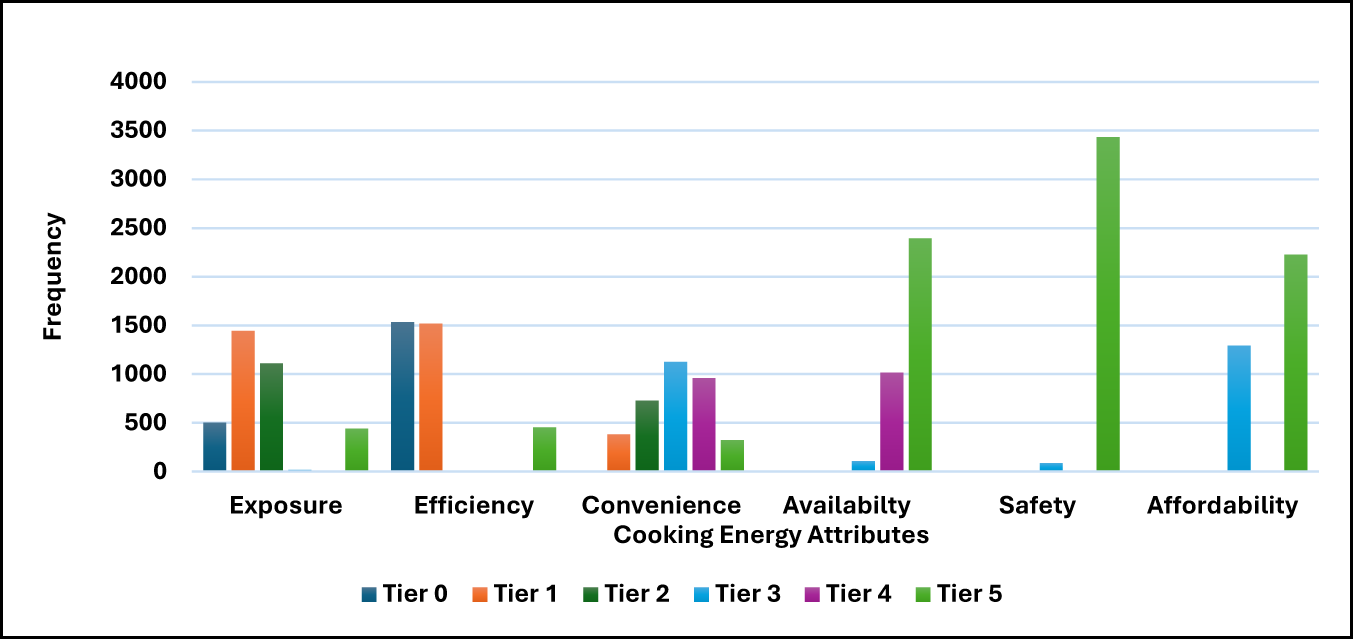
Thus, the overall tier assignment process consists of two steps. The first step involves assigning each household an individual tier for each cooking energy attribute. Each attribute has a decision rule to determine its tier assignment (Groh et al., Reference Groh, Pachauri and Rao2016). The decision indicator used to measure each attribute can be either a binary or a graded system. Figure 1 presents the frequencies of household assignment to individual attribute tiers in the dataset. Note that the study utilized 3,518 households in the assignment of individual tiers and cooking energy attributes.
Household assignment to cooking energy attributes.

From figure 1, the exposure attribute is measured by inspecting the quality of the primary cookstove and cooking area at the household level, rather than using scientific measures of indoor pollution. For instance, households using fire stoves in enclosed rooms are highly exposed to indoor pollution. Improving the ventilation of the cooking area reduces household exposure to indoor pollution, even when using firewood and fire stoves as primary cooking stoves. Similarly, an improvement in the quality of the cookstove (e.g., electricity) can reduce household exposure to indoor pollution, even if room ventilation is poor. Thus, we observe that over 80 per cent of households fall below tier 2 for the exposure attribute, while no household falls into tier 4. Similarly, the efficiency attribute is measured by the quality of the cookstove, its ability to retain heat during cooking, and its combustion efficiency. This attribute is assessed by inspecting the quality of the primary cookstove and its cooking fuel. Figure 1 shows that 86 per cent of households fall into tiers 0 and 1, with none in tiers 3 and 4.
According to Bhatia and Angelou (Reference Bhatia and Angelou2015), the convenience attribute measures the time (in minutes) users spend on cooking fuel preparation or acquiring cooking fuel. Although most households have inefficient cookstoves, they spend less time (less than 7 min) on fuel preparation. We observe that most households fall into the middle tiers (2, 3 and 4), with none in tier 0. Furthermore, the cooking fuel availability attribute is defined by three tiers (3, 4 and 5). When primary cooking fuel is always available, a household is assigned to tier 5, while households with 80 per cent fuel availability per year fall into tier 4. Households in tier 3 have fuel availability below 80 per cent per year. The majority of households fall into tier 5 (64 per cent), indicating that primary cooking fuel is readily available throughout the year.
The last two attributes in figure 1 (affordability and safety) are defined by two tiers (3 and 5). Cooking safety is defined by whether a household has experienced any serious injury in the last 12 months while using the primary cooking stove or fuel. Figure 1 shows that 97.5 per cent of households did not report any serious injuries and fell into tier 5. Finally, the affordability attribute is defined by whether households spend more than 5 per cent of their income on fuel. The majority of households (63.27 per cent) could afford fuel because they spent less than 5 per cent of their income on fuel and thus fell into tier 5.
The second step involves determining the household's overall tier. The overall tier is assigned based on the lowest tier across individual attribute tiers (Groh et al., Reference Groh, Pachauri and Rao2016). The lowest tier of each attribute determines the level of improvement in accessing cooking energy among households. Figure A1 in the online appendix shows the distribution of household assignments to the overall tiers. Given that technical attributes have tiers ranging from 0 to 5, these often determine the overall tier. Households in lower tiers (0 and 1) entirely depend on traditional/solid energy stoves/fuels. The intermediate tiers (2 and 3) indicate an improvement in cooking energy access, as households adopt improved Mbaula and electric stoves with lower exposure and higher efficiency. Households with a minimum tier of 4 across all six attributes have access to modern energy, where biogas, LPG, and electric cookstoves are adopted as primary cooking energy solutions.
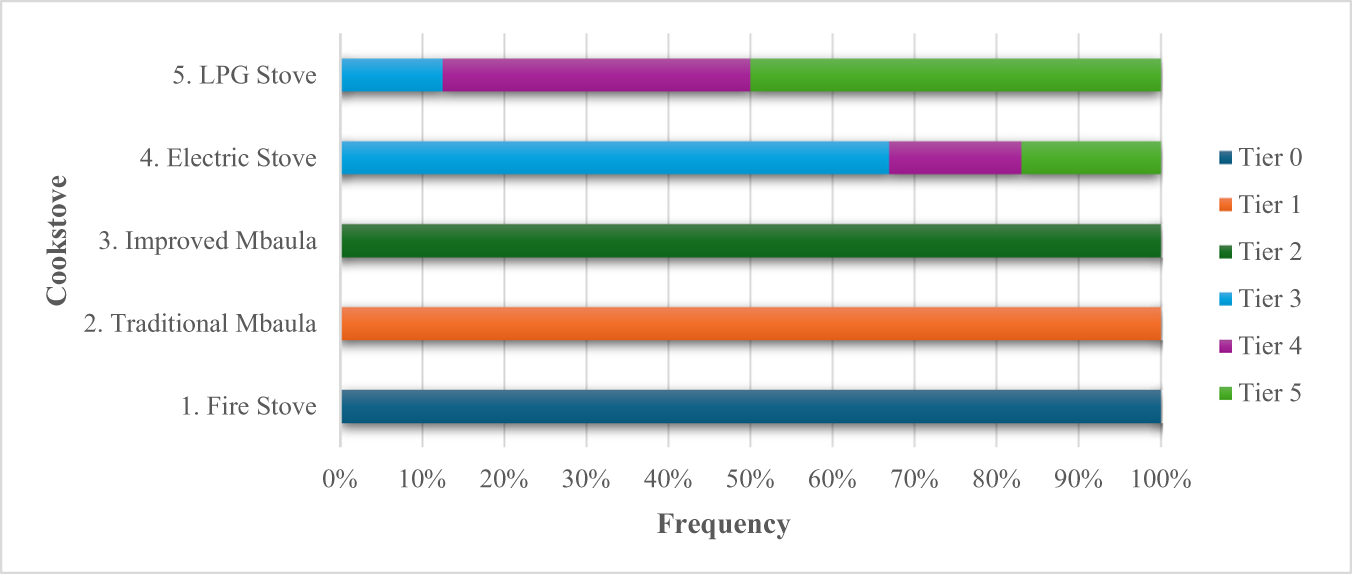
Furthermore, we observe that approximately 87 per cent of the respondents are in tiers 0 to 2, while 13 per cent are in tiers 3 to 5. In rural areas, 96 per cent are assigned to tiers 0 to 2, whereas in urban areas, 79 per cent are assigned to similar tiers. This indicates that a higher percentage of households in urban areas (21 per cent) are in higher tiers, compared to only 4 per cent in rural areas, who have access to improved cooking energy solutions. These individuals rely on charcoal and electricity as their primary sources of cooking fuel, with improved cookstoves, unlike those in rural areas. Figure 2 shows the household assignment to the overall tier based on the cooking stove. We observe that households in tiers 0 to 2 rely on firewood and traditional Mbaula for cooking, whereas households in tiers 3 to 5 rely on electric and LPG stoves.
Household cookstove and overall tier frequency.

4. Data, welfare indicators and characteristics
4.1. Data
The study uses an MTF energy survey on household energy access in Zambia, conducted by the World Bank/ESMAP (2018). The survey was developed to benchmark progress toward achieving SDG 7 by 2030, by monitoring and evaluating energy access and energy poverty reduction through a multidimensional approach (Krishnapriya et al., Reference Krishnapriya, Chandrasekaran, Jeuland and Pattanayak2021).
Therefore, the study focuses on primary cooking energy sources across 3518 households. Furthermore, to address the stated objectives, the study disaggregates data based on gender and location. Of the respondents, 2603 (74 per cent) were male and 915 (26 per cent) were female, reflecting the gender of the household head or knowledgeable representative who participated in the survey.
Regarding rural and urban areas, 1751 households were assigned to rural areas, and 1767 households were assigned to urban areas. Table 1 shows the frequency distribution of the primary cookstove across locations and gender of the household head/representative. The majority of the households in urban areas rely on the Mbaula cookstove, while 80 per cent in rural areas use fire stoves. However, the distribution across gender for fire stoves and Mbaula stoves is similar, with most female household heads/representatives (46.98 per cent) relying on traditional Mbaula stoves, while 44.46 per cent of male household heads/representatives rely on fire stoves for cooking. Despite this observation, the MTF dataset did not capture sufficient individual household contributions to the use of clean energy for cooking. Therefore, the study estimated individual-level effects using household-level cooking energy characteristics. For example, a male individual may be the head of the household, while an adult daughter may be the breadwinner who cooks and makes decisions regarding cooking energy at the household level. Nevertheless, cooking energy expenditure is observed at the household level rather than the individual contribution.
Frequency distribution of primary cookstove across gender and location

Source: Authors’ computations from the World Bank/ESMAP (2018) dataset.
4.2. Welfare indicators and characteristics
As observed in the reviewed literature, a key welfare indicator cited is users’ health-related outcomes. Studies such as Smith et al. (Reference Smith, McCracken, Weber, Hubbard, Jenny, Thompson, Balmes, Diaz, Arana and Bruce2011) and Bensch et al. (Reference Bensch, Grimm and Peters2015) defined health-related outcomes based on the reported incidence of respiratory illness among users of CES. This study adopts respiratory illness as a health-related outcome. The variable is defined as whether an adult household member reported a respiratory illness in the last 14 days. A transition up the tiers entails an improvement in the quality of CES adopted at the household level, with the expectation of a reduction in reported respiratory illness among adult members. Table 2 shows that, on average, 10 per cent of household heads/representatives reported respiratory illness; for females, an average of 7.7 per cent reported respiratory illness, while an average of 3.5 per cent of males reported respiratory illness during the same period.

Studies such as Krishnapriya et al. (Reference Krishnapriya, Chandrasekaran, Jeuland and Pattanayak2021) and Jeuland et al. (Reference Jeuland, Pattanayak, Samaddar, Shah and Vora2020) observed the effect of cooking energy on the time spent on various activities, such as collecting cooking fuel, fuel preparation and cooking. Thus, the second outcome variable is the time allocated to fuel collection and preparation, cooking, and income generation by adult household members. From table 2, household heads/representatives spend an average of 22 min collecting and preparing fuel for cooking. When disaggregated by gender, adult females spend an average of 23.1 min, while adult males spend 18.8 min. For cooking, a female household head/representative spends 79 min, whereas the adult male household head/representative only takes 27 min. This shows that female household heads are exposed to indoor pollution for longer than adult male household heads/representatives because of the daily cooking of food, given that most households rely on solid/traditional cooking fuel. However, an adult male household head/representative spends more time engaging in income-generating activities, with 36 min spent compared to 25 min spent by an adult female household head/representative per day.
In addition to socioeconomic outcomes, the study identified several household characteristics that are included in the first stage (multinomial logit) estimation. These characteristics were chosen based on Caliendo and Kopeinig (Reference Caliendo and Kopeinig2008)’s argument that control variables should be included in multinomial logit estimation if they affect both the outcome variable and the treatment level and that the inclusion of control variables that affect the treatment alone tends to bias the results due to self-selection based on characteristics. Hence, table A1 in the online appendix presents descriptive statistics that include household characteristics and cooking energy practices included in the multinomial logit estimation. The number of rooms represents the quality of the household dwelling. The average number of rooms is 2.7, with a minimum of 1 and a maximum of 15 rooms, excluding the toilet and kitchen, if found inside the house. House ownership is also defined by a dummy variable (1 for yes, 0 for no). The majority (70 per cent) of households own their dwelling, giving them the leverage to construct their kitchen according to their financial capacity. However, the quality of the household dwelling also defines the quality of the kitchen.
Other household characteristics include economic variables such as household income, expenditure, access to financial services, and the price of candles at the district level. The average monthly household income is 2356 Zambian Kwacha (K) (US$235.6), with an average monthly total expenditure of K1624 (US$162.4) and an average of K92 (US$9.2) per month spent on cooking fuel, including charcoal, LPG, electricity and sometimes firewood.
Furthermore, access to financial services enables households to plan their expenditures and use financial institutions for savings and borrowing to acquire improved/modern cooking energy. Access to financial services is treated as a categorical variable (1 – no access, 2 – access to mobile money banking and 3 – owns a bank account). From table A1, most households own a mobile money account, given that, on average, every household owns at least one mobile phone.
Furthermore, four cooking practice variables (fuel availability, monthly fuel expenditure, cooking place, and time taken to prepare the cookstove) are included as control variables in the estimation process. Fuel availability is a categorical variable defined by four levels: always, mostly, sometimes, and rarely available. Most households reported that fuel is mostly available annually. Cooking place is a dummy variable representing whether a household cooks indoors or not, with most households (67 per cent) reporting that they cook inside the dwelling. This may contribute to indoor pollution because most households rely on traditional energy sources (firewood and charcoal). Finally, households spend an average of 6.27 min preparing a cookstove every time they cook a meal, regardless of the type of cooking fuel used.
5. Estimation strategy: application of regression adjustment to propensity scores
This study employs an inverse probability weighting regression adjustment (IPWRA) estimation strategy to estimate the effect of household transitioning across cooking energy tiers. The IPWRA strategy produces unbiased estimates because of its double-robust standard error property. Under this estimation strategy, only one of the two models (the predicted categoryFootnote 3 model – multinomial logit or the predicted outcome model – regression adjustment equation) needs to be specified properly for the estimator to be consistent (Cattaneo et al., Reference Cattaneo, Drukker and Holland2013). Furthermore, the IPWRA approach relies on propensity scores to minimize bias due to the possibility of self-selection across categories levels when observational data are used (Khandker et al., Reference Khandker, Barnes and Samad2009). Hence, the application of specific assumptions regarding the identification of the counterfactual group allows observational data to avoid endogeneity problems due to the lack of randomization in the assignment process (Bonan et al., Reference Bonan, Pareglio and Tavoni2017).
Cautiously, the implementation of the IPWRA strategy involves four stages, with defining tier categories being the first stage. Given that there are six overall tiers, as discussed in section 3, household assignment to tiers is not binary (T > 2), resulting in a multiple/multivalued evaluation. Imbens (Reference Imbens2000) extended binary treatment analysis and referred to it as the generalized propensity score (GPS), to accommodate multiple/multivalued evaluation under the propensity score framework. The GPS allows for the estimation of unbiased causal inferences under the assumption of weak unconfoundedness, assuming that selection into a given category is random and conditional on a set of control variables. Algebraically, the GPS for multiple/multivalued evaluation is defined by
 \begin{equation}r\left( {k,x} \right) \equiv \Pr \left( {T = k{\text{|}}X = x} \right) = E(T\left( k \right)|X = x),\end{equation}
where  $r\left( {k,x} \right)$ represents the GPS, which is defined as the conditional probability of an individual belonging to category
 $k$, given the control variables
 $X$.
After tier category definition, the second stage involves GPS estimation using the predicted model and the multinomial logit estimation approach.Footnote 4 The assignment of a household to a particular tier does not impact the relative probability of choosing another tier, given their household, community and cooking characteristics. The outcome variable in the predicted model (multinomial logit model) is the six tiers (T = 6). Thus, GPS are predicted post-multinomial logit estimation as conditional probabilities for each category. Here, T0 to T5 represent the estimated GPS conditional probabilities for the six tiers. Tables A3, A4 and A5 in the online appendix present the average GPS values for the full sample, gender and location, respectively, estimated across the tiers (0–5).Footnote 5
The process of GPS estimation is based on two basic assumptions: weak unconfoundedness and the overlap assumption. The weak unconfoundedness assumption, defined by equation (2), entails that the potential outcome should be independent of the household assignment to tiers, given that all effects and interactions of true confounders are included in the estimation of the GPS.
 \begin{equation}I\left( k \right) \bot Y\left( k \right)|X\end{equation}
where  $ I \left( k \right) = \left\{ \begin{array}{ll}
1 & if{\text{ }}T = k \\
0 & otherwise
\end{array} \right.$ is the indicator of being assigned to tier
 $k$ while
 $Y\left( k \right)$ is outcome variable. Imbens (Reference Imbens2000) demonstrated that if the assignment to treatment is weakly unconfounded given the covariates, then the treatment assignment will be weakly unconfounded given the GPS, as shown in equation (3):
 \begin{equation}I\left( k \right) \bot Y\left( k \right)|r\left( {k,X} \right).\end{equation}
The inclusion of several relevant individual, household and community characteristics as control variables in the multinomial logit estimation helps reduce self-selection bias at each tier level, thereby making the tier assignment independent of the outcome (Leite et al., Reference Leite, Aydin and Gurel2019). However, relying on observational data means that there is a possibility of excluding unobservable characteristics not included in the dataset, which may influence GPS estimation (Krishnapriya et al., Reference Krishnapriya, Chandrasekaran, Jeuland and Pattanayak2021). For instance, household head/representative cooking characteristics, beyond those included in the dataset, may influence the adoption of clean energy, thus affecting tier assignment and possibly underestimating or overestimating the estimates. Nevertheless, the inclusion of several relevant individual, household and community characteristics as control variables in the multinomial logit estimation helps reduce self-selection bias at each tier level. Key variables such as the quality of the household dwelling, household income, expenditure and cooking energy characteristics signify the household's economic status, which could affect tier assignment and outcome variables.
Furthermore, the GPS is tested for the overlap/area of common support across the six tiers, as defined by equation (4). The area of common support/overlap assumption shows the probability of receiving a given category of the tier and should be positive for all households and tiers (Cattaneo et al., Reference Cattaneo, Drukker and Holland2013).
 \begin{equation} 0 \lt p\left( {{T_i} = k{\text{|}}x} \right) \lt 1{\text{ }}{\text{for all k and i }},\end{equation}
The absence of overlap in the distribution of the observed control variables across the tiers implies difficulties in making comparisons across the average treatment effect on the treated (ATT)Footnote 6 (McCaffrey et al., Reference McCaffrey, Griffin, Almirall, Slaughter, Ramchand and Burgette2013) and is tested using a kernel density plot. For each tier level, the area of common support is estimated across the six tiers, as shown in figure A2Footnote 7 in the online appendix. We observe that the overlap assumption is met, as the conditional probabilities fall within the range of 0 to 1 for each category, ensuring that we have enough households in each tier with similar characteristics. Furthermore, the conditional probabilities for all kernel density plots overlap, allowing pairwise ATT effects across the tiers to be estimated. For instance, the first graph in figure A2 shows a kernel density plot for tier zero, with a sufficient area of common support across the six tiers.
The third stage involves estimating the inverse probability weights (IPW) using the GPS for each tier. The IPW is estimated for each tier as follows:
 \begin{equation}w = 1/{\text{ }}r\left( {k,x} \right),\end{equation}
where  $w$ is the IPW and
 $r\left( {k,x} \right)$ is the GPS. If the GPS is sufficiently estimated, a weighted-based estimator can achieve a semiparametric efficiency bound for the estimation of the average causal effect (Hirano et al., Reference Hirano, Imbens, Rubin and Zhou2000). Table A6 in the online appendix shows that the overall average IPW is 2.441, which is relatively small, while across the tiers, the estimated average weights range from 1.732 to 10.067. Similarly, the overall average IPW for male household head is 2.401 while for female household head is higher at 2.586. Furthermore, rural households have a smaller average IPW at 2.224 relative to 2.671 for urban households. The smaller average IPW indicates that the GPS values estimated in stage two are not small. This implies that the conditional probabilities of individuals being assigned to a given tier are relatively high.
Finally, the fourth stage involves fitting the outcome model (adjusted regression) using the IPW estimated in stage 3, as proposed by Hirano and Imbens (Reference Hirano, Imbens, Gelman and Meng2004). This creates a pseudo-population by averaging individual heterogeneity across tiers. Thus, the outcome model is linear, whereas the predicted model is estimated using a multinomial logit (T > 2). Equation (6) shows the linear adjusted regression model estimated for each outcome and tier level:
 \begin{equation}{y_i} = \alpha + {\beta _i}{X_i} + {\theta _i}{T_i} + {\varepsilon _i},\end{equation}
where  ${y_i}$ is the outcome variables,
 ${X_i}$ is vector of household characteristics,
 ${T_i}$ is the household overall tiers for cooking energy, ranging from 0 to 5, and
 ${\varepsilon _i}$ is the error term. The estimation of equation (6) includes several control variables to account for socioeconomic differences across tiers and outcome variables. The adjusted regression estimates the mean of each tier for specific predicted outcomes. The individual ATTs obtained are then used to estimate the pairwise ATTs across the six tiers, as given in equation (7):
 \begin{equation} ATT_{k1,k2} = E\left[{Y_i}\left( {{k_1}} \right)\right] {-E} \left[{Y_i}\left( {{k_2}} \right) \right].\end{equation}
The pairwise ATT, given by equation (7), shows the average effect of a household being categorised to tier 1 instead of tier 2.
6. Empirical results
After implementing the IPWRA estimation strategy, this study presents the empirical results in this section. The empirical results are divided into three sub-sections: first, the overall effect, followed by the gendered differential estimation, and finally, the urban–rural differential effects.
6.1. The overall effect of household access to cooking energy across tiers
Table 3 presents the results for the overall effect on various welfare indicators using the MTF measure of household access to cooking energy. The estimation utilised a full sample size of 3518 households and the pairwise ATT across the tiers shows a differential effect between each tier. For instance, as the quality of cooking energy adopted at the household level improves, the probability of an adult household head/representative suffering from a respiratory illness decreases. In the lower tiers (1 vs. 0), the effect is positive but not statistically significant. However, as the quality of cooking energy substantially improves, we observe a statistically significant reduction in the probability that an adult household head/representative will suffer from respiratory illness. The probability of experiencing respiratory illness decreases from 9.9 per cent to 4.4 per cent across pairwise ATT effects as households move to higher tiers. The observed diminishing ATT in higher tiers (4 and 5) can be attributed to the minimal differences in the quality of cooking energy (LPG and electricity).
Overall effect of access to improved cooking energy solutions across tiers

Notes: Robust standard error in parentheses. No. of observations = 3,518.
Source: Authors’ computations from the World Bank/ESMAP (2018) dataset.
A similar pattern is observed with time saved from cooking and fuel collection and preparation. The differential effect in the lowest tiers is positive but statistically insignificant. However, the differential effect suggests that moving from tier 1 to tier 2, a household head/representative saves about 37 minutes from cooking due to improved access to cooking energy, with the highest effect being between tier 3 and tier 2, where a household head/ representative saves 44 min every day on average. Furthermore, for fuel collection and preparation, a statistically significant effect is observed in higher tiers. Moving from tier 2 to tier 3, a household saves 18 min; 21.5 min for tier 4 vs. tier 3; and 22.6 min for tier 5 vs. tier 4 among adult household heads/representatives. Here, the differential effect increases as the quality of the cooking energy improves.
Furthermore, the effect on income generation is expected to be positive as households transition from lower to higher tiers. From table 3, we observe a positive increase in the time household heads/representatives allocate to income generation, although the differential effect between higher tiers (tier 5 vs. tier 4) is statistically insignificant. The time an adult household head/representative spends on income generation increases as the quality of cooking energy improves. Across all tiers, the longest time an adult household head/representative allocates to income generation activities, on average, is 44.28 min.
6.2. The gendered effect of access to cooking energy across tiers
The study disaggregated the data into subsamples based on the gender of household head/representative aged 15 years and above and location (rural–urban areas). The estimation in table 4 relied on 2603 male and 915 female household heads/representatives. The results in table 4 suggest that the pairwise ATT of experiencing respiratory illness among females is statistically significant across tiers, except for 3 vs. 2. Meanwhile, for males, three pairwise ATT are statistically significant: 1 vs. 0, 2 vs. 1, and 4 vs. 3, with a 2.2, 3.1 and 2.9 per cent reduction in the probability of being ill among adult males, respectively. However, for female adults, the probability of a respiratory illness decreases by between 1.4 and 3.4 per cent across the tiers as households transition to higher tiers.
Gendered effect of access to a cooking energy solution across tiers

Note: Robust standard error in parentheses.
Source: Authors’ computations from the World Bank/ESMAP (2018) dataset.
With the time saved from cooking, the results in table 4 suggest that female adults save more time relative to males in the statistically significant pairwise ATTs. For instance, in the higher tiers (moving from 5 vs. 4), women save 25 min while men save 9.19 min from cooking. The results for the time saved from fuel collection and preparation suggest that the pairwise ATT is higher for women than for men in the statistically significant tiers. For example, in tier 3 vs. 2, a female adult household member saves 8 min, while adult men save 4 min. In tiers 5 vs. 4, females save 5 more min than men.
Finally, the time allocated to income generation is statistically significant across pairwise ATTs, except for 1 vs. 0 for women and 4 vs. 3 for men at different significance levels. Generally, as the quality of cooking energy increases across the tiers, females spend more time on income generation activities than their male counterparts at the household level.
6.3. Cooking energy and cookstoves sub-sample effects
The study further grouped households into three subcategories based on their primary cooking stoves. The zero (0) category represents households using fire stoves, while category one (1) represents an intermediate category defined by somewhat improved cookstoves, including traditional Mbaula and improved Mbaula stoves. The third category (2) is defined by modern/clean stoves, with households primarily using electric and LPG stoves. Using this categorization, this study estimates the effect of a household transitioning across the three categories on selected household welfare indicators. The aim is to observe whether changes in households’ primary cookstoves affect household welfare indicators and align with the results obtained under the overall and disaggregated gender effects in the previous sections.
Table A7 in the online appendix presents the pairwise ATT results. The results show that transitioning from a fire stove to an improved cookstove, and further to a modern/clean cookstove, improves household welfare indicators among the transitioned households. For instance, when transitioning from a fire stove to an improved cookstove, we observe a 4.5 per cent reduction in the probability of respiratory illness among adult household heads/representatives. Similarly, across gender, an average of a 1.2 per cent reduction in respiratory illness is observed among adult male household heads/representatives. Generally, the results show that the effects across welfare indicators and categories improve as the quality of the cookstove improves. The overall and gendered effects increase as households transition from a fire stove to an electric stove.
In addition, the results in table A7 show that the effects are higher among adult female household heads/representatives relative to male household heads/representatives. For instance, the adult female household head/representative saves 13.9 min, and the male household head/representative saves 12.52 min from fuel collection and preparation as they transition from a Mbaula stove to an electric stove.
6.4. Rural–urban effect of access to a cooking energy solution across tiers
Furthermore, the study disaggregated the sample into rural–urban subsamples with 1767 households residing in urban areas and 1751 households in rural areas. The objective is to observe the effect of multi-tier classifications after controlling for the location and socioeconomic characteristics of the households. The results are presented in table A8 (online appendix).
Households in rural areas experience the largest reduction in the probability of developing respiratory illness as access to CES improves. For instance, when moving from tier 1 to tier 2, a household experiences an average 14.3 per cent reduction in the probability of developing a respiratory illness. However, the average effect decreases from 14.3 per cent to 4.8 per cent in the higher tiers. The reduction in the pairwise ATT in the higher tiers indicates that the improvement in CES has lower emissions, which may contribute to the reduced incidence of respiratory illness at the household level. Furthermore, we observe that the highest time saved in rural areas from cooking a meal per day is 53 min, while in urban areas, the highest time saved is 22.5 min on average. Similar to the probability of experiencing respiratory illness, the time saved on cooking decreases as one moves up the tiers due to the improved quality of the CES adopted.
Studies such as Krishnapriya et al. (Reference Krishnapriya, Chandrasekaran, Jeuland and Pattanayak2021) and Damte et al. (Reference Damte, Koch and Mekonnen2012) found that the time saved from fuel collection and preparation in rural areas is relatively higher than in urban areas. These studies attribute this to the longer time that households take collecting and preparing firewood for cooking, often due to the possibility of deforestation. Thus, from table A8, we observe that time allocated to fuel collection and preparation is statistically significant in higher tiers in rural areas, with the largest reduction of 31.5 min observed between tier 4 vs. tier 3. However, in urban areas, the largest reduction is recorded in the lower tiers (45.26 min) for tier 1 vs. tier 0. Households in urban areas take often longer to find firewood if they are unable to purchase it, due to urbanization. Similarly, results suggest that the effect decreases as households transition from traditional to modern energy solutions for cooking across the tiers. For instance, in urban areas, the time saved decreases from 45.26 min per day to 11.89 min in the higher tiers due to improvements in the quality of household cooking energy. In rural areas, as households transition, the pairwise ATT decreases from 31.5 min (4 vs 3) to 23.37 min (5 vs 4).
Furthermore, the results in table A8 reveal that additional time for income generation activities is significant in the lower tiers in rural areas, whereas in urban areas, the variable is only statistically significant in the intermediate tiers (2 and 3). The differential effect is large in intermediate tiers (2 and 3) and increases in rural areas, whereas in urban areas, the opposite trend is observed on average. In the lower tiers (1 vs 0), an adult household member in a rural area adds an average of 39.13 min per day to income generation activities as they transition from tier 0 to 1, while in higher tiers (4 vs 3), almost an hour is added to income generation activities on average per day. The time saved from collecting and preparing cooking fuel and cooking a meal per day in rural areas may lead to an improved allocation of time to income-generation activities as households transition across tiers. In urban areas, the pairwise ATT decreases from 22.30 min (2 vs 1) to 12.35 min (3 vs 2). Households in urban areas depend on purchased charcoal, while a few rely on firewood. Therefore, efficiency in use is higher relative to firewood, and transitioning upward on the tiers may not add as much time to income generation activities.
Finally, results from table A8 reveal that the effect of transitioning across tiers is larger in both rural and urban areas, although the pairwise ATT is higher among rural households. Households largely depend on traditional fuels and cookstoves for cooking food, and transitioning to improved cookstoves has a greater impact on welfare indicators. For instance, over 85 per cent of households fall between tiers 0 and 1, where the majority depend on firewood and fire stoves. Transitioning from traditional cooking energy significantly contributes to improved health and substantial time savings from fuel collection, preparation, and actual cooking, as revealed by the results in table A8, especially among rural households.
7. Discussion of results and limitations, and conclusion
Several studies have emphasized the importance of households accessing modern CES in terms of various gendered welfare indicators. The estimated gender pairwise ATTs in this study are consistent with the proposition that transitioning from lower tiers to higher tiers leads to households experiencing better outcomes. For instance, the estimated pairwise ATT indicates a reduced probability of experiencing or reporting respiratory illness among users of CES. The overall pairwise ATTs for the likelihood of respiratory illness show a reduction from 9 per cent in the lower tiers to 4.4 per cent in the higher tiers. This trend is attributed to the improved efficiency of cooking appliances and fuel used as households transition through tiers. The reduced exposure to emissions may contribute to a lower differential effect in the higher tiers, as opposed to the lower tiers where households depend entirely on traditional energy for cooking.
Empirical results show a reduction in respiratory illness across genders (male and female household heads) as households transition from lower to higher tiers. Females who participate in cooking daily have a higher probability of developing respiratory illness. In this case, we observe the largest reduction of almost 3.3 per cent in tiers 4 versus 3. This shows that as households transition to higher overall tiers (4 and 5) and adopt modern cooking energy as their primary cooking energy, they experience improved health, as demonstrated by Bhatia and Angelou (Reference Bhatia and Angelou2015).
For rural areas, where a majority of the households rely on firewood and fire stoves, the estimated pairwise ATT values are statistically significant across all tiers except for the lower tier (1 vs 0). The highest possible reduction (14 per cent) in respiratory illness among adult members of households in rural areas is higher than the overall effect observed. Therefore, any improvement in the quality of CES can reduce the risk of respiratory illness among users.
However, the estimated pairwise ATT shows a range of 16–44 min per day saved from cooking, while the time saved from fuel collection and preparation ranges from 18 to 23 min per day. The inclusion of intermediate levels shows that time saved per day increases for fuel collection, preparation and cooking as households transition from solid CES to clean energy. Equally, disaggregating gender, the study found that female household heads/representatives who participate in daily cooking spend more time in the kitchen, and any improvement in cooking energy reduces the time spent in the kitchen. The time saved from cooking is possibly allocated to productive and leisure activities, thereby improving the welfare of the participants.
Furthermore, the overdependence on traditional stoves in rural areas results in more time being saved per day when a household switches to an improved stove. Krishnapriya et al. (Reference Krishnapriya, Chandrasekaran, Jeuland and Pattanayak2021) found similar results in six developing countries after estimating the effect of adopting an improved cookstove on the time saved. The study found that households save 23 minutes per day using pooled data, while across countries, the time saved ranged between 22 and 55 minutes in rural areas. For fuel collection and preparation, results indicate that more time is saved among urban households, ranging from 11 to 45 minutes per day, while in rural areas, it ranges from 23 to 31 minutes per day.
Luzi et al. (Reference Luzi, Lin, Koo, Rysankova and Portale2019) observed that most households rely on traditional energy sources (firewood and charcoal), which negatively affect the time adult household members spend on income generation. Thus, transitioning to improved CES may lead to more time being allocated to income-generating activities, as observed in this study. Creating time for income-generating activities at the household level contributes to an improvement in their livelihood. This study observed that additional time is allocated to income-generating activities in the lower tiers. For instance, female household heads/representatives who are not in formal employment or business, including housewives, may transfer the time saved from kitchen activities to small business activities at the household level. Further, women, who are producers and users of cooking energy – especially when collecting firewood and burning charcoal in rural areas—are constrained from undertaking other economic activities that improve their welfare. Thus, transitioning from traditional/solid fuels to improved cooking or modern energy solutions may not only improve their health and time but also their income or expenditure on other goods and services.
Hence, the inclusion of disaggregated gender outcomes in understanding the effect of access to cooking energy revealed that transitioning across tiers and categories significantly improves welfare indicators of female household heads/representatives. Females’ health and time allocation to cooking, fuel collection, and income-generating activities significantly improve once a household transitions from traditional cooking energy (category 0–1) to intermediate cooking energy (category 2–3) and ultimately to modern cooking energy (category 4–5). Although females are the primary users of cooking energy, they often lack the power to decide on the type of cooking energy to adopt. This is because they are less empowered to make independent decisions at the household level and instead rely on men. The adult male, regardless of whether he is the household head or not, demands to be consulted before decisions are made (Miller and Mobarak, Reference Miller and Mobarak2014), thereby negatively affecting efforts to transition to cleaner cooking energy, despite the economic status of the household. Therefore, female empowerment, including educational attainment that translates into improved earnings through employment, will strengthen their bargaining power, allowing them to make independent decisions regarding cooking energy (Lundberg and Pollak, Reference Lundberg and Pollak1994).
Similar results are observed after disaggregating outcome variables based on household location (urban and rural). Households in rural areas that transition to higher tiers experience welfare improvements, including reductions in respiratory illness. This welfare improvement contributes to poverty reduction as households transition from open fire stoves and traditional stoves (Mbaula stoves) to cleaner and more efficient stoves in higher tiers (4–5). However, closing the disproportionate levels of access to clean cooking energy between rural (2 per cent) and urban areas (30 per cent) requires strong policy efforts by authorities to improve households’ economic status and the availability of affordable clean energy. Low-income levels and limited electricity access among rural households push private electric cooking appliance manufacturers away, leaving the majority of households relying on traditional/solid energy sources for cooking.
In summary, this study highlighted the importance of measuring cooking energy beyond the binary framework to include transitional categories or intermediate tiers. Low income and affordability issues have led most households to transition to intermediate levels instead of moving straight to clean energy sources. Although the effects seem to be small at transitional levels (overall tier 2–3), for instance, the average time saved from cooking is 44 min per day – over longer periods, such as a year, users of intermediate/improved cooking energy can gain 11 days. If this time is allocated to productive activities such as income generation, households can improve their livelihoods. Thus, the study has provided the basis for estimating cooking energy as a continuum of improvement and offers a reference point in policy formulation, as transitioning to higher tiers improves gender outcomes, thereby reducing social inequalities among users of different cooking energy.
Despite the study's significant contributions, several limitations need to be considered when interpreting the results. First, the MTF dataset did not capture individual-level contributions to cooking energy use. As a result, we had to estimate the effects at the household level, which may obscure the nuances of individual behaviours and roles within the household. For example, while a male may be the head of the household, it is often the adult daughter who is the primary cook and decision-maker regarding cooking energy. The assumption that household-level energy expenditure is representative of individual behaviours could affect the accuracy of the estimated effects, especially in cases where there is a disconnect between the head of household and those making decisions about energy use. Therefore, the results should be interpreted with caution, particularly when gendered dynamics or the role of different household members in energy decision-making may vary.
Second, while the study attempts to mitigate potential biases by including several control variables in the multinomial logit estimation, observational data inherently carries the risk of excluding unobservable characteristics that might influence the adoption of clean cooking energy. For instance, household members’ personal preferences, skills, or attitudes towards clean energy adoption are not captured in the dataset but could play a critical role in the transition across energy tiers. The exclusion of such unobserved characteristics may lead to either underestimation or overestimation of the observed effects. Although the inclusion of key variables such as income, expenditure, and dwelling quality helps control for household economic status and reduce self-selection bias, these variables may not fully account for all factors influencing tier assignment and outcome variables. Therefore, while the study provides valuable insights, these limitations must be considered when interpreting the findings, as they might affect the robustness of the estimates, particularly in the context of estimating causal effects.
In conclusion, this study highlights the significant benefits of transitioning to cleaner CES, particularly in terms of improved health, time savings, and gendered welfare outcomes. However, the limitations related to household-level data and unobserved characteristics underscore the need for further research that can capture individual-level dynamics and refine our understanding of the factors driving energy adoption. Policymakers should prioritize reducing disparities in access to clean cooking energy, especially in rural areas, to ensure broader welfare improvements and sustainable development.
Supplementary material
The supplementary material for this article can be found at https://doi.org/10.1017/S1355770X25100119.
Competing interests
The authors declare no competing interests.