Recent bilateral or regional trade arrangements in Europe, the Americas, and elsewhere or GATT's multilateral approach after the Second World War have renewed the debate surrounding different approaches to trade liberalization. In this regard, the historiography advances that the 1846 unilateral repeal of the Corn Laws in Britain was not an overwhelming success in establishing free trade. Indeed, according to classical accounts, the movement towards free trade only spread to the rest of Europe after the Anglo-French commercial treaty (known as Cobden-Chevalier Treaty) in 1860, mostly in the form of subsequent bilateral agreements between other parties.
Experts in nineteenth-century trade policy like Paul Bairoch, John V. C. Nye, Douglas Irwin, and Kevin O'Rourke and Jeffrey Williamson argue that the Cobden-Chevalier treaty was decisive in reducing tariff protection by spreading bilateral agreements containing most-favored-nation (MFN) clauses.Footnote 1 For these authors, Cobden-Chevalier was the key episode in trade liberalization, generating a harmonious period of free trade that compares favorably with the period before the 1860s or even with the more recent GATT era.
Is it really true that Cobden-Chevalier was the turning point for nineteenth-century trade liberalization outside Britain? Authors like Williamson, Paul Sharp, and Giovanni Federico emphasize that liberalization following the repeal of the Corn Laws was not, in fact, exclusive to Britain. The movement to lower tariff duties on agricultural products actually started well before 1846.Footnote 2 Robert Pahre offers an interesting account of the liberalizing treaties in Europe that followed the formation of the German Zollverein in 1834,Footnote 3 although these bilateral approaches were mostly focused on establishing “freedom of commerce,” that is, the possibility to trade internationally on more or less equal terms and reducing discrimination in shipping and related aspects of trading. Recently, Olivier Accominotti and Marc Flandreau have cast doubt on the pathbreaking importance of the Anglo-French treaty.Footnote 4 They establish that trade liberalization, measured by the crude “tariff revenue divided by total import value,” actually made much more progress before 1860 than was generally believed, and suggest that it might have slowed down after 1860. In response to their results, Markus Lampe highlights that many commodities, especially agricultural goods, which otherwise figure very prominently in the historiography of market integration in the nineteenth century, were almost absent from the treaties. The bilateral treaties were instead focused on reducing trade barriers for manufactured goods. In these sectors, duties had been much higher than on raw materials and semi-manufactures well into the 1850s.Footnote 5 However, Lampe focuses almost exclusively on Europe, even if he observes that U.S. tariffs on manufactured goods clearly went up in the same period.
Most comparative studies focus on agricultural tariffs or price differentials or an unclear mix of prohibitive, protective, and revenue-oriented tariffs as reflected by “average tariff measures,” and to a large extent start in 1870. This article identifies the timing of nineteenth-century liberalization and the extent of initial protectionism by measuring the level of tariffs on a representative set of manufactured goods in 41 countries and dependent territories around the world between 1846 and 1880. While ultimately we would like to establish tariff levels for agricultural, mining, and manufactured goods since the end of the Napoleonic Wars, this research starts with manufacturing goods and in 1846.
Even if concerns about agriculture were major obstacles to trade liberalization until the 1840s, protectionist arguments dealt with protecting manufactures to help domestic industrialization. Moreover, there is little in the literature on trade and development since Friedrich List about a protectionist “learning” period for agricultural producers.Footnote 6 Although industrialization only spread to some “Western” countries in the nineteenth century, domestic production of manufactured goods such as textiles, metals, leather, or paper took place all over the world. The tariff structure for these articles, especially for more skill-intensive products, had a major influence on the future competitiveness and comparative advantage of domestic manufacturing.Footnote 7
Manufacturing was central to protection even though it accounted for less than half of total trade in the emerging world economy.Footnote 8 In the middle decades of the nineteenth century, agrarian primary products and minerals had very low tariffs and only some products of tropical agriculture, as well as those converted into alcoholic beverages, were taxed heavily in European countries. Therefore, although by omitting agriculture and mining we do not tell the whole story, we do contribute a decisive piece of evidence on the evolution of tariffs in the period under study. We would have preferred tracing out the full process of the dismantling of mercantilist policies—all the way back to the Napoleonic Wars. Unfortunately information on manufactures' tariffs before 1846 is very limited. It thus seemed better to err on the side of caution and not to include dispersed evidence into a data set that was constructed to provide the largest possible degree of homogeneity across countries and over time.
Our new database includes more than 7,500 data points covering 23 manufactured products, grouped in 11 categories, in 41 countries, colonies, and dominions for selected years between 1846 and 1880. The data set was compiled from the collection of Parliamentary Reports on Foreign Duties (British Board of Trade) and other Parliamentary Papers for several years which capture the changes in specific and ad valorem duties on manufactured products around the world. Specific duties were converted into ad valorem rates by applying British export prices.
British export prices were set in an open competitive market, and presumably to the standard product variety produced and traded internationally—they are the closest possible equivalent to a world market price. For other countries, comparable average prices are either not available (in particular for the “open” but less developed countries of the period) or likely to be influenced by the level of protection that distorted demand for product varieties through the tariff structure.Footnote 9 In general, in view of the limitations of disaggregated price data of sufficient quality for all countries in our sample, we focus on measuring the levels and changes of tariffs that representative exporters were confronted with. We want to leave aside their impact on domestic prices and incentives as might be possible in recent fully specified general equilibrium measures of manufacture protection.Footnote 10 Our approach connects closely to the classic comparative works of the Board of Trade, the League of Nations, and Heinrich Liepmann.Footnote 11
Although our data are mainly drawn from British sources, we believe the figures are representative of the trade barriers that confronted the manufactures' exporters of most countries. Since we do not know the relative weight of our 11 industries in world commerce, this article focuses on presenting unweighted averages over commodity groups for each country. We ranked the 11 industrial sectors for which we calculate ad valorem equivalents according to their relative skill intensity following Tena-Junguito's approach.Footnote 12 Here we focus mostly on the overall picture and only comment briefly on trends in dispersion and skill bias of tariffs.
Overall, even excluding Britain, there was significant and geographically broad trade liberalization in the world before Cobden-Chevalier. Indeed, average tariffs fell during the 1850s, although little of it happened in Northwestern Europe. Subsequently, Cobden-Chevalier affected a substantial share of world trade and reinforced previous unilateral liberalization trends. Nevertheless, the incidence of treaty-making in the 1860s and early 1870s on manufactures tariffs seems to have been an exclusively European phenomenon. Thus, on the one hand, our view of trade liberalization is more optimistic about the period after 1846 than the conventional view as offered by Bairoch, Irwin, and others, who downplay liberalization before Cobden-Chevalier. On the other hand, we show how bilateralism after Cobden-Chevalier served to maintain this earlier liberalization dynamic: countries that did not take part in the 1860s treaty network did not further decrease their levels of protection. The movement to free trade in the middle decades of the nineteenth century required a sequence of different instruments.
WHAT WE KNOW ABOUT WORLD TRADE LIBERALIZATION
The best account of nineteenth-century manufacturing tariffs is still that of Bairoch. He shows that after the Napoleonic Wars, most European countries had either high levels of protection (Denmark, the United Kingdom) or straightforward prohibitions on most manufactured goods (Austria, France, Russia, Spain, and Sweden). Outside Europe, Japan was still under its Sakoku regime of seclusion and the United States had moderately high tariffs. The only exceptions to the high protection rule were the Netherlands (including Belgium), Switzerland, and Prussia; there ad valorem equivalents of customs duties below 15 percent prevailed. By 1875 the United Kingdom had moved to completely free trade in manufactures. It was imitated by many other European countries who enacted very low ad valorem equivalents of customs duties (basically the same countries with low tariffs in 1820 plus Sweden), or at least moderate levels below 20 percent (Austria, Denmark, France, Russia, and Spain). Outside Europe, Japan became almost a free trader, while the U.S. duties increased both during the Civil War and afterwards.Footnote 13
What happened between 1820 and 1875? In the United Kingdom, the political debate between free trade and protection began with the end of hostilities in Europe. At first centered on agricultural commodities, that is, important inputs for labor during the countries' industrialization. The Corn Law of 1815 had prohibited the import of wheat and marked the beginning of a conflict between the interests of agriculture and industry that marked the following decades not only in Britain but on the Continent as well. However, British export manufacturing interests were recognized by the Board of Trade as shown by the Reciprocity of Duties Act (1823) that established reciprocal agreements with foreign governments for MFN treatment of goods and shipping. Irwin supports the idea that all these efforts failed and frustration and discouragement set the stage for the unilateral tariff reforms in the early 1840s that culminated with the repeal of Corn Laws in 1846.Footnote 14 Unilateral conversion to free trade in Britain was not complete because, during the 1840s and 1850s (and also afterwards), imports of exotic products such as tea, tobacco, sugar, coffee, and wine and spirits, were still very heavily taxed representing more than half of total British tariff revenue. The same was true for France.Footnote 15 Furthermore, as Nye pointed out, Britain maintained high tariffs on French wines and spirits.Footnote 16 Britain's policy was to refuse discriminatory bargaining practices. Instead it offered immediately all other countries the benefits of the bilateral negotiations that led to the Cobden-Chevalier Treaty. In those negotiations the British did offer cuts in a restricted number of dutiable goods, such as ironware, leather articles, silk wares, and of course wine, thereby seducing the French.Footnote 17
What was the influence of British liberalism on the Continent before Cobden-Chevalier? Apparently, British liberalization and the significant reduction of transport costs following the development of railways, telegraphs, and shipping industries fostered foreign trade in the rest of Europe. As Bairoch points out, “The Continent's volume of exports, which had grown by 1.9 percent per annum between 1837–1839 and 1845/46, increased by 6.1 percent per annum between 1845–1847 and 1857–1859. For this reason, these years were one of the three most favorable periods for export growth in the nineteenth century.”Footnote 18 Bairoch and Irwin mention a few examples of trade liberalization during the 1850s: the United States, Portugal, the Netherlands, Denmark, and Switzerland, as well as Sweden and Belgium from 1856/57 onwards. These two authors, however, overlook the fact that commerce might have been spurred by the spread of free trade in Continental Europe.Footnote 19 Charles P. Kindleberger highlighted long ago that liberalization on the Continent drew on the British example and Cobden's European travels.Footnote 20
In a recent provocative paper, Accominotti and Flandreau challenge the validity of the conventional chronology of nineteenth-century trade liberalization. They “suggest that there was a period of unilateral pan-European trade liberalization, between 1830 and 1860.” In their view, this process was probably more effective than the new instruments of the 1860s, bilateral trade treaties.Footnote 21
Outside Europe, the story of almost uniform liberalization between 1815 and 1875 requires qualification. In Latin America, most former colonies gained independence after the Napoleonic Wars. Subsequently, they moved away from the mercantilist preferential system and a regional custom union to a more open trade policy. This change reflected both British military and political assistance during their wars of independence moved and the power of pro-commerce coalitions by merchants and plantation owners involved in tropical export trade.Footnote 22 Nevertheless, state-building and recurring wars required fiscal revenue, which these countries' low population densities was heavily dependent on the taxation of foreign goods arriving into the nation's ports.Footnote 23 Setting tariffs to revenue-optimal levels was, in the words of Victor Bulmer-Thomas, “an art, not a science. Furthermore, the existence of numerous tariffs set at different rates—typically between 15 percent and 100 percent—on goods competing with domestic production gave ample scope for special pleading.”Footnote 24 Thus, while the discriminatory Spanish colonial system was quickly dismantled, subsequent tariff reforms left ample scope for local interest groups in industry and handicrafts that could exploit the protectionist side of tariff duties originally increased to raise revenue, leading to increasing protection of domestic manufacturing in the small, but growing markets of Latin American countries. A prominent example is the protection of the textile industry in Mexico, where initially revenue-oriented tariffs soon were accompanied by numerous non-revenue generating import prohibitions.Footnote 25 While comparative evidence on the evolution of tariff rates is scarce, it seems that commercial policy was much more domestically driven than in Europe, where liberalization gained pace through mid-century bilateralism, while the extent of commercial negotiations after the dismantling of the mercantilist system actually slowed down in Latin America.Footnote 26 These observations are actually similar to the evolution of tariffs in the United States, where commercial policy after the American War of Independence was motivated by both separation from the British colonial system and considerations in favor of promoting domestic industrialization in conflict with the interests of export-oriented plantation owners in the South.
Many other formally independent countries could not formulate their commercial policy on their own. Most notably, China, Japan, Turkey and Persia practiced more or less voluntarily an “enforced commercial liberalism,”Footnote 27 meaning that they had tariffs not very different from those of free trade countries like Britain or the Netherlands. Direct military pressure or defeat led to liberal tariff regimes in China due to the Nanking treaty with Britain in 1842 and in Japan following the arrival of the famous U.S. expedition led by Commodore Perry in 1853. Others like Turkey or Persia committed themselves via free trade treaties to abolishing monopolies and prohibitions, thereby reducing tariff rates to very modest levels.
In most of the rest of the world, direct intervention through colonialism was predominant, and policies here also were marked by the dismantling of mercantilist policies. British colonial trade policy in the nineteenth century before 1846/49 underpinned a reciprocal preferential system and shipping monopoly between metropolis and colonies. The regime discriminated against foreign powers, as evidenced by the Indian example where more than 99 percent of total imports came from Britain and its other colonies. After 1846 and the repeal of the Navigation Acts, something similar to a free trade period began for most colonies, leading to “an open door policy […]. But from this date, the difference in trade policy between the so-called Crown colonies and the self-governing colonies (Canada, Australia, and New Zealand) became much more important. Most of these self-governing colonies did not follow the British road to liberalism and adopted relatively protectionist trade policies.”Footnote 28 While tariffs for most British colonies were set at low rates and remained so during the rest of the nineteenth century, the initially very low rated of self-governing colonies—between 2 and 6 percent—changed from the mid-1850s in Australia—especially in Victoria—, but also in Canada, where there is also evidence of industrial protectionist tariffs being levied in those years.Footnote 29
This short review of the literature on trade policy marks the agenda for the remainder the article: Some countries exhibit a liberalizing trend following from the dismantling of mercantilist Old Regime institutions, but the process has different degrees depending on the need propensity to protect domestic manufacture and to raise revenue. Thus both levels and extent of liberalization seem to differ substantially across countries. Therefore, in the following section, we group the different countries into “clubs” and compare levels and trends in tariff levels. Thereby we establish a more systematic picture than the existing literature, both regarding sample size and granularity and comparability of tariff-level estimates.
A NEW DATABASE ON MANUFACTURING TARIFFS AROUND THE WORLD
Nearly all previous quantitative studies on trade liberalization in the nineteenth century have used evidence on grain tariffs, average tariffs, import/GDP ratios, or trade growth, the work by Bairoch discussed in the previous section being the only major exception. Therefore, they do not offer micro-evidence for exogenous comprehensive trade liberalization. Only Lampe develops a database for tariffs on manufactured products for seven countries in selected years during the period 1859–1875.Footnote 30
To construct a comprehensive data set of tariffs on manufactured goods around the world, we take advantage of the British government, especially the Board of Trade's interest in trade institutions around the world. It lead to the publication of large surveys on the state and evolution of foreign commercial legislation in Parliamentary Papers from the collection compiled in John MacGregor's five- volume Commercial Statistics published in 1850, to the famous 1903 Memorandum (with Tabular Statements) on the Comparative Incidence of Foreign and Colonial Import Tariffs on the Export Trade of the United Kingdom. Footnote 31 These reports provide exhaustive tables on foreign manufacturing tariffs by countries and products. The data presented here for individual years between 1846 and 1880 are mainly based on a report prepared by the Board of Trade under Sir Robert Giffen on Rates of Duty (foreign and colonial) on British Manufactures or Produce in a large number of countries and colonies in 1860/61, 1870, 1875, and 1880. The data were extended back to 1846 using MacGregor, his underlying reports in the Parliamentary Papers, several updates of the latter, as well as data compiled by contemporary authors, original trade statistics of Austria-Hungary, Belgium, Denmark, the Netherlands, and the Zollverein, and information from Prussian official sources in their official commercial periodical Preussisches Handels-Archiv, often compiling information from similar publications in other countries.Footnote 32
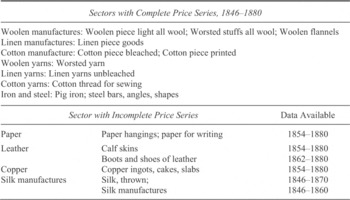
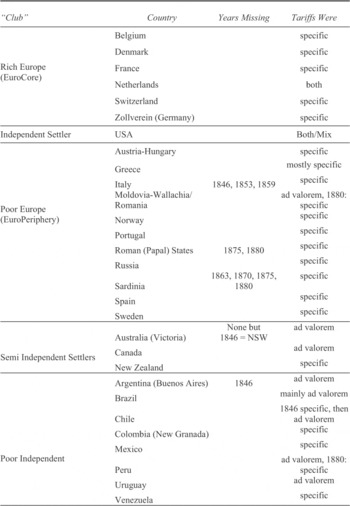
Using these sources allowed us to fully cover the trade regimes for our 11 commodity groups (see Table 1) for almost all countries in most of the benchmark years 1846, 1853, 1859, 1863, 1870, 1875, and 1880. Our database also contains many data points for years between these benchmark years, but we have not used them at this stage to ensure full comparability over time. However, in the future we hope to be able to provide complete time series, a task that basically depends on identifying the date (year) of the modification of all individual tariff rates covered in the benchmark years.
The “britanocentrism” of our sources implies that the rates we report are for British manufactured products. This is important for 1846, when the preferential system for British products in the colonies was still in force. Even then the impact would be modest, as preferential tariffs for British colonies were abolished between 1849 and 1853. Bilateralism returned after 1860, when treaties following Cobden-Chevalier established “conventional tariffs” (based on “tariff conventions,” that is, bilateral treaties) that were lower than the “autonomous tariffs,” a country's customs legislation imposed on non-treaty partners' imports. As Lampe has shown, fears of discrimination accelerated the spread of bilateralism after 1860, so that the unconditional most-favored-nation clause quickly generalized the benefits of initially bilateral treaties. At most then, a country's exporter would have had to wait until 1870 to experience the lower rates available to British exporters in 1863.
CONSTRUCTION OF PRICE SERIES

Note:
The missing data are extrapolated using a variety of Sauerbeck's indices. The paper series and leather series are extrapolated back using the “Grand Total Index” in Sauerbeck, “Prices”, app. D, p. 648; For copper prices, the “Copper” series, ibid., app. C, no. 22, p. 645 was used. Prices for silk, thrown were extrapolated to 1880 using the “Silk” series; ibid., app. C., no. 34, p. 646. Prices for silk manufactures were extrapolated based on our series of “Silk, thrown” for years with missing data.
Source:
See the text.
In most places and years, tariffs were imposed as either ad valorem rates or as specific duties even though sometimes they appeared as a combination of both (see Table 2).Footnote 33 Specific duties were denominated as monetary values for a certain national unit measure of volume, area or weight for which English equivalents were usually provided.Footnote 34 Thus the first challenge was to convert these specific duties into ad valorem equivalents comparable across countries and over time. Doing so requires prices. Given the number of products involved, we could not match specific duties with prices perfectly. First, we organized the data into 11 sectors following recent work by Tena-Junguito.Footnote 35 These sectors represent the bulk of manufactures traded and span products of different skill intensities. Secondly, we collected the quantities and values of exports from the British trade statistics for the corresponding products or groups from 1846 to 1880. Thirdly, we computed implicit prices (unit values) for all these products (23 in total) and averaged them out within each sector. Fourthly, we extrapolated some price series back to 1846 or forward to 1880 using Augustus Sauerbeck's series.Footnote 36 Finally, we divided all specific duties by their respective prices or, whenever missing, by their respective average sector prices.Footnote 37
We acknowledge that by applying British export prices, we bias the ad valorem tariffs upwards. Indeed, using British prices assumes that the F.O.B/C.I.F. price differential was low for most manufactured products according to recent estimates, which is justified by their above average value-to-weight ratio.Footnote 38 In addition, it is far from clear whether ad valorem tariffs were always levied on C.I.F. prices, or whether F.O.B. invoice values were sometimes used. As noted in the introduction, this implies that our data set is a better measure of barriers for exporters than of protection for import-competing domestic producers.
Our main argument for the use of British export prices is that they offer better relative price estimates than the more or less arbitrarily fixed import values reported in many official statistics of less- developed countries. As we noted earlier, they are also less distorted by trade barriers than the import prices of countries that applied tariff barriers against British manufactures or prohibited the importation of a significant number of product varieties, as was the case for example in France before 1860.Footnote 39 Finally, British export prices do correspond best to the product variety/quality for which we have collected specific tariffs, so that we see no viable alternative to using them if the data set is expected to be consistent over time and comparable between countries.
Additionally, some countries, namely Spain and Mexico, imposed prohibitions on entire commodity groups.Footnote 40 Without assigning them some tariff level, we could not include them in our estimates of average protection, leading to downward-biased estimates of their levels of protection. However, there is evidence that these prohibitions, as well as very high “super tariffs,” induced smuggling in many countries such as Colombia, Mexico, and Spain, thereby partially neutralizing their formal purpose.Footnote 41 Since our main objective is to measure exogenous changes in commercial policy, not endogenous changes in the effects of protectionism, we assigned a rate of twice the specific or ad valorem rate for the first period when imports were allowed, for all prohibitions. In other words, we take abolishing a prohibition to be equivalent to halving a prohibitively high tariff. This approach was inspired by a circular of the Spanish customs authorities (5 July 1864), which decided —that while the import of knitted cottons was prohibited, when they were declared bona fide for importation, they could be imported paying twice the duty for the corresponding woven cottons.Footnote 42
Another problem stems from the extremely high tariff rate calculations which arise from prohibitions of imports of lower value items in a commodity group (such as low count cotton yarn in France before Cobden-Chevalier and many items in Russia before 1859), while tariffs apply to high-value varieties but are divided by the relatively low unit value of British exports.Footnote 43 If our calculated duties were higher than 300 percent, we have applied a cap and set the value to 300 to avoid distortions. In all, this involved coding of equivalents of nine prohibition data points and application of the 300 percent cap in nine cases, all heavily clustered in 1846 and 1853 and in few countries.Footnote 44
From the rates obtained for the 11 individual groups, we have calculated unweighted average tariffs for each county by period, following the tradition of the Board of Trade itself, the League of Nations, and Liepmann.Footnote 45
The database covers a wide geographical area, encompassing most regions of the world. Its 41 countries and dependencies were organized into six groups: “Rich Europeans,” “Poor Europeans,” “Independent New Settlers” (that is, United States), “Semi-Independent New Settlers” (Australia, Canada, and New Zealand), “Independent Poor” (Latin American countries), and “Dependent Poor” (including colonies and independent, but compulsory liberalized countries like China, Japan, Turkey, Morocco, Tunisia, and Zanzibar). This classification is arbitrary but it follows an explicit criterion: we define as poor those countries with a 1870 GDP per capita less than half the United Kingdom's (the richest country in the world), according to Angus Maddison.Footnote 46 See below how countries were allocated into these six groups. In the following section, we present the unweighted average of the average tariffs of each group. Table 2 shows for which countries we have full data and in which of our seven benchmark years.
When aggregating all countries into a world average, we have opted for the calculation of a weighted average, using shares of world trade or population in 1879. Each country's share in world imports in 1879 according to Robert Giffen.Footnote 47 This is the most detailed estimation of the geographical division of world trade (including colonies) for the period under study, and a better alternative to the conventional contemporary GDP estimations, at least in the case of poor countries. Each country's share of world population was taken from Maddison.Footnote 48 All in all, our database permits an evaluation of tariff protection around the world from 1846 to 1880, thereby highlighting the possible effects of Cobden-Chevalier, or their absence.
HOW MUCH TRADE LIBERALIZATION HAPPENED IN THE WORLD?
In this section, we focus on comparing country club and world trends in tariff levels and changes between 1846 and 1880, with special attention to the periods before and after the Cobden-Chevalier Treaty of 1860. Although national episodes are extremely interesting, a systematic comparison is outside the scope of the present article.Footnote 49
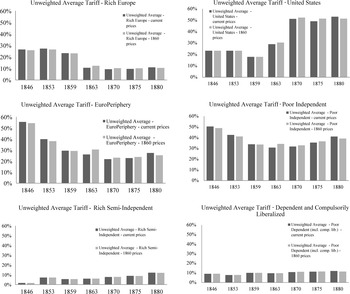
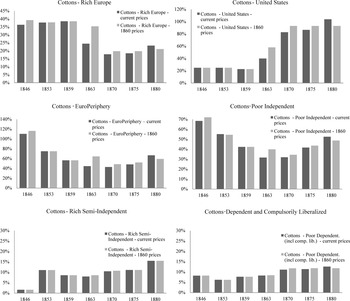
Figure 1 shows a surprising variety in tariff levels and movements between country clubs and over time. It shows that Cobden-Chevalier was an exclusively European phenomenon. On the Continent, the average tariff moved very little during the late 1840s and 1850s and then fell from 23.3 percent in 1859 to 10.6 percent in 1863 and 9.3 percent in 1870. We can also see that, at least as early as 1853, a trend away from high tariff barriers was underway. Moreover, this trend was more pronounced in the poorer countries of the European periphery and Latin America than in the European core of the world economy. This trend towards lower trade barriers was also shared by the United States with the relatively liberal 1857 tariff.
DATA AVAILABILITY


Notes:
Moldavia and Wallachia had identical tariff rates before the united as Romania; Sardinia refers to all of Piedmont-Sardinia. The last column informs whether tariffs were levied in ad valorem (percentage of value) or specific (rate per unit of weight or volume) form. “Both” means that some commodities were rated ad valorem, others not. “Mix” means that at least some commodities were subject to tariffs that had a specific and an ad valorem component.
Sources:
See the text/authors' own work.
The impact of Cobden-Chevalier in the European periphery was, however, much smaller and limited to some countries (Scandinavia, Austria, the Italian States, and, later, Spain). Some of these did not liberalize so much through treaties, but by making unilateral reforms (especially Spain), while Portugal, Russia, and Greece followed the tide only reluctantly or not at all. Also, while the European periphery “liberalized” before and after 1860, actual duties remained on average much higher (in 1859, 19.5 percent; in 1870, 21.8 percent) than in the European core. In fact, tariffs on the southern periphery after 1860 are similar to those of the European core in 1859. In contrast, Scandinavian countries changed from a more peripheral to a more core pattern over time and by 1870 their average tariffs had dropped all the way to 7.6 percent for Norway and 10.3 percent for Sweden in 1870.Footnote 50 Italy (8.7 percent) also followed a similar pattern.Footnote 51 After 1870 Europeans went in reverse. As a result of national industrialization policies, trade protection increased. This time, however, the process was more severe in the poorer periphery than in the richer core. There the average level only increased to 11 percent in 1880.
UNWEIGHTED AVERAGE TARIFFS COMPUTED WITH CURRENT AND CONSTANT 1860 PRICES, 1846–1880

New Settlers (the United States as well as the increasingly self-governing British colonies, although to a much lesser degree) and Latin American countries (Poor Independent) actually show an increase in tariff levels after 1860, clearly indicating that European liberalization, including Cobden-Chevalier were of little importance to them. In Latin America, average tariffs fell from 50.5 percent in 1846 to about 30.8 percent in 1863, only to increase again, to 41.1 percent in 1880. These countries were more susceptible to altering their duties to meet domestic fiscal imperatives. After years of political instability, central governments could only turn to foreign trade support their growing fiscal needs. Tariff levels followed political cycles. Finally, the colonies, dominions, and formally independent states subject to what Bairoch named “compulsory economic liberalism” confirm the conventional wisdom. Their average rates were below 10 percent in all periods for almost all countries and the impact of self-governance in Australia, New Zealand, and Canada was small. The Dutch East Indies did have a 20 percent average in 1846, and Cuba, a colony of high-tariff Spain, was the only one where rates rose from 26 percent in 1846 to 70 percent in 1880. In fact, Cuba behaves quite like the newly independent former Spanish colonies.Footnote 52
Since most nineteenth-century tariffs were specific duties denominated in national currencies, it is important to investigate whether tariff protection changed over time because of conscious decisions of governments to modify these specific duties or whether this process was more the result of constant duties and changing prices. When we recomputed the average tariffs using prices fixed at 1860—see Figure 1—a few changes appear. To be sure, the levels change slightly and any decline in protection in the European core before 1860 and in the poor periphery between 1859 and 1863 disappears. Thus it is likely that the increase in textile prices due to the American Civil War helped to moderate protection in those years even if governmental policies, rather than movements in prices, shaped the picture.
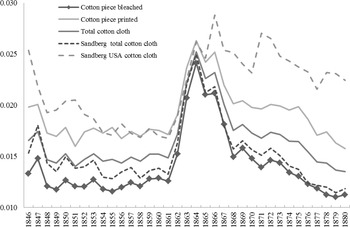
One area where prices mattered was textiles, especially cottons. Figure 2 shows the comparative evolution of the prices for bleached and unbleached and for dyed and printed piece goods of cotton manufacture price in our database versus the well-known cotton cloth prices collected by Lars G. Sandberg (that should be an average of bleached and unbleached and printed and dyed cotton piece goods also from British export statistics).Footnote 53 Sandberg's price in 1846 and 1853 is almost identical to our cotton cloth average prices, but in 1859 it is closer to our price for bleached and unbleached cottons, again very similar to both in 1863, and once again closer to the latter series in 1870, 1875, and 1880.Footnote 54 As expected, the movements of the indices are very similar also from 1854 onwards: both peak in 1864 and both fall from 1864 to 1870 at same time as cotton tariffs first fall and then rise (see Figure 3).
BRITISH COTTON CLOTH EXPORTS PRICES, 1846–1880 (sterling pounds/yard)

On the one hand, as expected, in the 1850s stable cotton prices could not provide the impetus for the liberalization of the poor European periphery and Latin America. Moreover, in this period reductions in cotton tariffs, that is, changes in specific rates stipulated by law, were exceedingly rare in the European core before Cobden-Chevalier. That is what the “fixed price” column of column Figure 4 shows. This inertia fits very well with the conventional accounts of commercial policy history for Europe before the outbreak of Cobden-Chevalier bilateralism.Footnote 55
AVERAGE TARIFFS ON COTTON MANUFACTURES (PIECE GOODS), UNWEIGHTED AND CURRENT VS. FIXED (1860) PRICES, 1846–1880

On the other hand, Figure 3 shows how the exceptional rise in raw cotton prices following the American Civil War magnified the effect of decreasing specific tariff barriers. This was especially true in Europe where the Cobden-Chevalier network expanded rapidly. The decrease in ad valorem equivalents of tariffs on cotton textiles until 1863 was clearly more due to an increase in the denominator (prices) than to a fall of specific tariffs in the numerator. For other textiles, a similar, though smaller, effect also appears. The influence of prices on ad valorem protection is also important in the second half of the 1860s when the second round of bilateral tariff agreements was probably compensated by the large reduction in prices.Footnote 56
The foregoing conclusions are subject to one caveat. Because we use specific duties in pounds sterling which do not provide data in national currencies for all years and countries, we cannot disentangle the effect of changes in the exchange rate as a source of protection or liberalization during this period. We observe that the exchange rates used in the British reports are constant rates which seemed to be based on the mint parity between currencies. This implies that the depreciation of currencies against the mint parity might have lowered the tariff level faced by exporters to that country if the stipulated duties were specific. We have not systematically corrected this potential bias for two reasons: the first is that accessible exchange rates (as collected by Markus DenzelFootnote 57) are for “cashless payments,” while customs duties especially in peripheral countries (for example, Mexico, Venezuela, and China) had to be paid in cash, that is with precious metal coins.Footnote 58 The most prominent example is the paper currency issued during the U.S. Civil War (greenback dollar). The Legal Tender Act of 1862 defined it as legal tender for payment “of all taxes, internal duties, excises, debts […], except duties on imports,” which still had to be paid in cash (specie dollars). The second reason is that in most countries where duties were specific, essentially those in Europe (see Table 2), exchange rates were essentially stable. The exceptions to these rules are, to our knowledge, Russia and China. In Russia, after 1877, customs duties had to be acquitted in gold, (presumably before that they could be paid in paper rubles).Footnote 59 For China, as the world gold-silver price started to rise substantially after 1873 (when German and France both went on to gold), the Shanghai tael, the silver-based currency used in the Maritime Customs Office, slowly lost value relative to the pound sterling.Footnote 60 This might also apply to other silver-based currencies such as the Mexican peso, for which, however, we lack valid specie-exchange rate information. Overall, the effect of changing exchange rates during the 1850s and 1860s is small, and after 1870 the spread of the gold standard, is important but it would not seriously affect the patterns we have found.
Returning to Figure 1, it is clear that Cobden-Chevalier was an exclusively European phenomenon. Tariff protection decreased in both the core of rich countries and with some delay in at least some parts of the European periphery. In the rest of the world, trade protection evolved in a different way. In the United States, tariff barriers actually increased from the late 1850s and early 1860s to the 1870s. For Latin America, liberalization was a pre-Cobden-Chevalier experience and return to protection started as early as the 1860s. Since Europe was at the center of the nineteenth-century economy, we need to ask what the effect of European liberalization was on world tariffs.
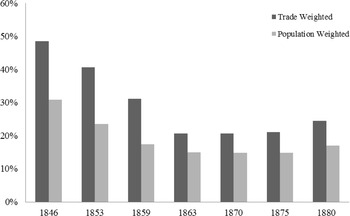
Looking at Figure 4, we see that the movements of the “world tariff” average are very similar whether we weigh countries by their share of world population or of world trade. Before 1860 the “world tariff” declined from 49 to 31 percent if weighted by trade shares, and from 31 to just 17 percent if weighted by population. The differences reflect the fact that large parts of the world population lived under regimes of “compulsory liberalism,” implying that both the “trade per person” and the tariff levels of these territories were below those of richer countries. This was particularly true for China and India. By 1870 world levels fell to 21 percent if weighted by trade and 15 percent if weighted by population. Then from 1870 to 1880 we see a slight increase by 2 to 4 percentage points. This indicates that there might have been “globalization backlash” for manufactures after 1870, but in comparison to the (European) reactions to the “grain invasion” it seems to have been rather mild.Footnote 61
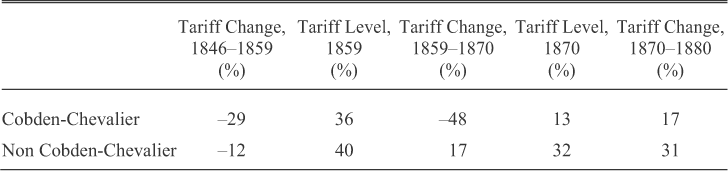
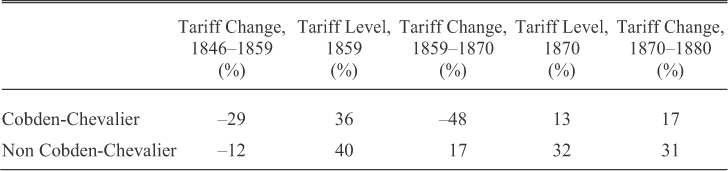
So, did Cobden-Chevalier matter? If we compare the “members” of the Cobden-Chevalier network—defined as those who concluded at least three treaties with unconditional most-favored nation clause before 1870—to “nonmembers” among the independent countries in our sample, the following picture emerges (Table 3).Footnote 62
WORLD TARIFF AVERAGE ON MANUFACTURING TRADE, 1846–1880

Cobden-Chevalier mattered, but liberalization was underway in the participating countries at least since 1846. The countries taking part in Cobden-Chevalier liberalized more before and during the 1860s than the other independent countries in our sample.Footnote 63 Indeed, between 1859 and 1870 the average liberalization was larger than that achieved in each of the eight GATT rounds between 1947 and 1994.Footnote 64 At the same time, non-treaty countries moved (on average) towards more protection, increasing tariffs by 17 percent and 31 percent in 1859–1870 and 1870–1880, respectively. This suggests that there were no simultaneous “two ways” to liberalization, and that the movement to free trade developed step by step employing different instruments.
THE COBDEN-CHEVALIER NETWORK AND THE EVOLUTION OF TARIFF RATES
Note:
“Tariff changes” are changes in percent, not percent points.
Sources:
See Online Appendix A.2 and the text.
STRUCTURE AND DISPERSION OF TARIFFS
As can be observed from Figures 1 and 3, tariffs for cotton manufactures were much higher than the simple average over all commodity groups. There are several possible reasons for this. Most importantly, countries (outside the British Empire) might have reacted to British comparative advantage in textile production by defensively protecting their industries. If so they would have biased their tariff structure against those products that the British were most desirous of selling.Footnote 65 They might also have been disproportionately protecting either those sectors where value added and spillover potential were highest (a “positive skill bias” according to Nathan Nunn and Daniel Trefler)Footnote 66 or domestic lobby groups or “national labor” were best organized, potentially causing a “negative skill bias.”
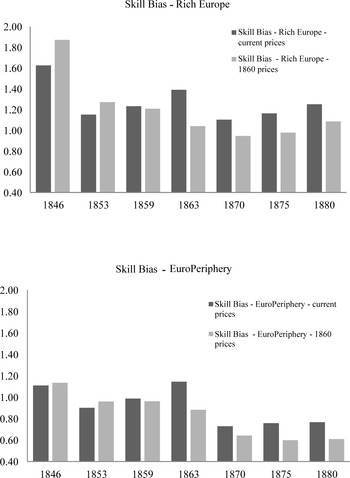
We can use the detailed information at industry level in our data set to shed some preliminary light onto these questions. First, we can look at the level of dispersion in tariff rates, that is, their variances across commodity groups to see which countries had more diversified tariff schemes, potentially reflecting more active commercial policy. Let us examine the coefficient of variation, which corrects for the fact that countries with high tariffs are also likely to have high variances across products. All points in time, European countries, rich and poor(er), seemed to pursue a much more active trade policy in the sense that the coefficient of variation of their rates is much higher than that of the rest in our sample, with Latin American countries and the rich settler colonies temporarily approaching European levels in the middle of our period, but then decreasing again. This pattern is reflected in the fact that outside Europe relatively uniform ad valorem rates across commodity groups were much more common than in Europe, where detailed schemes of specific duties prevailed. The second step is to look at the level and evolution of the “skill bias” over time. For the present purpose, we have measured skill bias as the ratio of the average of “high-skill industries” to “low-skill industries,” following Tena-Junguito.Footnote 67 A value above 1 for this indicator means that that high-skill industries were more protected than low-skill industries, which ceteris paribus hints at a “positive skill bias” in the tariff structure. Figure 5 shows that the skill bias in current prices was consistently above 1 over the whole period in the rich European core, while it was mostly below one in the poorer European periphery, especially after 1863, when a clear bias in favor of low-skill manufactures becomes visible. For the period 1859–1870 we observe divergent patterns between skill bias measured in current and constant prices, indicating contrary movements in relative prices and relative nominal protection levels. From 1859 to 1863, in current prices, tariffs for low-skill sectors fell faster than those for high-skill sectors both in the core and in the periphery, even though pure commercial policy did actually lower duties in constant prices faster for high- than for low-skilled sectors. Between 1863 and 1870 we see that in both “clubs” commercial policy became more inclined towards low-skill sectors, a process that was reversed to a certain degree in the Rich European countries after 1870, presumably by slightly increasing tariffs for high-skill industries. In sum, Cobden-Chevalier, despite lowering overall tariff levels, did little to change the tariff structure in favor of skill-intensive manufactures.
For the other clubs, the evidence is mixed and inconclusive. After the Civil War in the United States, the tariff structure also became more inclined towards low-skill industries: the average prewar ratio was 1.05 and it fell to an average of 0.84 after 1863. Latin American countries showed a pattern that consistently favored low-skill over high-skill sectors (they average 0.86). The Rich Semi-Independent group (Australia, Canada, and New Zealand) consistently increased their inclination towards more skill-intensive activities (from 0.77 in 1853 to 1.22 in 1875). The group of the dependent poor shows the opposite trend (moving from 1.3 before 1860 to 0.97 after 1870). This result, however, is driven mainly by India and Morocco; most countries had ratios close to one over the whole period thanks to their “flat rate” ad valorem tariffs.
TARIFF SKILL BIAS

However, the whole complex of skill bias change will require much more detailed investigation, since countries at different levels of development might rationally choose a tariff structure that first favors labor-intensive, low-skill manufacturing over agriculture (and impose fiscal tariffs on higher-skill products), medium-skill capital intensive manufactures over low-skill sectors or strategic and skill-intensive sectors not covered here (for example, machinery, arms, locomotives or boats) over industries producing the commodities we define as skill intensive.
CONCLUSION
This article offers a new wider perspective on the evolution of worldwide tariff levels on manufactures from 1846 to 1880. Previous attempts to measure tariff rates and their changes had been limited to some European countries, to protection on agriculture or based on the “average tariff” measure which is strongly biased, especially in Europe, by changes in fiscal tariffs on product of tropical agriculture, alcoholic beverages and the like. Although the data and analysis presented in the present article will be extended in the future to allow for solid econometric analysis into causal relations between liberalization (especially of manufactured goods) and trade expansion in different regions of the world as well as explanatory models of the “demand side” of liberalization, that is the political economy of tariffs, we wish to highlight a number of important findings:
Our results show that world trade was increasingly liberalized since at least 1846. This makes our view on liberalization is therefore more optimistic than the conventional wisdom offered by Bairoch, Irwin, and others who are skeptical about significant liberalization outside Britain before the wave of bilateral treaties of the 1860s. We find that most independent countries in the world liberalized during the late 1840s and the 1850s, and that liberalization on a world level continued until at least 1870. In the second phase of world tariff liberalization after 1860, liberalization via Cobden-Chevalier bilateralism was important for the reduction of manufactures tariffs in the world, not least because the share of the “member” countries of the network in world trade (not including the United Kingdom) was about 60 percent (in 1879). Furthermore, tariff rates remained low in most of the colonies and territories under European influence. In contrast, those independent countries not taking part in this wave of treaties on average increased their levels of protection. However, since their share in world trade was rather small (about 26 percent, most of it by the United States and Russia), their impact on a world scale was relatively small. The observed correlation in the 1860s between absence of bilateral co-operation to liberalize trade and increasing average tariff rates for manufactures constitutes negative evidence that there were no two effective paths to liberalization after 1860s, while the positive evidence of the European core of the Atlantic economy shows that Cobden-Chevalier was an effective instrument to sustain the liberalization dynamic underway before 1860.Footnote 68
To conclude, we wish to highlight the general trend of liberalization over the whole period, at least until 1870. The world average tariff in 1880 was little more than half the 1846 level, no matter if we use trade or population as weights. Of the 35 countries covered for the whole period (taking Italy as a continuation of Sardinia), 23 had lower tariffs on manufactures in 1880 than in 1846. Of the remaining dozen, only the United States, Brazil, Colombia, Cuba, and Greece had averaged levels above the population weighted world average of 17 percent in 1880. Therefore, we conclude that British liberalization after 1846 was typical rather than exceptional of a general trend of dismantling Old Regime mercantilism and decreasing political barriers of trade in the middle decades of the nineteenth century.
These results reveal something relevant for our knowledge of the dynamics of commercial liberalization in the nineteenth century which followed a general trend and was not sparked by any kind of bilateral or multilateral approach. Rules of all kinds of countries seem to have decided that it would be favorable to decrease trade barriers for manufactured goods. We believe that given our evidence, the idea that liberalization first took part in Britain, for endogenous political economy reasons, or the increasing political weight of Enlightenment ideas,Footnote 69 and then spread from overseas, via commercial hegemony, the spread of free trade ideologyFootnote 70 or gunboat diplomacy, should be revisited. If unilateral liberalization was underway at least since 1846, although reinforced by bilateralism during the 1860s, Britain might not have been alone in unilaterally questioning the costs of trade barriers, as it was not alone in dismantling them.