Dairy goat farming plays an important role in the economy and traditions of Mediterranean Countries such as France, Italy, Spain, and Greece (Park & Haenlein, Reference Park, Haenlein and Hui2006). In recent years, the role of goat milk in human nutrition has increased, owing to its favourable chemical, physical, organoleptic and nutritional characteristics, which make it an effective alternative to cow milk. Goat milk differs from cow, mainly on the basis of its smaller size of fat globules, which cause a better digestibility and higher proportion of short and medium chain fatty acids, which are partly responsible of its stronger flavour (Silanikove et al. Reference Silanikove, Leitner, Merin and Prosser2010). Its peculiar properties make it suitable for infants and children, for example in some cases of malabsorption syndrome (Lopez-Aliaga et al. Reference Lopez-Aliaga, Diaz-Castro, Alferez, Barrionuevo and Campos2010).
Since the 1980s, many reports investigating the characteristics of caprine milk, have focused on the extensive polymorphism of the αs1-casein (CN) fraction, which is encoded by the CSN1S1 gene, and at least 18 different variants have been identified so far (Devold et al. Reference Devold, Nordbø, Langsrud, Svenning, Brovold, Sørensen, Christensen, Adnøy and Vegarud2010). Allelic variants have been classified into four groups which are associated with different αs1-CN levels in milk: strong (or high type) alleles (A, B1, B2, B3, B4, B′, C, H, L, M) producing 3·6 g/l per allele, intermediate (E, I) producing 1·6 g/l, weak (F, G) producing 0·6 g/l, and null variants (01, 02, N), associated with the absence of αs1 casein (CN) in milk (Grosclaude et al. Reference Grosclaude, Mahé, Brignon, Di Stasio and Jeunet1987; Küpper et al. Reference Küpper, Chessa, Rignanese, Caroli and Erhardt2010). In addition, another null variant, referred to as the exon 12 D allele, has been found exclusively in the Norwegian goat population, at a very high frequency (0·72) (Hayes et al. Reference Hayes, Hagesæther, Adnøy, Pellerud, Berg and Lien2006).
Several studies report the effects of goat CSN1S1 gene polymorphism on milk production and composition (Avondo et al. Reference Avondo, Pagano, Guastella, Criscione, Di Gloria, Valenti, Piccione and Pennisi2009; Caravaca et al. Reference Caravaca, Carrizosa, Urrutia, Baena, Jordana, Amills, Badaoui, Sanchez, Angiolillo and Serradilla2009), milk technological properties (Remeuf, Reference Remeuf1993; Martin et al. Reference Martin, Szymanowska, Zwierzchowski and Leroux2002; Caravaca et al. Reference Caravaca, Ares, Carrizosa, Urrutia, Baena, Jordana, Badaoui, Sànchez, Angiolillo, Amills and Serradilla2011) and on milk fatty acid content (Chilliard et al. Reference Chilliard, Rouel and Leroux2006; De la Torre et al. Reference De la Torre, Morales, Serradilla, Extremera and Sanz Sampelayo2009), but little is known about the influence on the amino acid profile, despite the importance of these molecules in human nutrition (Rutherfurd et al. Reference Rutherfurd, Moughan, Lowry and Prosser2008). In addition, field studies regarding extensively-reared and pasture-fed goats, which is the most common production system in the Mediterranean Countries, are rare.
The aim of this research was to investigate the relationships between the most frequent genotypes at the CSN1S1 locus in the Sarda goat and milk yield, chemical and physical composition, fatty acid and amino acid content throughout the different stages of lactation.
Materials and methods
Animals and sampling
The research was carried out on 180 goats belonging to a herd located in southern Sardinia (Italy); all the goats were selected among the multiparous cohort with an age between 4 and 5 years, whose parturition occurred in February 2010; they were of Sarda breed and the animal management was conducted in a traditional way. Goats were extensively reared and exclusively fed at pasture; hand-milked once daily; reproduction was based on natural mating; kids were milk fed by their does and weaned when they were about 42-d-old.
A blood sample was collected from each goat for DNA extraction (Puregene DNA isolation kit—Qiagen) and CSN1S1 genotyping. Eighty representative goats displaying the most frequent genotypes (20 subjects for each of the CSN1S1 AB, BB and BF genotypes and 10 subjects for each of the AA and AF genotypes) were selected to investigate daily milk yield at 45 (early stage of lactation), 105 (mid stage of lactation) and 165 (late stage of lactation) days after parturition. Individual milk samples were collected in a 200 ml sterile plastic container and transported at +4 °C to the laboratory within 2 h.
Genotyping and milk composition
Genotype analysis at the CSN1S1 locus was performed with different methods: the CSN1S1 A (including A, G, I, H), B (including B1, B2, B3, B4 and C), F and N alleles were investigated according to Ramunno et al. (Reference Ramunno, Cosenza, Pappalardo, Pastore, Gallo, Di Gregorio and Masina2000, Reference Ramunno, Cosenza, Rando, Pauciullo, Illario, Gallo, Di Berardino and Masina2005); the E and 01 alleles according to Dettori et al. (Reference Dettori, Vacca, Carcangiu, Pazzola, Mura and Rocchigiani2009) and Cosenza et al. (Reference Cosenza, Illario, Rando, di Gregorio, Masina and Ramunno2003), respectively.
Milk samples were analysed for: fat, lactose, total protein and pH by using an infrared spectrophotometer (Milko-Scan 133B; Foss Electric, DK-3400 Hillerød, Denmark) according to the International Dairy Federation (IDF) standard 141C (IDF, 2000); casein content according to IDF Standard 29 (1964); freezing point in Hortvet degrees (H°) by using a thermistore cryoscope (Astor 4000/SE Double; Astori Tecnica, Poncarale BS, Italy) (IDF 108:2009); somatic cell count (SCC) by an electronic cell counter (Fossomatic 90, Foss Electric) according to IDF Standard 148A (2008); total microbic mesophilic count (TMC) by an automatic counter (Bacto-Scan, Foss Electric) according to IDF 358 (2000).
Determination of caseins fractions
The whole casein was isolated from skimmed fresh milk by acid precipitation, then dialyzed and lyophilised. Separation of the major casein components (αs1, αs2, β and κ) from lyophilised casein was performed with an HPLC Waters 625 apparatus (Waters Associates, Milford, MA) equipped with a Waters 486 variable-wavelength detector set at 220 nm, adapting the method developed by Jaubert & Martin (Reference Jaubert and Martin1992). Separation was obtained in 26 min on a C4 Vydac column heated at 44 °C.
Determination of milk fatty acids
Milk lipid extraction was performed following the method described by Alonso et al. (Reference Alonso, Fontecha, Lozada, Fraga and Juarez1999), fatty acids were determined after methylation according to EU Directive n.2568/91, with a Perkin-Elmer 8310 gas-chromatograph (Perkin-Elmer, Norwalk, CT, USA), flame-ionisation detector and temperature linear programming from 60 °C to 240 °C (56 min). The carrier gas was helium at a flow rate of 12 ml/min, DB—23 column, 30 m × 0·53 mm (0·5 μm film thickness).
Determination of milk amino acids
Total amino acids were determined through RP-HPLC with a Hewlet-Packard 1090 series system (Germany). The method consisted of a two-step precolumn procedure, where o-phthaldialdehyde/3-mercaptopropionic acid (OPA/3-MPA) was used for derivatisation of primary amino acids and 9-fluorenylmethyl chloroformate (FMOC-Cl) for derivatisation of secondary amino acids. The separation was achieved using a Hypersil ODS 5 μm column, with sodium acetate, THF and acetonitrile as solvents, and a gradient programme according to Schuster (Reference Schuster1988).
Statistical analysis
Data were processed by POPGENE V1.32 software (Yeh et al. Reference Yeh, Yang and Boyle2000) to calculate genotypic and allelic frequencies and Hardy-Weinberg equilibrium. A repeated measures general linear model procedure (GLM) was used to evaluate genotype effect on milk yield and composition, by means of Minitab statistical software (Minitab release 13·32, Minitab Inc. 2000, State College, PA). The model used for all variables was:
 $$Y_{ijk} = \mu + G_i + S_j + GS_{ij} + e_{k(ij)} $$
where Y ijk is the variable, μ is the general mean, G i is the genotype effect (i = 5), S j is the effect of the stage of lactation (j = 3), GS ij is the interaction effect and e k(ij) is the error effect. For all parameters, model effects were declared significant at P < 0·05. SCC and TMC were previously transformed into logarithmic form to normalise their frequency and multiple comparisons of the means were performed using the Bonferroni's method, with a default level at 95%.
Results
CSN1S1 genotype
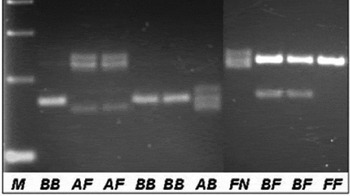
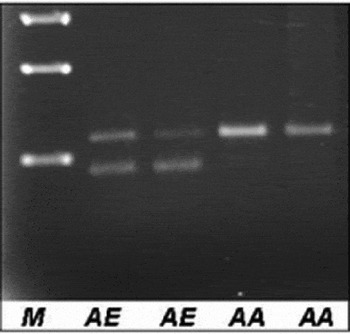
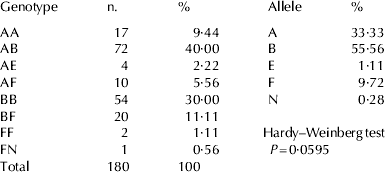
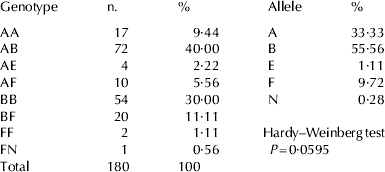
Agarose gel electrophoresis of PCR-RFLP of CSN1S1 exon 9 and AS-PCR of CSN1S1 exon 19 are shown in Figs. 1 & 2, respectively. Table 1 shows genotypic and allelic frequencies of the 180 goats examined. Eight different genotypes were detected: the most frequent were AB and BB, followed by BF, AA and AF. CSN1S1 AE, FF, and FN had the lowest frequencies. The most abundant allele was B, followed by A and F. Intermediate E and null N alleles had very low frequencies. The CSN1S1 01 allele was not found. The population was in Hardy Weinberg equilibrium for the locus analysed.
Agarose sel electrophoresis of CSN1S1 A, B, F and N alleles analysed by PCR-RFLP. M = marker 100 bp (Invitrogen); A=CSN1S1 A, G, I, H; B=CSN1S1 B1, B2, B3, B4, C.

Agarose sel electrophoresis of CSN1S1 A and E alleles by analysed AS-PCR. M = marker 500 bp (Invitrogen); A = all the CSN1S1 alleles except E and 01.

Genotype and allele frequencies at the CSN1S1 locus in Sarda goats (n = 180)
Milk yield and composition
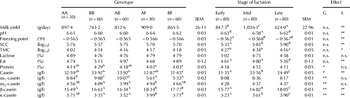
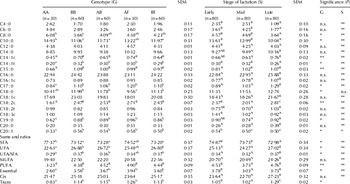
Table 2 shows least square means of milk yield, chemical composition and concentration of the casein fractions according to CSN1S1 genotype and lactation stage of 80 Sarda lactating goats. Statistical analysis demonstrated no effect of the interaction between genotype and stage of lactation and, consequently, these data were not reported.
Least square means and standard error (SEM) of milk yield and composition, according to CSN1S1 genotype and stage of lactation

Means with different letters in the same row indicate values significantly different, after Bonferroni correction; A, B, C=P < 0·01; a, b, c=P < 0·05
S = effect of the stage of lactation; G = effect of genotype; **=P < 0·01; *P < 0·05
Genotype did not affect milk yield, while this trait was significantly affected by the stage of lactation: on average, goats in the middle of lactation produced significantly more than they did in late lactation, with intermediate values in the early stage (P < 0·01). Milk pH and freezing point were not affected by genotype, but were significantly influenced by the stage of lactation (P < 0·01), pH having the lowest values in mid and freezing point early lactation. Cytological parameters did not differ between genotype groups. SCC showed significantly lower values in early lactation (P < 0·01) and TMC in late lactation (P < 0·05). Neither the CSN1S1 genotype nor the stage of lactation influenced the lactose content. Milk fat was not influenced by genotype, but was significantly higher in the late stage of lactation (P < 0·01).
Genotype significantly (P < 0·05) influenced milk protein and casein percentages: on average, BB goats produced milk with higher proteins than AF and BF; the casein content was significantly higher in BB and AB goats than BF. The protein percentage was not affected by the stage of lactation, while the casein content significantly increased throughout lactation, reaching the highest values in late lactation (P < 0·01).
The CSN1S1 genotype significantly influenced the synthesis rate of the single casein fractions (P < 0·01). The αs1-CN was higher in BB and AB goats than AF and BF, and slightly higher than AA goats; BB and AB had significantly lower αs2-CN than AF; β and κ casein had the highest values in AF and BF goats. The αs1 and αs2-CN fractions were not influenced by lactation stage, while β and κ-CN had an increasing trend from early to late lactation (P < 0·01).
Fatty acid composition
The CSN1S1 genotype significantly affected the percentage of 10 milk fatty acids (Table 3). The AA goats had significantly lower percentages of C14 : 1c; C15 : 0 and C18 : 2c (P < 0·01) than all the other goats and the lowest proportions of polyunsaturated FA (PUFA) (P < 0·01).
Least square means and standard error (SEM) of milk fatty acid composition (%) according to CSN1S1 genotype and stage of lactation

Means with different letters in the same row indicate values significantly different, after Bonferroni correction; A, B, C=P < 0·01; a, b, c=P < 0·05
S = effect of the stage of lactation; G = effect of genotype; **=P < 0·01; * P < 0·05
The proportions of all fatty acids, except for C18 : 0 (stearic), differed according to the stage of lactation. All values were significantly different at the P < 0·01 level, except for C20 : 1 (P < 0·05). When sums and ratios were considered, UFA, UFA/SFA, MUFA, PUFA, essential, cis- and trans-FA were higher in late than mid lactation. No effect of the interaction between genotype and lactation stage was found for these parameters.
Amino acid composition
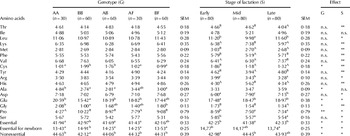
The major amino acids (aa) detected in the present study were, in decreasing order: Glu, Leu, Pro, Asp, Val and Lys (Table 4). Among the seventeen amino acids detected, seven were essential (accounting for about 42%) and four were essential for the newborn (about 14%). Differences due to genotype evidenced that Pro was lower in AA and AF (P < 0·01), and showed a marked difference between the AA and BB genotypes (4·27 vs. 10·22, respectively.
Least square means and standard error (SEM) of amino acid content (g/100 g AA), according to CSN1S1 genotype and stage of lactation

Means with different letters in the same row indicate values significantly different, after Bonferroni correction; A, B, C=P < 0·01; a, b, c=P < 0·05
S = effect of the stage of lactation; G = effect of genotype; **=P < 0·01; * P < 0·05
Essential = Thr, Ile, Leu, Lys, Met, Phe, Val
Essential for newborn = Cys, Tyr, Arg, His
All amino acids, except for Ile and Ala, showed differing proportions between lactation stages. Thr and Gly showed the lowest value in late stage (P < 0·01); Met, Cys (P < 0·01), Pro and Ser (P < 0·05) were lower in mid and late lactation; Arg showed a decreasing trend (P < 0·05) throughout lactation. In contrast, Val was higher in late stage (P < 0·01) and Glu was lower in early (P < 0·05). In mid lactation, Leu (P < 0·05), Phe and Tyr (P < 0·01) had the lowest values while Lys, His (P < 0·01) and Asp (P < 0·05) showed the highest percentages. Also in this case no effect of the interaction was found.
Discussion
CSN1S1 genotype
The genotype distribution of the Sarda goat displayed a profile typical of the Mediterranean breeds, where strong alleles prevail, in contrast with European goats of Alpine type, characterised by higher frequencies of intermediate and weak alleles (Grosclaude et al. Reference Grosclaude, Mahé, Brignon, Di Stasio and Jeunet1987; Albenzio et al. Reference Albenzio, Santillo, d'Angelo and Sevi2009). But, when compared with other caprine breeds reared in southern Europe, the population analysed was characterised by higher frequencies of the B allele: 0·55 vs. 0·11 to 0·41 of Maltese and Garganica, respectively, and lower frequencies of the weak F allele: 0·09 vs. 0·17 to 0·37 of Argentata dell'Etna and Maltese, respectively (Sacchi et al. Reference Sacchi, Chessa, Budelli, Bolla, Ceriotti and Soglia2005; Gigli et al. Reference Gigli, Maizon, Riggio, Sardina and Portolano2008), to mention only the extreme values.
Milk yield and composition
Milk yield in Sarda goats was similar to data recorded by Vacca et al. (Reference Vacca, Carcangiu, Dettori, Pazzola, Mauriello and Chianese2008) in the same breed, and by Avondo et al. (Reference Avondo, Pagano, Guastella, Criscione, Di Gloria, Valenti, Piccione and Pennisi2009) in Girgentana goats fed with different diets. This datum evidenced that the Sarda goat, which is an autochthonous breed well-adapted to the local environment, is able to reach a satisfactory milk yield also when the animals are fed at pasture without food supplementation. Milk yield was not affected by CSN1S1 genotype, in agreement with Chilliard et al. (Reference Chilliard, Rouel and Leroux2006).
Changes in milk yield and freezing point observed throughout lactation are consistent with other results (Strzałkowska et al. Reference Strzałkowska, Jóźwik, Bagnicka, Krzyżewski, Horbańczuk, Pyzel and Horbańczuk2009), as well as the pH values, which are within the range of 6·50–6·80, reported for goat milk (Park et al. Reference Park, Juarez, Ramos and Haenlein2007). Both freezing point and pH are utilised as quality monitors of the milk, as freezing point is altered when water is added to milk, and pH influences the structure of casein micelles and the renneting and cheese-making properties of milk (Pirisi et al. Reference Pirisi, Lauret and Dubeuf2007; Liu & Guo, Reference Liu and Guo2008).
Mean values of SCC followed an increase with the progress of lactation. SCC and TMC were satisfactory, considering that goats were hand-milked and values were respectively lower and similar to those already reported for the Sarda goat (Pazzola et al. Reference Pazzola, Balia, Carcangiu, Dettori, Piras and Vacca2012). The decrease of TMC in late lactation, while SCC remained high, shows that somatic cells in goat milk may vary regardless of udder health status, and their concentration might be due to physiological processes and management (Raynal-Ljutovac et al. Reference Raynal-Ljutovac, Pirisi, de Crémoux and Gonzalo2007).
The different CSN1S1 genotypes can affect milk fat content in lactating goat mammary epithelial cells, owing to their possible interaction with the secretory mechanisms of fat globules (Neveu et al. Reference Neveu, Riaublanc, Miranda, Chich and Martin2002; Dagnachew et al. Reference Dagnachew, Thaller, Lien and Ådnøy2011). In this report, milk fat was not influenced by CSN1S1 genotype, in contrast with Pagano et al. (Reference Pagano, Pennisi, Valenti, Lanza, Di Trana, Di Gregorio, De Angelis and Avondo2010) where high genotype goats showed a higher milk fat content than low genotype goats.
The analysis of Sarda goat milk composition revealed higher protein and casein percentages when compared with other goat breeds (Kusza et al. Reference Kusza, Veress, Kukovics, Jávor, Sanchez, Angiolillo and Bösze2007; Strzałkowska et al. Reference Strzałkowska, Jóźwik, Bagnicka, Krzyżewski, Horbańczuk, Pyzel and Horbańczuk2009; Devold et al. Reference Devold, Nordbø, Langsrud, Svenning, Brovold, Sørensen, Christensen, Adnøy and Vegarud2010; Pagano et al. Reference Pagano, Pennisi, Valenti, Lanza, Di Trana, Di Gregorio, De Angelis and Avondo2010). The effect of CSN1S1 polymorphism on protein and casein content is in agreement with the aforementioned studies, while differences emerged regarding the expression level of αs1-CN, in fact, the AA goats produced on average 4·42 g/l per allele and the BB produced 4·94 g/l per allele, both higher than the values reported so far (Grosclaude et al. Reference Grosclaude, Mahé, Brignon, Di Stasio and Jeunet1987; Caravaca et al. Reference Caravaca, Carrizosa, Urrutia, Baena, Jordana, Amills, Badaoui, Sanchez, Angiolillo and Serradilla2009). The AF and BF goats, showing a lower αs1-CN content, had an increased production of αs2, β and κ-CN, indicating a partial compensation of the casein production attributable to these casein fractions, as already evidenced in previous studies (Grosclaude & Martin, Reference Grosclaude and Martin1997; Devold et al. Reference Devold, Nordbø, Langsrud, Svenning, Brovold, Sørensen, Christensen, Adnøy and Vegarud2010). αs1 and αs2-CN content were independent of lactation stage, while β and κ-CN increased throughout lactation, indicating that the differential expression of the four casein genes is controlled by complex genetic and environmental factors, which are, in this case, only partially known (Caravaca et al. Reference Caravaca, Amills, Jordana, Angiolillo, Agüera, Aranda, Menéndez-Buxadera, Sánchez, Carrizosa, Urrutia, Sànchez and Serradilla2008; De la Torre et al. Reference De la Torre, Serradilla, Ares, Rodríguez Osorio and Sanz Sampelayo2007).
Fatty acid composition
The most represented fatty acids were, in order of abundance, C16 : 0, C18 : 1, C10 : 0, C18 : 0 and C14 : 0. On average, Sarda goat milk had higher percentages of C18 : 1 and C18 : 0 and lower of C16 : 0 than those observed in other caprine breeds (Chilliard et al. Reference Chilliard, Rouel and Leroux2006). C18 : 1 and C18 : 0 play an important role in human health, as they are involved in lowering LDL cholesterol and reducing blood pressure (Bester et al. Reference Bester, Esterrhuyse, Truter and Van Rooyen2010).
In the present study, although there were no CSN1S1 homozygous defective genotypes, the AF and BF goats were expected to have a defective-like behaviour, as they did for αs1-CN synthesis, but the main differences in fatty acid composition occurred between the AA and BB goats. The C8 : 0 and C10 : 0 were higher in the AA goat milk fat than BB, and most long chain FA were higher in BB than in the other genotypes, in contrast with De la Torre et al. (Reference De la Torre, Morales, Serradilla, Extremera and Sanz Sampelayo2009), which found that high type goats, in positive energy balance, normally produce a greater amount of short and medium chain fatty acids than low genotype goats. According to some authors, in addition to the increased amount of short and medium chain FA, high type goats produce lower levels of C16 : 0, C18 : 0, C18 : 1, C18 : 2 and C18 : 3 FA (Schmidely et al. Reference Schmidely, Meschy, Tessier and Sauvant2002), while in the present study, C16 : 0, C18 : 1 and C18 : 3 were not affected by genotype, in agreement with De la Torre et al. (Reference De la Torre, Morales, Serradilla, Extremera and Sanz Sampelayo2009). This might suggest that, in addition to the alteration of lipid secretion due to the CSN1S1 defective genotypes, there may be a regulation mechanism upstream, affecting both lipid synthesis and CSN1S1 genotype, resulting in fatty acid composition differences among the strong genotypes. The Sarda goat could be a valuable model to study these differences, owing to the high frequencies of both A and B alleles. Current knowledge is insufficient to explain the changes in milk fatty acid composition according to CSN1S1 genotype, also, bearing in mind that milk fatty acid composition strongly depends on the lipid composition of the diet (Park et al. Reference Park, Juarez, Ramos and Haenlein2007).
In agreement with Strzałkowska et al. (Reference Strzałkowska, Jóźwik, Bagnicka, Krzyżewski, Horbańczuk, Pyzel and Horbańczuk2009), with the progress of lactation, fatty acid composition showed a decrease of short and medium chain FA, which are synthesised de novo in the mammary gland and are essential for palatability of caprine milk (Silanikove et al. Reference Silanikove, Leitner, Merin and Prosser2010). Most long chain FA, in particular oleic and palmitic, increased in late lactation, this might be due to the long-chain lipid mobilisation from adipose tissues of goats, which were exclusively fed at pasture and may have undergone a negative energy balance in the late stage of lactation (Chilliard et al. Reference Chilliard, Ferlay, Rouel and Lamberet2003). The increase of monounsaturated and polyunsaturated FA observed in late lactation was similar to that observed in Polish goats by Strzałkowska et al. (Reference Strzałkowska, Jóźwik, Bagnicka, Krzyżewski, Horbańczuk, Pyzel and Horbańczuk2009). In addition, the increase of MUFA, PUFA, essential and cis-FA in late lactation indicate that the lipid composition of goat's milk, with the progress of lactation, tends to improve its nutritional value.
Amino acid composition
Most amino acid percentages were similar to those published by Haenlein (Reference Haenlein2004) in other goat breeds. Lys and pro values were slightly lower than those published by Davis et al. (Reference Davis, Nguyen, Garcia-Bravo, Fiorotto, Jackson, Lewis, Lee and Reeds1994) and Rutherfurd et al. (Reference Rutherfurd, Moughan, Lowry and Prosser2008), while Phe and His were higher. On average, essential amino acid content was optimal, if compared with the daily consumptions recommended by WHO (www.who.int).
Differences in the amino acid profile were expected between high type goats vs. carriers of the F allele. In fact, only one aa substitution differentiates the A and B alleles, while the F allele lacks many aa, mainly Ser, because of the alternative skipping of exons 9, 10 and 11 which causes the deletion of 37 aa (residues 59–95), in addition to a reduced level of secretion (Leroux et al. Reference Leroux, Mazure and Martin1992). In this study, changes of the aa content according to genotype involved only 5 aa, and were only in part explained by the sequence changes of the αs1-CN fraction, in fact, these should be added to the differences due to the sequence variations and/or differential secretion levels of all the other lactoproteins. However, it is interesting to highlight that the BB goats showed the highest proportions of essential and essential for the newborn amino acids.
Although almost all aa varied according to the stage of lactation, no marked differences were observed between the three groups. Bearing in mind that total protein content did not change throughout lactation, these variations are probably the result of fluctuations in the secretion level of each lactoprotein, which may be due to genetic factors, in addition to the effect of the CSN1S1 genotype, or environmental variables (Park et al. Reference Park, Juarez, Ramos and Haenlein2007).
Research supported by the RAS, Regional Government of Sardinia (P5a-Animal Biodiversity funds).