In his seminal study on the economics of blockade running during the Civil War, Stanley Lebergott raised the paradoxical question, “If smuggling yielded spectacular profit rates, why did so few successful investors try a second time?”Footnote 1 Using Marcus Price's data on thousands of shipping runs, Lebergott estimated “that fewer than ten percent of the runners made more than a single trip through the blockade.”Footnote 2 Employing the same data used by Lebergott, we find startlingly different results.Footnote 3
HISTORICAL BACKGROUND
Soon after the Civil War began, President Lincoln declared a blockade of major Southern ports, on April 19, 1861. By early 1862 the key ports of New Orleans, Norfolk, and Savannah were either captured or effectively closed to blockade running. As the blockade evolved, most of the activity centered on Wilmington, North Carolina and Charleston, South Carolina and to a lesser extent on Mobile, Alabama and Galveston, Texas. It soon became obvious that sailing vessels were too easily seen, too dependent on the wind and currents, and too small or too slow to be well suited to run the increasingly stringent blockade. In response, a few astute firms began employing steam powered side-wheel packets, especially those built along the Clyde River in Scotland, to run the blockade from one of the intermediate ports of Nassau, the Bahamas, St. George, Bermuda, or Havana, Cuba.
As the war entered into its third year, most non-steam-powered vessels had exited the industry. The shift to steam was nearly complete in the Carolinas, but sailing schooners and sloops continued to run the blockade in the Gulf ports because the “ship channels leading to many of the Gulf harbors were too shallow to permit the safe passage of steamers, other than those of exceptionably light draft …”Footnote 4
DATA ON ATTEMPTS BY BLOCKADE RUNNERS
Price published a series of papers beginning in the late 1940s, listing the ships that ran the blockade, one for each of three broad regions: the Carolinas, Georgia and East
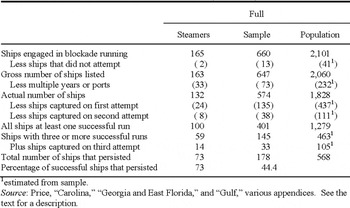
INCIDENCE OF SHIPS THAT TESTED THE BLOCKADE – PRICE DATA ALL CONFEDERATE PORTS (1861–1865)

1estimated from sample.
Source:
Price, “Carolina,” “Georgia and East Florida,” and “Gulf,” various appendices. See the text for a description.
Florida, and Gulf Ports. For each, he lists the name of each vessel, the ship type, (schooner, sloop, steamer, etc.) and the number of successful runs made by the vessel in that calendar year. He also provides the approximate date and location of a ship's capture or destruction, where appropriate.
We create a sample from the Price data which consists of some 660 vessels whose name began with one of the randomly selected letters B, C, E, I, P, T, and V. The sample represents between 31 and 32 percent of all ships listed by Price that tested the blockade (see Table 1). The vessel types varied from sailing barks, brigs, schooners, sloops, to steamers—both existing and purpose-built. A total of 178 vessels persisted in the business after successfully navigating the blockade and natural obstacles on their maiden voyage. Of this total, 145 ran the blockade three or more times and the remaining 33 were captured or destroyed while making their third attempt.
To convert this number into a percentage, we next determine the total number of initially successful ships. We subtract ships that are listed but did not attempt a run—defined as “engaged” by Price. We also subtract the number of ships running the blockade in multiple years or across multiple regions to avoid double counting. The subtractions leave 574 ships that made at least one attempt to run the blockade. Next, we subtract ships that were either captured on their first or second attempts, 135 and 38, respectively. Although not an inconsiderable number of ships, they also do not conform to the definition of a successful ship employed by Lebergott in forming the paradox. This leaves a total of 401 ships; of these remaining ships, 178 ships or 44.4 percent continued to challenge the federal blockade after a successful voyage. Of the remaining 223 that exited the business, 136 did so within the first nine months of the
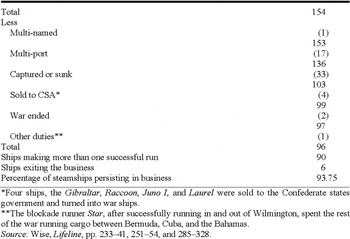
ANALYSIS OF STEAMSHIPS ENTERING THE CAROLINA PORTS – WISE DATA

*Four ships, the Gibraltar, Raccoon, Juno I, and Laurel were sold to the Confederate states government and turned into war ships.
** The blockade runner Star, after successfully running in and out of Wilmington, spent the rest of the war running cargo between Bermuda, Cuba, and the Bahamas.
Source:
Wise, Lifeline, pp. 233–41, 251–54, and 285–328.
war, while the blockade was still forming.Footnote 5 Of the 136 existing ships, 128 were sailing ships that had become much less effective once the North tightened the blockade.
There was also a clear difference between sailing and steam ships in the rate of multiple attempts. We split the sample into steam-powered ships (132) and sailing vessels (442) and find that initially successful steamers persisted at rate of 72 percent, over twice the rate for sailing vessels.
To confirm our finding on the high rate of persistence by steamers, we turn to data collected by historian Stephen R. Wise, which were not available to Lebergott at the time of his study. Focusing on the Carolina ports of Wilmington and Charleston, which after 1862 became the major point of entry for blockade runners, we calculate respectively, that 96 and 89 percent of all successful steam-powered blockade runners attempted a second voyage (see Table 2).Footnote 6
WHY DO OUR RESULTS DIFFER FROM LEBERGOTT'S?
The 10 percent figure that Lebergott estimates from the Price data has been widely cited in the recent scholarship on the economics of the federal blockade.Footnote 7 However, Lebergott provides little description of the data and no discussion of the methodology used to arrive at this number. To help understand how he may have concluded that such a small percentage of initially successful ships persisted in “the business,” we offer the following possibilities.Footnote 8
First, ships were often renamed, in some instances three times or more, to confuse Northern navel officers. In our sample, eight percent of ships employed this tactic. Price included multi-named vessels under each pseudonym in the annual alphabetical listing of ships, but only the first entry lists the number of successful runs in the period. For subsequent entries of the ship, the space in the column for “Known Successful Runs During Year” is left blank. However, since a single ship may appear two or even three times in the annual record under a different name, it would be very easy to mistake the subsequent listings as an entirely new ship, which failed to make a successful run in that period.
Another more serious difficulty in working with the extensive list of ships detailed by Price is that he provides no indication when ships ran in more than one calendar year. For example, the Elizabeth, a small schooner, ran successfully twice in 1861 and once in 1862 prior to her capture in the Gulf region. It is quite probable that Lebergott, especially given the large number of ships active in the Gulf, accounted for the Elizabeth's runs, as two different ships; one that had two successful runs and exited, and a second one that was captured on its first attempt. Well over 12 percent of all ships in our sample ran in more than one calendar year.
Finally, a smaller number of ships tested the blockade in more than one region, typically either early in the war or in its waning months. One of the largest purpose-built ships, the Colonel Lamb, ran successfully in the Carolinas in late 1864 and then moved to the Gulf after Wilmington and Charleston were captured or closed by federal forces in early 1865. A failure to control for these factors would greatly inflate the number of ships in the denominator used to calculate the percentage of persistent ships.
To be consistent with the definition underlying Lebergott's paradox, we exclude entries with the following profiles: ships that failed on their initial attempt through the blockade (those ill-suited, poorly piloted, or unlucky ships) as well as ships that were successful on their first run but were captured (or destroyed) on their second engagement. Clearly, their owners chose to challenge the blockade again and therefore these ships do not meet the Lebergott single-voyage-and-exit criteria. If Lebergott did not fully account for any one or all of these different possibilities, his finding of the percentage of persistent ships would be significantly biased downward.
A simple experiment supports this view. By employing the total unadjusted number of entries in our sample of Price's data as the denominator and restricting the numerator only to ships that made a minimum of two complete voyages—four successful runs, we arrive at a persistence rate that approximates the Lebergott 10 percent figure.
CONCLUSION
We have reevaluated the data collected by historians Price and Wise and determined that the share of blockade runners that sought to run the blockade again after an initial success was much higher than the 10 percent rate reported by Lebergott. Our estimated rate of multiple attempts is more consistent with findings that successful blockade runs offered high profits.