


Introduction
At the onset of word use, children begin to connect their speech production capacities with words they choose to say. For example, a child begins to use /dædæ/ to indicate that she wants her father to pick her up (e.g., Davis & Bedore, Reference Davis and Bedore2013; Meltzoff, Kuhl, Movellan, & Sejnowski, Reference Meltzoff, Kuhl, Movellan and Sejnowski2009). A major issue regarding the earliest stages of word production relates to the potential interactions between children's articulatory capacities for producing phonemes (how they produce sounds in words) and their early vocabulary (what words they choose to say). The question arises whether children at the onset of word use choose to say words consisting of sounds they can already produce, or whether they choose words to say without much regard for the sounds these words contain.
Production system capacities may have a potentially important influence on early word forms children choose to say. Early researchers argued for ‘Lexical Selection’, stating that phonological factors direct the word types children attempt in the earliest stages of word use (e.g., Ferguson & Farwell, Reference Ferguson and Farewell1975). Later investigations of ‘Selection and Avoidance’ were based on this proposal (e.g., Leonard, Schwarz, Morris, & Chapman, Reference Leonard, Schwartz, Morris and Chapman1981; Schwartz & Leonard, Reference Schwartz and Leonard1982; Schwartz, Leonard, Frome Loeb, & Swanson, Reference Schwartz, Leonard, Frome Loeb and Swanson1987). According to this perspective, children choose to say words with sounds they can produce and tend to avoid words with more complex phonological characteristics that they cannot yet produce: For example, words like ball, baby, and mama dominate, because children can produce those words easily by closing their lips (i.e., with labial sounds). In contrast, children may initially not choose to say words like cookie or cake because they have less control of raising their tongue in the back of the mouth required for the ‘k’ sound (i.e., velar sounds).
Early speech and vocabulary milestones
In order to evaluate theoretical perspectives on the relationship between early words children choose to say and the phonological properties of those words, an understanding of the typical course of lexical growth and speech production development is needed. Relative to lexical expansion, children's productive lexicon size is reported to be approximately 50 words within 6 months after their first word is produced (typically between age 1;0 and 1;6). By 24 months, children develop an average of 300 words and by approximately four years, they typically show a productive vocabulary of 2,500 to 3,000 words (Fenson, Marchman, Thal, Dale, Reznick, & Bates, Reference Fenson, Marchman, Thal, Dale, Reznick and Bates2007; Stoel-Gammon, Reference Stoel-Gammon2011). However, individual variation in vocabulary growth can be large when children's vocabulary size is measured relative to their chronological age. For example, one 20-month-old may have a productive vocabulary size of 40 words while a second child of the same chronological age may produce 200 words. Both children are functioning within the range of typical developmental expectations (Fenson et al., Reference Fenson, Dale, Reznick, Bates, Thal, Pethick and Stiles1994; Fenson, Bates, Dale, Goodman, Reznick, & Thal, Reference Fenson, Bates, Dale, Goodman, Reznick and Thal2000). Vocabulary size is considered a good indicator of overall linguistic development. For instance, larger vocabulary size correlates with greater phonological skills (see Stoel-Gammon, Reference Stoel-Gammon2011, for a review) and is highly correlated with dimensions such as gesture, actions, and measures of syntactic and morphological development (e.g., Fenson et al., Reference Fenson, Dale, Reznick, Bates, Thal, Pethick and Stiles1994).
Relative to developing articulatory system capacities, comprehensive research on early milestones and central tendencies for sound types and combinations that children produce in their earliest words has established a large body of information. Both in prelinguistic babbling and in the early word period, common preferences for consonants with labial and coronal place of articulation as well as stop, nasal, and glide manner have been described across many different languages (e.g., De Boysson-Bardies & Vihman, Reference De Boysson-Bardies and Vihman1991: French, Swedish, Japanese, and English; Kern, Davis, & Zink, Reference Kern, Davis, Zink, Hombert and d'Errico2010: French, Romanian, Dutch, and Tunisian Arabic; Lee, Davis, & MacNeilage, Reference Lee, Davis and MacNeilage2010: Korean; Roug, Landberg, & Lundberg, Reference Roug, Landberg and Lundberg1989: Swedish; Stoel-Gammon, Reference Stoel-Gammon1985: English). Simple CV and CVCV syllable shapes have been described as characteristic in early words (e.g., Stoel-Gammon, Reference Stoel-Gammon1985: English: English; Teixeira & Davis: Brazilian-Portuguese, Reference Teixeira and Davis2002; Vihman, Reference Vihman, Furguson, Menn and Stoel-Gammon1992), resulting in word forms with consonant initiations and vowel terminations (e.g., Kent & Bauer, Reference Kent and Bauer1985: English). Final consonant deletion has been described as a pervasive production strategy in this period in English-learning children, resulting in use of CV and CVCV forms in place of CVC and CVCVC targets (e.g., Aoyama & Davis, Reference Aoyama and Davisunpublished observations; Kim, Reference Kim2010). Some unique aspects of a child's ambient language phonology begin to emerge. However, sounds and sequences characteristic in babbling also appear to dominate children's word-based productions throughout the single-word period (e.g., Davis, MacNeilage, & Matyear, Reference Davis, MacNeilage and Matyear2002: English; Kern et al., Reference Kern, Davis, Zink, Hombert and d'Errico2010: French, Romanian, Dutch, and Tunisian Arabic; Vihman, Ferguson, & Elbert, Reference Vihman, Ferguson and Elbert1986: English).
Phonological versus lexical dominance theories
Varied theoretical perspectives have explored potential relationships between phonological properties of early words (i.e., the phonemes in early word targets, and whether children can produce them) and their lexical properties (i.e., the meanings of words that children choose to say). Early experimental studies of children's production of lexical items containing ‘IN’ and ‘OUT’ sounds (sounds that were or were not part of the children's speech production inventory, respectively) formed an early benchmark for work on this topic (Leonard et al., Reference Leonard, Schwartz, Morris and Chapman1981; Schwartz & Leonard, Reference Schwartz and Leonard1982). In a contrasting body of research focusing on potential associations between lexical and phonological dimensions of language acquisition, Vihman proposed that some children build their early vocabulary around whole-word regular phonological structures characterized as ‘templates’ for targets they attempt (Vihman, Reference Vihman and Aronoff2016; Vihman & Croft, Reference Vihman and Croft2007). In this view, words children choose to say contain regular phonological features relative to the number of syllables and segment types. For example, children may produce CVC words containing two different consonants as labial–coronal sequences, regardless of the target characteristics (e.g., /baeg/ → /baet/ and /kok/ → /bot/). Importantly, children often produce words with a high level of day-to-day production output variability, due to immaturity of their articulatory system (i.e., Locke, Reference Locke1983, Reference Locke1989). However, global sound-based consistencies in the child's overall productive vocabulary may emerge (i.e., a certain overall continuity in the sound types that are produced, which can be seen as template-like patterns for word productions), indicating some interactivity between phonetic capacities and vocabulary choices. In sum, these perspectives have been argued to support the claim that production system capacities likely impact words children choose to say in the earliest stages of word use.
Traditional phonological theory, such as Optimality Theory (OT) (e.g., Kager, Pater, & Zonneveld, Reference Kager, Pater and Zonneveld2004), has also incorporated patterns in early speech production. OT emphasizes an abstract modular phonological system dedicated to information processing as underlying language acquisition. For example, within the OT framework, Fikkert and Levelt (Reference Fikkert, Levelt, Avery, Dresher and Rice2008) have argued that Dutch-learning children in the earliest stages of word learning produce only one place of articulation, before they start using place contrastively in consecutive stages. Their argument is consistent with Vihman’s ‘whole word patterning’ or ‘templates’ (Vihman, Reference Vihman and Aronoff2016).
In contrast, Levelt and colleagues’ psycholinguistic model of pre-planning for output in adult speakers (e.g., Levelt, Roelofs, & Meyer, Reference Levelt, Roelofs and Meyer1999) suggests separate processes for semantic, lexical, phonological, and articulatory processing. Their top-down conceptualization of adult speech production starts with a system of intact lexical/semantic and phonological/articulatory capacities, which is in contrast with the dynamic and changing production system and lexicon of young children across acquisition proposed by Fikkert, Vihman, and colleagues (Fikkert & Levelt, Reference Fikkert, Levelt, Avery, Dresher and Rice2008; Vihman & Croft, Reference Vihman and Croft2007).
Other researchers have proposed a lexical driving force for the nature of early word forms. Pierrehumbert's (Reference Pierrehumbert, Bybee and Hopper2001) cognitive conceptualization of encoding words for output emphasizes interactivity between lexical and phonological levels in premotor planning. In this perspective, a child's desire to say a word she connects with a specific event (e.g., cow for a farm animal, cookie for a treat) may dominate over phonological production system capacities (i.e., can she produce /k/ sounds?). Following Pierrehumbert, some researchers have posited that the child's growing lexicon is a principal issue accounting for words produced by typically developing children who are four years of age and older (e.g., Beckman, Munson, & Edwards, Reference Beckman, Munson, Edwards, Cole and Hualde2007), and that phonemes emerge gradually as children make increasingly robust abstractions over the words they are learning (e.g., Edwards, Munson, & Beckman, Reference Edwards, Munson and Beckman2011). Such a ‘lexical dominance hypothesis’ suggests that word-choice factors dominate even in the earliest period when production system mastery is far from adult-like. Thus, this view assumes continuity between the child and adult speech production systems: children are predominantly motivated from the outset by ideas they wish to convey to those around them. For example, they choose to say giraffe, request cake, and reject going to bed using no, regardless of whether or not they can produce the sounds in those words. Considering children's overall productive vocabulary, their actual productions of words may be very different from the phonological characteristics of their word targets.
Considerations related to understanding ontogeny or acquisition of the sound system in modern human infants, the focus of this study, can also be considered in the context of phylogenetic origins of development of vocal communication in earliest users of vocal communication systems (MacNeilage & Davis, Reference MacNeilage and Davis2000; see Davis, Reference Davis, Mufwene, Coupé and Pellegrino2017, for an overview). Consideration of the acquisition of phonological–lexical capacities in modern infants can illuminate the central importance of a non-arbitrary relationship between the biological capacities of the infant and the need for development of a rapid and functional communication system: a function-based approach. In the early period of language acquisition, support for either a lexical or a phonological approach may offer valuable insight about the driving forces underlying the emergence of a biological–functionally driven communication system in earliest historical users of such a system. In the absence of a fossil record for language evolution, the study of early ontogeny of modern human infants can provide a picture of both the young human's biological structures and how they are deployed at the onset of communication, when the system is at its most basic. As an example, historical evolutionary pressures on the child lexicon deployed in rapid message transmission might reduce the potential for differences between target and actual productions as the child deploys speech for survival and function.
Overall, theoretical perspectives on the nature of early word characteristics do not reveal consensus on the validity of the claim that children's speech production capacities may influence the words they choose to say. It is important to note that conceptualizations suggesting that the lexicon dominates word choices (e.g., Munson, Edwards, Beckman, Cohn, Fougeron, & Huffman, Reference Munson, Edwards, Beckman, Cohn, Fougeron, Huffman, Cohn, Fougeron and Huffman2011; Pierrehumbert, Reference Pierrehumbert, Bybee and Hopper2001) are largely based on studies of children four years of age and older. In contrast, recent studies that argue for an important role of children's production system capacities (i.e., Stoel-Gammon, Reference Stoel-Gammon2011; Vihman, Reference Vihman and Foster-Cohen2009) largely focus on children in the earliest periods of word use, before age four, and are more often experimentally based. Other research has mainly considered the role of cognitive processing relative to the lexicon implementing ‘neighborhood density’ analyses (e.g., Storkel, Reference Storkel2009).
Children's speech and language develops dramatically between the earliest word onset period and the age of four. This period is characterized by rapid growth in vocabulary size. Longitudinal analyses of spontaneous words that children produce in this earliest period of word use can therefore provide important evidence about influences of phonological factors on words children choose to say. Previous studies have described phonological development in young children based on spontaneous speech from longitudinal databases (e.g., Demuth & Johnson, Reference Demuth and Johnson2003: French; Fikkert, Reference Fikkert1994; Fikkert & Freitas, Reference Fikkert and Freitas2006: European Portuguese; Levelt, Reference Levelt1994: Dutch). However, these studies have largely considered specific phonological and/or phonotactic output patterns in early words, but do not discuss potential selection strategies children might use when determining which words they choose to say. Other issues such as the role of prosodic structure (see, e.g., Fikkert, Reference Fikkert1994) and the influence of representations of phonological features on early production are also well documented (see, e.g., Levelt, Reference Levelt1994, and Fikkert & Levelt, Reference Fikkert, Levelt, Avery, Dresher and Rice2008, for a discussion of place of articulation; Kager, van der Feest, Fikkert, Kerkhoff, & Zamuner, Reference Kager, van der Feest, Fikkert, Kerkhoff, Zamuner, van de Weijer and van der Torre2007, for a study of early voicing in Dutch, German, and English; and Song, Demuth, & Shattuck-Huffnagel, 2012, for a study of acoustic characteristics of early place and voicing in coda consonants in English). In the current study, we wish to consider the process of development relative to potential strategies children may employ in the words they choose to say, and evaluate previous theories on selection-and-avoidance strategies. Simply put, do children consider words to say relative to their own ability to produce the phonological properties? Or do they choose words to say based on ideas they wish to express without consideration of whether they have the ability to reproduce sound and sequence patterns in words?
Accordingly, the goal of the current study is to consider the relationship between words children choose to say and their speech production capacities in the earliest period of word learning, namely between onset of word use and approximately 36 months of age. To investigate this relationship, we analyzed spontaneous speech samples from six typically developing children between the ages of 0;8 and 2;11. Rather than analyzing accuracy of sound productions at the word level, our aim was to analyze overall distributions of phonological characteristics in the children's Word Targets versus the distributions in their Actual Word Forms (the sounds in children's actual productions of word targets). The difference in outcomes between analysis of overall distributions versus looking at individual word level accuracy may be illustrated with an example. ‘Sam’ has a vocabulary of 5 words, consisting of (Word Targets) ball, down, bye, book, and no. He produces these (Actual Word Forms) as /bA/, /ba/, /dAdA/, /bU/, and /no/, respectively. If we consider accuracy as a ‘horizontal’ analysis involving comparison of each sound in an individual word with its corresponding sounds in the target form, we find 60% accuracy (with 66·6% accuracy for labials and 50% accuracy for coronals) at word-initial place of articulation. However, if we do a ‘vertical’ analysis across the whole vocabulary, considering only the general distributions of sounds, we find 60% labials and 40% coronals in the Word Targets and 60% labials and 40% coronals in the Actual Word Forms. Thus, our analyses in this study are not related to children's accuracy at the individual word level, but to general pattern matching for dimensions of place and manner in word-initial and -final position, taking into account that individual words may be produced with a high level of day-to-day variation (Locke, Reference Locke1983, Reference Locke1989). Typical vocabulary size development can vary greatly throughout the first years of life (e.g., Fenson et al., Reference Fenson, Marchman, Thal, Dale, Reznick and Bates2007). Accordingly, we compared potential relationships between distributions of phonological characteristics over time, with time-points measured as the children's growing vocabulary size rather than their chronological age (i.e., we compare productions over time of children with the same vocabulary size rather than the same chronological age).
We analyzed consonants in Word Targets and Actual Word Forms in the children's spontaneous speech productions in terms of their place and manner of articulation in both word-initial and word-final position. These are phonological characteristics frequently used to comprehensively describe children's speech production output. We included both word-initial and word-final position to enable a comprehensive view of the word targets children choose to say in English (Ladefoged & Maddieson, Reference Ladefoged and Maddieson1996). We focused on both initial and final word positions, as these positions have been described as showing diverse trajectories of phonological development related to processes such as final consonant deletion that are described as pervasive in this period (e.g., Vihman, Reference Vihman1996). This example of differences in children's sound patterns across word positions indicates a need for evaluating each position uniquely to consider lexical versus phonological dominance hypotheses comprehensively.
Using our longitudinal spontaneous speech samples we evaluated two hypotheses:
1. The child's articulatory system and sound production capacities drive his or her choices of words to say. If this is the case in the early period of word use, we predict that spontaneously produced Word Targets will exhibit similar distributions of phonological dimensions to children's Actual Word Forms, as children are choosing to say words that match their own sound production repertoire. Accordingly, there will be no significant differences between distributions of the phonological dimensions analyzed across vocabulary size in Word Targets and Actual Word Forms. This type of outcome would indicate selection of Word Targets with phonological characteristics within the child's production repertoire. It supports a phonological dominance hypothesis, consistent with previous proposals of lexical selection / selection and avoidance (e.g., Schwartz & Leonard, Reference Schwartz and Leonard1982).
2. In contrast, children may choose words to say regardless of their sound characteristics even in this earliest period when production system mastery is far from adult-like. If so, we predict that distributions of phonological dimensions analyzed in spontaneously produced early Word Targets will be significantly different from the children's Actual Word Forms for those targets, indicating that children are choosing words to say based on their lexical properties, rather than on whether those words reflect their own speech production capacities. Such an outcome would be consistent with a lexical dominance hypothesis.
Methods
Participants
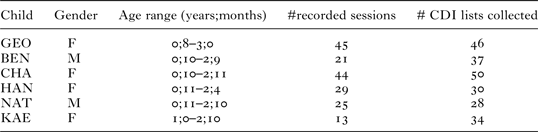
Spontaneous speech data from six monolingual English-learning children (2 female) age 0;8 to 2;11 were analyzed. Table 1 summarizes participant characteristics and number of spontaneous speech recording sessions. All six children were located through informal referrals from the Austin, Texas community. In addition to parental reports, the Battelle Developmental Screening Inventory (Guidubaldi, Newborg, Stock, Svinicki, & Wneck, Reference Guidubaldi, Newborg, Stock, Svinicki and Wneck1984) was administered to establish typical motor/cognitive development. Sound field screening procedures established that all the children showed hearing responses within normal limits for the speech frequencies of 500, 1,000, 2,000, and 4,000 HZ. Testing occurred in a sound booth located in the University of Texas at Austin Speech and Hearing Clinic.
Participant Characteristics

Data collection
Data were collected as part of a larger study of babbling and early speech in typically developing American English-learning children between 8 and 36 months. The database analyzed is available as part of the Texas Davis database (e.g., Davis et al., Reference Davis, MacNeilage and Matyear2002) on PhonBank (Rose et al., Reference Rose, MacWhinney, Byrne, Hedlund, Maddocks, O'Brien, Wareham, Bamman, Magnitskaia and Zaller2006). The data are publically available for researcher access. Each child's spontaneous vocal output was audiotaped in a home environment for one hour every 2–3 weeks, based on the family's schedule. One caregiver and a researcher were present and interacted with the child. The researcher did not interfere with normal routines. Sessions included playing, eating, and other daily experiences familiar to the children. Audio data were recorded using an Audio-Technika ATW1031 remote microphone clipped to each child's shoulder to maintain consistent mouth to microphone distance. Reliability measures for individual consonants were conducted on the original files and were reported for the original database. A point-to-point method for word-based forms compared the children's recorded productions across two transcribers who were trained in transcription of early speech patterns. Overall reported reliability for individual consonants was 75·05%. Labial reliability was 79·6%, alveolar and palatal reliability was 77·0%, and velar reliability was 68·6%.
All spontaneously produced words (vocalizations with a clear word-based target) were included in the analyses. The referent of each word-based target analyzed was agreed on by the parent and the observer in situ during the data recording. For this agreement that a verbal form was attached to a specific referent (e.g., agreement that ba indicated a ‘ball’, Word Target: ball), several issues were taken into account: the context related to previous use of the vocal form for that referent; the presence of the referent in the environment; and the child's use of pragmatic intentions of requesting or negating (see Davis et al., Reference Davis, MacNeilage and Matyear2002, for more detail). Contextual issues were particularly relevant for the earliest sessions when the children's referents were less clear. As word use increased, it became straightforward for the parent and observer to determine which vocalizations were words.
The MacArthur-Bates Communicative Development Inventory (CDI; Fenson, Dale, Reznick, Thal, Bates, & Hartung, Reference Fenson, Dale, Reznick, Thal, Bates and Hartung1993; Fenson et al., Reference Fenson, Marchman, Thal, Dale, Reznick and Bates2007), long form, was used to gather data around the date of each spontaneous data collection session (see Table 1). The CDI is a normed parent report instrument designed to compare young children's understanding and use of early vocabulary items to children of their chronological age who are monolingual learners of the same ambient language. The CDI parent report format has good concurrent and predictive validity for vocabulary acquisition (Feldman, Campbell, Kurs-Lasky, Dale, Colborn, & Paradise, Reference Feldman, Campbell, Kurs-Lasky, Dale, Colborn and Paradise2005). Based on instructions from the researcher who collected the spontaneous speech data at each session, the parent marked words on the CDI that (s)he felt the child had begun using in production since the last visit, by annotating each new word on the list with the date of that home visit. The CDI was completed at home; the longitudinal nature of the study meant that the parents were very familiar with the procedure. Questions that arose were answered before or after data collection at each data collection session.
The sound pattern of a word did not have to be adult-like for parents to check that that child was producing the word. For this study, CDI parental report of word use (i.e., ‘expressive vocabulary’) results were analyzed to validate that the words children produced in their spontaneous speech samples were comparable the types of words that parents reported their child was able to produce. The main purpose of these CDI analysis was to establish that the children's spontaneous speech samples were not qualitatively different from reported vocabulary on the normative CDI; i.e., to evaluate the potential for bias created by specific topics and materials present for the child within spontaneous speech samples. CDI analysis provided comparison of spontaneous sample results with an independent standardized measure based on normed vocabulary characteristics of young children learning the same ambient language as the children in our study. For each child, we calculated the cumulative count of CDI words at the date of each spontaneous speech sample, to obtain one standardized measure of vocabulary growth over time (in addition to the measure of vocabulary growth based on the spontaneous speech data, as outlined below). It is important to note that data were collected past the period for which the CDI was normed. However, the goal was not to establish normative values based on the CDI, but to validate generally that the children's spontaneous words were not different in phonological characteristics from the characteristics of their CDI reported words. Accordingly, for the current study we did not calculate normed percentile scores for the children's reported CDIs at any point.
Data analyses
We utilized Phon (Rose et al., Reference Rose, MacWhinney, Byrne, Hedlund, Maddocks, O'Brien, Wareham, Bamman, Magnitskaia and Zaller2006) to analyze the distributions of phonological characteristics of place and manner of articulation in word-initial and word-final position in the children's Word Targets and their Actual Word Forms. Word Targets consisted of all syllable-like productions, designated as ‘word-based targets’ because they had a clear meaningful target word or communicative function, based on criteria outlined above. Actual Word Forms indicates the broad phonetic transcriptions of the words as the child actually produced them. The speech samples were transcribed by coders trained in transcribing young children's speech (see Davis et al., Reference Davis, MacNeilage and Matyear2002). As an example, in a session with three Word Targets /bɔl/, /soŋ/, and /kændi/, the child's actual productions, or Actual Word Forms, might be /bɔ/, /ton/, and /bæ/. We analyzed our dataset in three different ways: we considered (a) patterns in word-initial position, (b) patterns in word-final position, and (c) vocabulary size.
First (a), word-initial consonants in Word Targets and Actual Word Forms were analyzed for the following five phonological dimensions: labial, coronal, and dorsal place of articulation; and fricative and oral stop manner of articulation (note that nasals were not included in these analyses). The palatal /j/ was classified as a coronal, and the glide /w/ was classified as a labial and velar based on conventions in Phon (Rose et al., Reference Rose, MacWhinney, Byrne, Hedlund, Maddocks, O'Brien, Wareham, Bamman, Magnitskaia and Zaller2006). Analysis of our corpus of word types showed that the frequency of /w/ sounds was 9% in Word Targets and 11% in Actual Word Forms out of the total number of consonant manner of articulation occurrences. Because these frequencies are very similar, analyses of the difference between Word Targets and Actual Word Forms were not considered to be affected by the standard classification of /w/ in Phon.
Next, the same five phonological dimensions were tabulated in (b) word-final position for Word Targets and Actual Word Forms. In the example above, where a (hypothetical) session contained the three Word Targets /bɔl/, /soŋ/, and /kændi/, and the three Actual Word Forms were /bɔ/, /ton/, and /bæ/), the complete analyses in both word positions would lead to a count of 0 labials, 1 coronal, and 1 dorsal sounds in Word Targets, whereas the Actual Word Forms include 0 labial, 1 coronal, and 0 dorsal sounds.
Finally (c), vocabulary size within individual sessions was considered. Vocabulary size was calculated by adding the number of new vocabulary word types a child produced within each session to the total number of word types that were produced in earlier sessions. For example, during the first data collection, a child produced three words, ball, song, and candy. The vocabulary size of the first session was three. During the following visit for the second data collection, the child said the words, ball, dog, and milk. The child's vocabulary size at this point of the second data collection was five because he/she chose two new words to say during the session and two words were added to the three words observed during the previous session. Due to the closed set of possible word types on the standardized CDI word list, the total number of word types for CDI words as reported by the parents was much smaller than the number of word types in Word Targets occurring in the children's spontaneous speech samples. Thus, we compared proportions of labial, coronal, and dorsal place and oral stop and fricative manner of consonant articulation in word-initial and -final positions between Word Targets and CDI words.
Statistical analyses
Place and manner phonological dimensions of consonants were divided into four groups for inferential statistics: (1) word-initial position – place, (2) word-initial position – manner, (3) word-final position – place, and (4) word-final position – manner. Thus, we had four statistical models based on word position and consonant place and manner dimensions. For example, in word-initial position and in word-final position – place, three phonological dimensions (labial, coronal, dorsal) of initial consonants in Word Targets and Actual Word Forms were compared as a function of vocabulary size. In word-initial position and word-final position – manner, two phonological dimensions (oral stops, fricatives) of initial and final consonants in Word Targets and Actual Word Forms were compared. To compare Word Targets versus Actual Word Forms for the place and manner dimensions over time (vocabulary growth), we applied a generalized linear mixed model (GLMM), with a negative binomial distribution using the glmmADMB package in R because the data (i.e., the dependent variable) were over-dispersed (Fournier et al., Reference Fournier, Skaug, Ancheta, Ianelli, Magnusson, Maunder, Nielsen and Sibert2012). We had four regression models for each data group.
In word-initial position – place, the dependent variable was the number of phonological dimensions for consonantal place of articulation (labial, coronal, dorsal). The model of word-initial position – place included fixed effects of vocabulary size, spontaneous word measure (Word Targets, Actual Word Forms), and place (labial, coronal, dorsal). For the word-initial position – manner analysis, the dependent variable was the number of phonological dimensions for consonantal manner of articulation. The model of word-initial position – manner included fixed effects of vocabulary size, spontaneous word measure (Word Targets, Actual Word Forms), and manner of articulation (oral stops, fricatives). In addition, interaction terms for spontaneous word measures (Word Targets, Actual Word Forms) with vocabulary size, and spontaneous word measure (Word Targets, Actual Word Forms) with both place and manner were evaluated. The other two models for word-final position included the same dependent variables and fixed effects.
This statistical model included a random intercept of child and a random slope of vocabulary size. To validate the models with a random intercept of children and a random slope of vocabulary size, a likelihood ratio test was used to compare the likelihood of each pair of models with and without the random effects. AIC (Akaike Information Criterion) was also compared for each pair of models to validate the models with random effects. The ‘Appendix’ shows a model comparison of the three models for each group (available at https://doi.org/10.1017/S0305000917000484).
Results
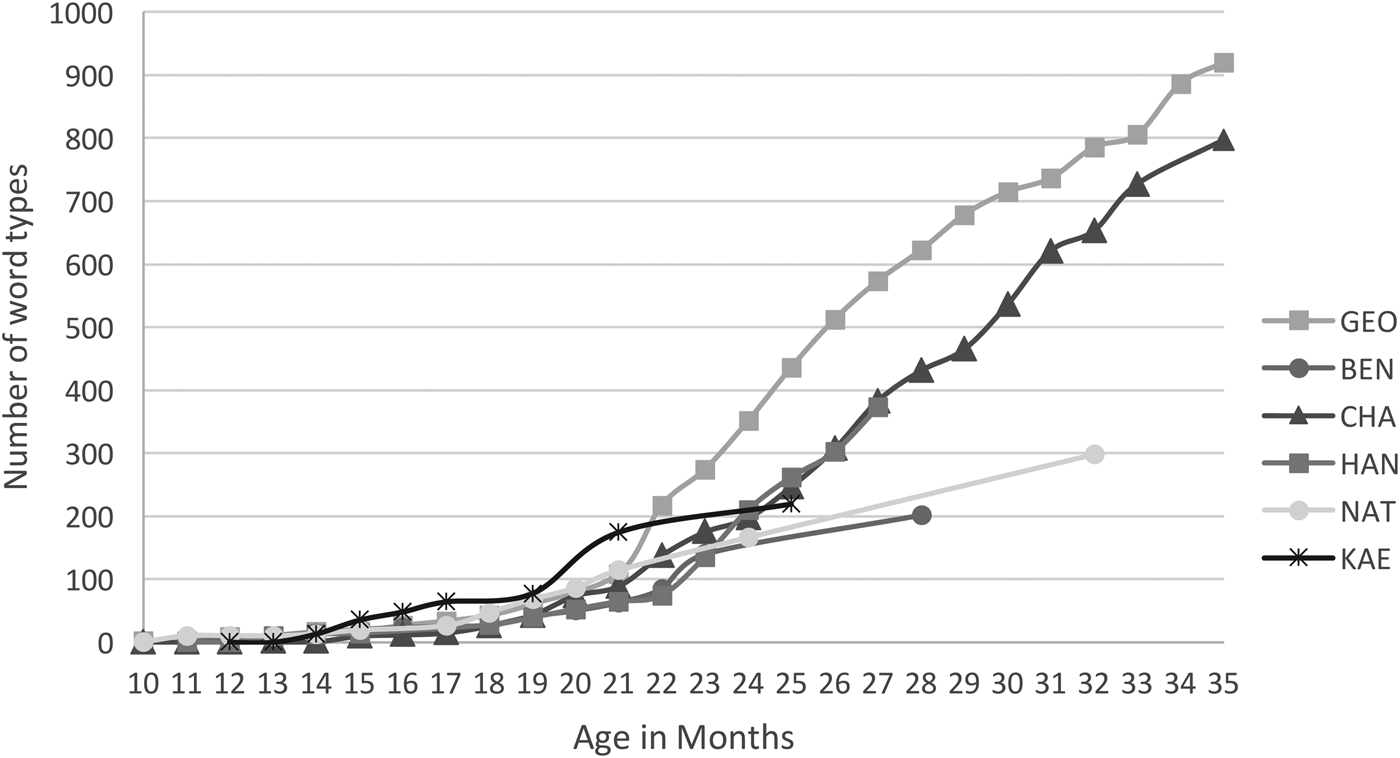
Prior to conducting inferential statistics to examine study hypotheses, vocabulary growth for six children in our spontaneous sample was described. Figure 1 illustrates vocabulary growth for each of the six children in our sample based on the cumulative number of word types in their spontaneous speech samples. All participants showed a slow growth in number of word types until approximately 20–22 months, followed by a steeper increase. More marked differences in word growth for individual children occurred in the later period of the study.
Total number of different spontaneously produced target word types as a function of age for each child.

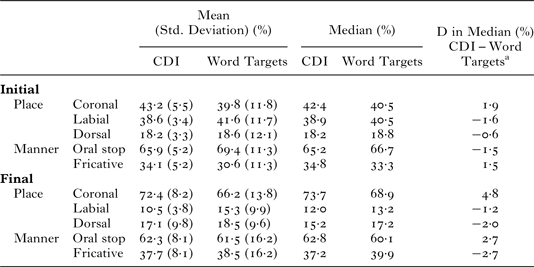
The total number of CDI words reported across sessions were descriptively compared to each child's spontaneous speech production output. Table 2 shows mean and median values of each percentage relative to the phonological dimensions analyzed for CDI Words and Word Targets, and differences between median values for CDI Words and Word Targets. Because the number of CDI Words and Word Targets included outliers, median instead of mean values were used to compare the two types of measures. CDI Words and Word Targets showed similar distributions for the phonological dimensions of place and manner. Initial coronal and labial sounds were more frequent than dorsals in both. Final coronal sounds were more frequent than both labial and dorsal sounds in both. Initial and final oral stop sounds were much more frequent than fricatives in both. The range of difference between Word Targets and CDI Words was between 0·6 and 4·8%. Proportion values showed very similar relationships for all dimensions of place and manner in initial and final position, validating our assumption that our spontaneous samples were representative of these children's speech production capacities in this early period of vocabulary development.
Descriptive Statistics for Comparison between Distributions of Phonological Dimensions in Words Reported on the CDI Lists and Word Targets

Note. adifference in median values between CDI and Word Targets.
Word-initial position
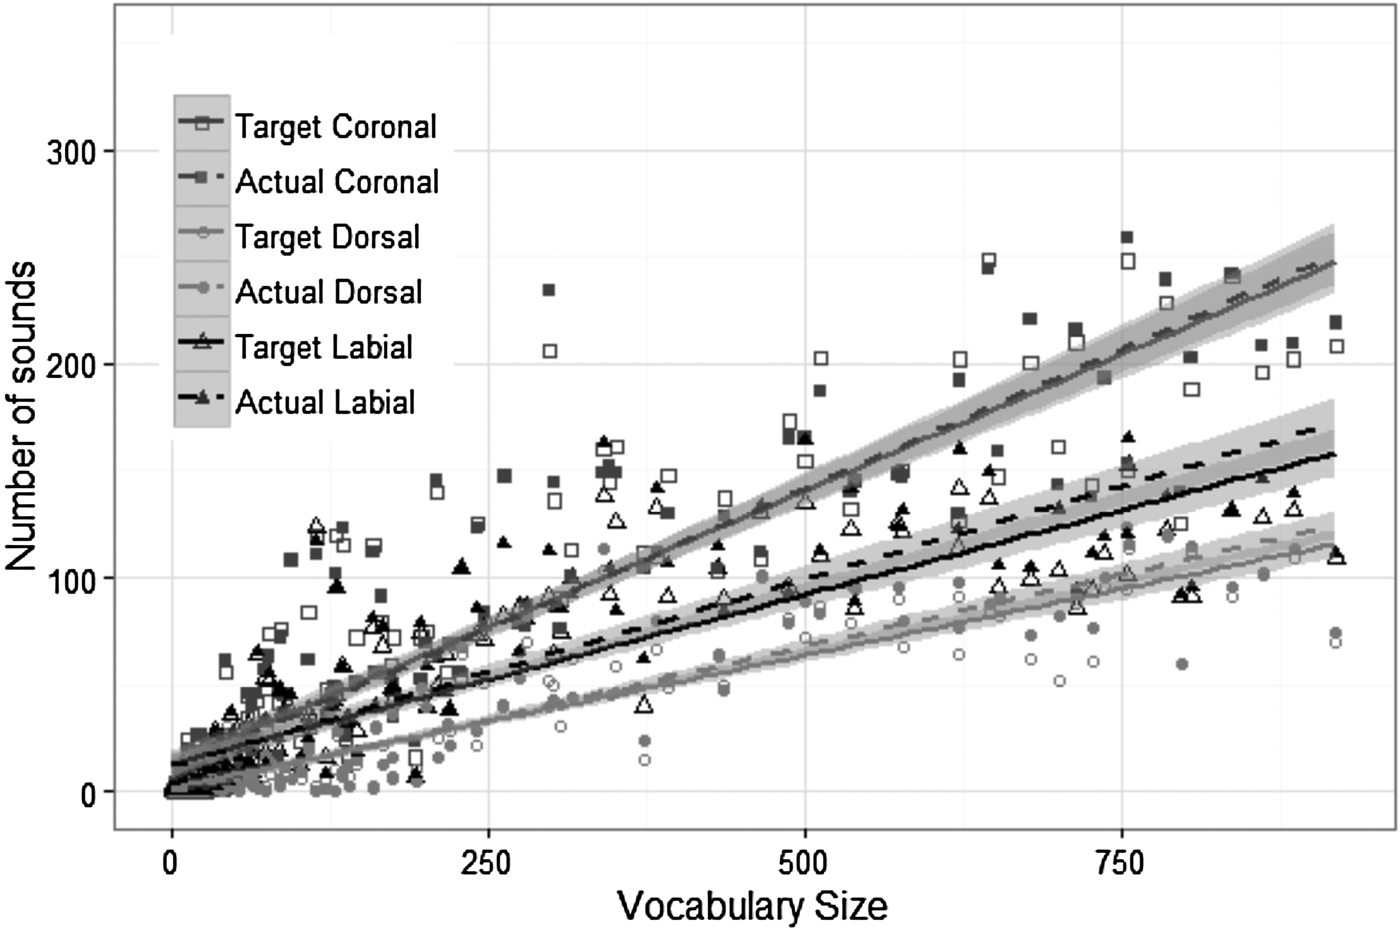
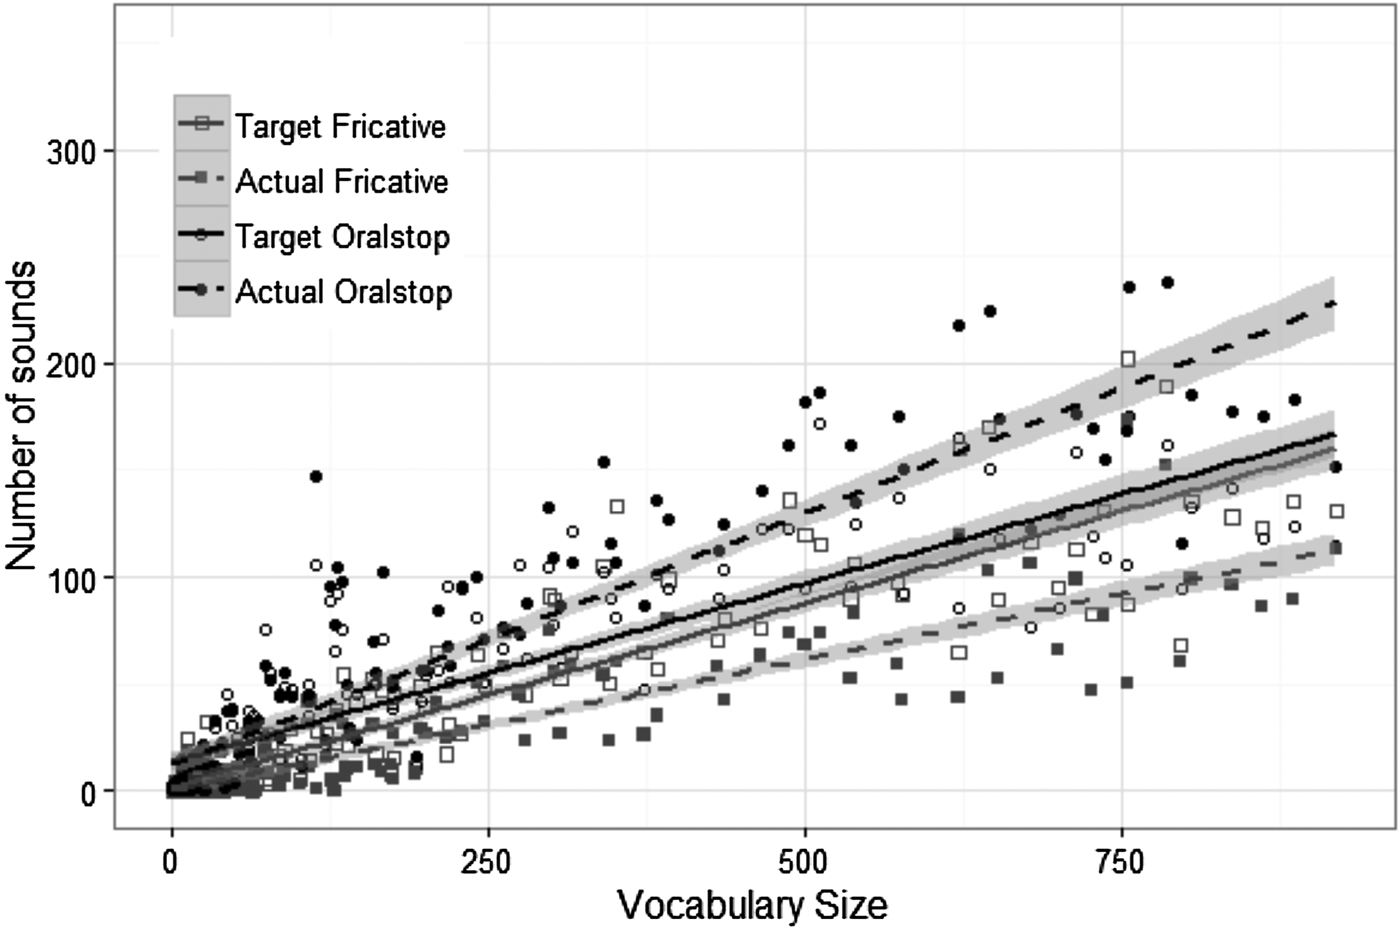
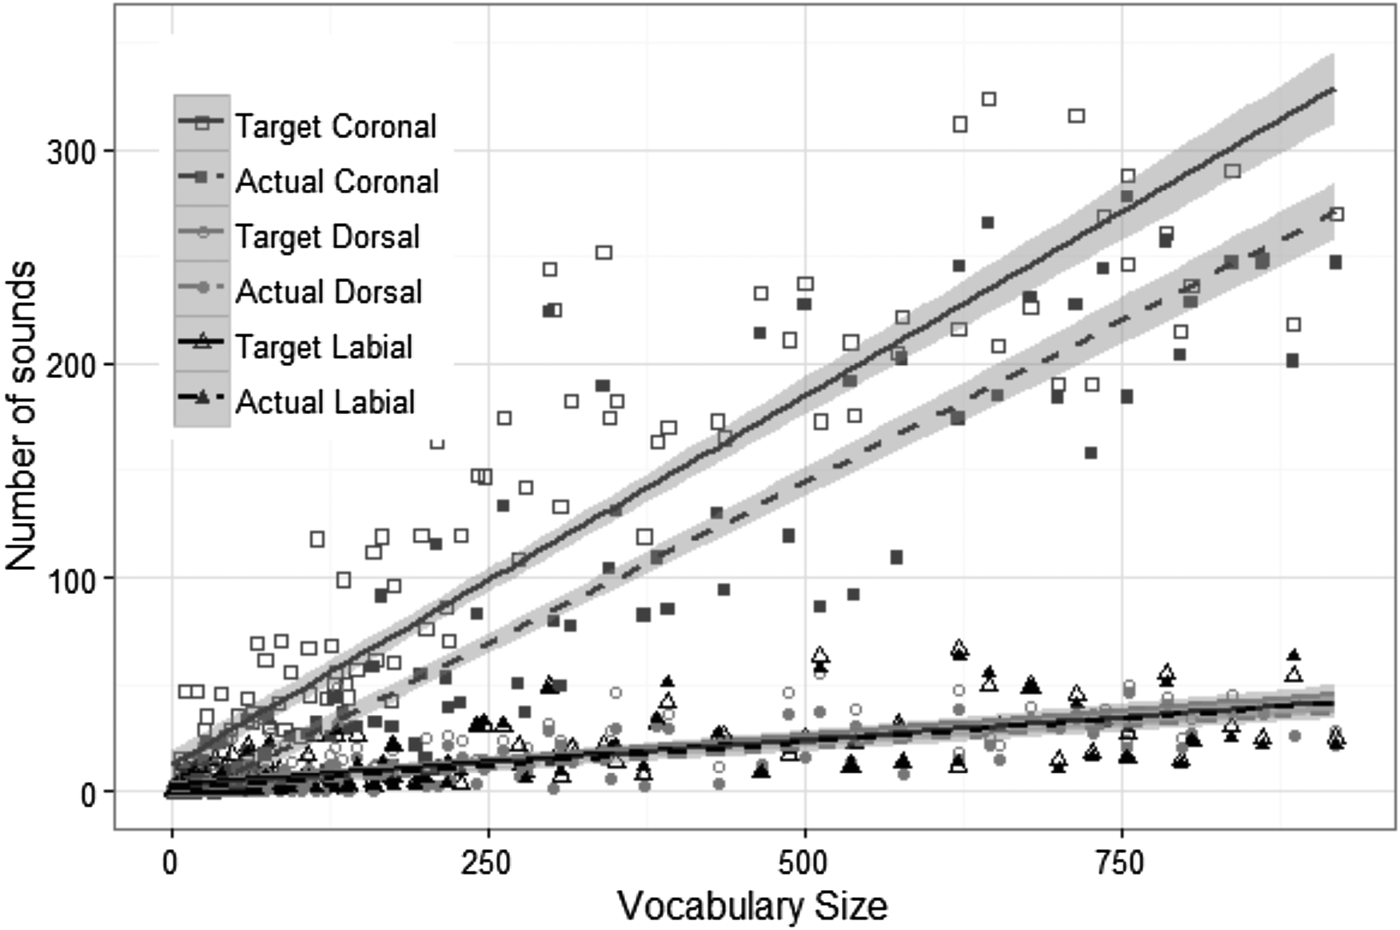
To compare distributions of the phonological dimensions of place and manner of articulation in Word Targets versus Actual Word Forms, we applied the GLMM for word-initial and then for word-final position. Figures 2 and 3 illustrate trends of distributions for place and manner of articulation dimensions in word-initial position, in Word Targets and Actual Word Forms over time for all six children, as a function of vocabulary growth.
Word-initial place. Distributions of phonological dimensions of word-initial place of articulation (coronal, dorsal, labial) in Word Targets versus Actual Word Forms as a function of vocabulary size. Linear lines indicate ‘smoothed conditional means’ to show trend of raw data for the phonological dimensions. Each shaded area along the line represents 95% confidence interval on the line.

Word-initial manner. Distributions of phonological dimensions of word-initial manner of articulation (fricative, oral stop) in Word Targets versus Actual Word Forms as a function of vocabulary size. Linear lines indicate ‘smoothed conditional means’ to show trend of raw data for the phonological dimensions. Each shaded area along the line represents 95% confidence interval on the line.

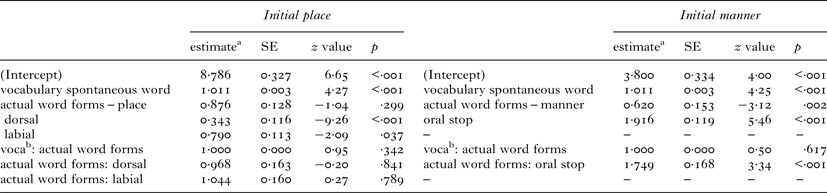
Results of the regression for initial place and manner, including exponential estimates, are shown in Table 3. An F-test was used to test the overall effect of fixed factors in a generalized linear mixed regression effect model. For place of articulation in word-initial position, there was no significant difference between Word Targets and Actual Word Forms [F(1,895) = 1·079, p = ·299]. There was also no significant interaction between vocabulary size and the difference between Word Targets and Actual Word Forms [F(1,895) = 0·904, p = ·342], and no interaction between spontaneous word measure (Word Targets, Actual Word Forms) and place of articulation [F(2,895) = 0·056, p = ·946].
Results of the Generalized Mixed Effects Negative Binomial Regression on Spontaneous Word Measures in Word-initial Position. The Intercept Represents the Reference Condition: Spontaneous Word Measure Was Word Targets, Place Was Coronal, Manner Was Fricative.

Notes. estimatea = exponential estimate; vocab = vocabulary.
For manner of articulation in word-initial position, comparison of fricatives with oral stops revealed no interaction between vocabulary size and the difference between Word Targets and Actual Word Forms [F(1,595) = 0·250, p = ·617]. However, there was a significant difference between Word Targets and Actual Word Forms [F(1,595) = 9·706, p = ·002], as well as an interaction between manner and spontaneous word measure (Word Targets, Actual Word Forms) [F(1,595) = 11·133, p < ·001]. An interaction analysis was performed using the phia package in R (Martinez, Reference Martinez2015). Pairwise contrasts evaluated with the Bonferroni correction showed that fricatives were significantly more frequent in Word Targets than in Actual Word Forms [X 2 (1, N = 595) = 6·841, p = ·018]. There was no significant difference between distributions of oral stops in Word Targets and Actual Word Forms [X 2 (1, N = 595) = 0·249, p = 1·000].
Word-final position
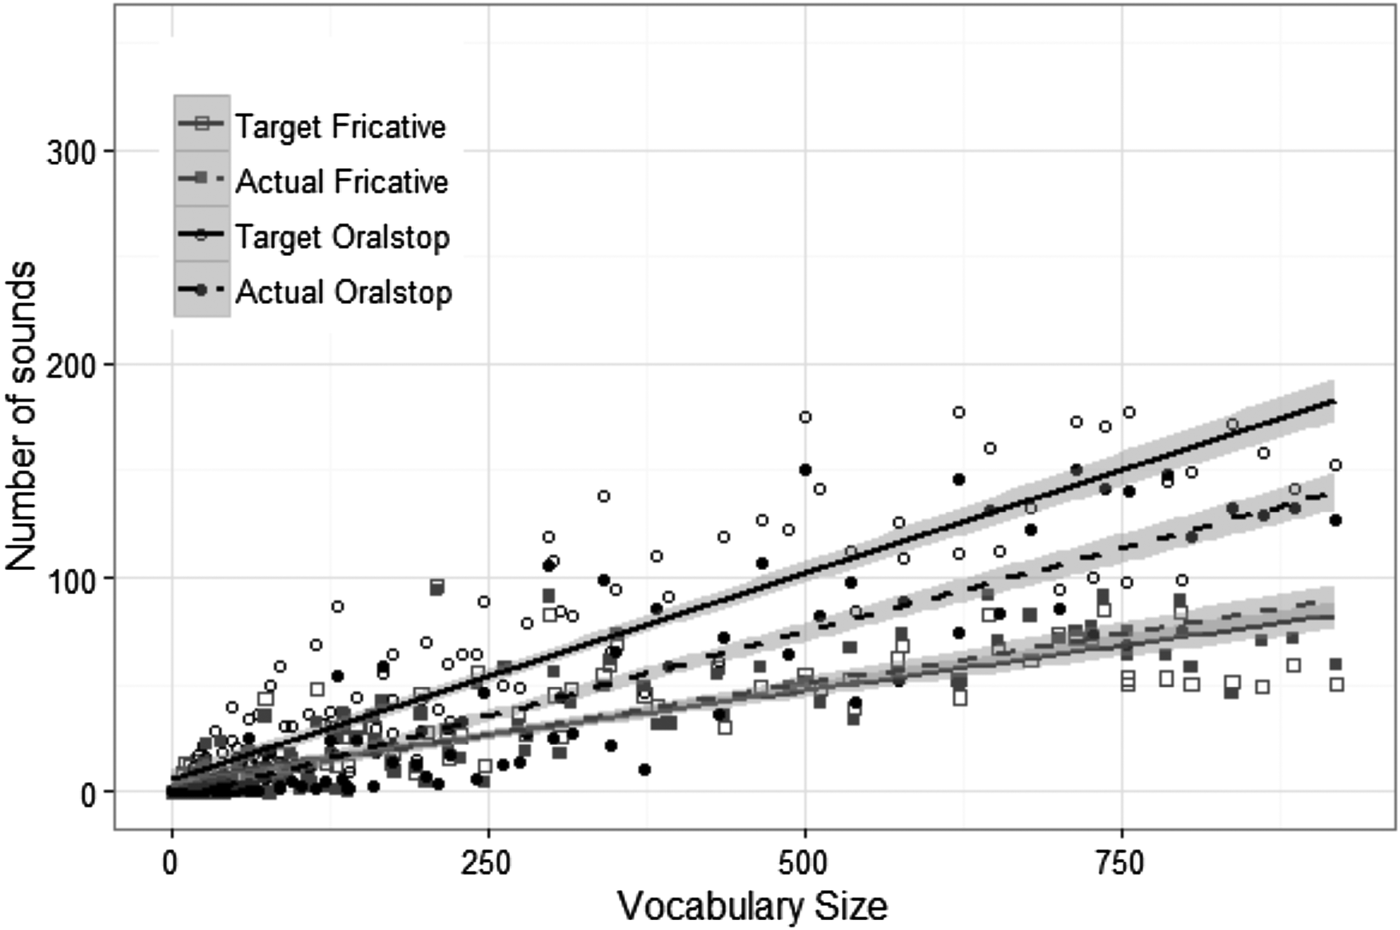
Figures 4 and 5 illustrate trends of distributions for place and manner of articulation dimensions in word-final position, in Word Targets and Actual Word Forms over time for all six children, as a function of vocabulary growth.
Word-final place. Distributions of phonological dimensions of word-final place of articulation (coronal, dorsal, labial) in Word Targets versus Actual Word Forms as a function of vocabulary size. Linear lines indicate ‘smoothed conditional means’ to show trend of raw data for the phonological dimensions. Each shaded area along the line represents 95% confidence interval on the line.

Word-final manner. Distributions of phonological dimensions of word-initial manner of articulation (fricative, oral stop) in Word Targets versus Actual Word Forms as a function of vocabulary size. Linear lines indicate ‘smoothed conditional means’ to show trend of raw data for the phonological dimensions. Each shaded area along the line represents 95% confidence interval on the line.

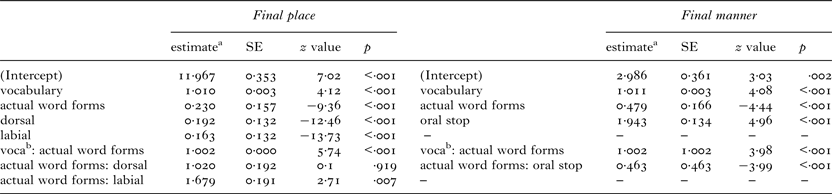
Table 4 displays regression results including exponential estimates with statistics for final place and manner. An F-test was used to test the overall effect of fixed factors in generalized linear mixed regression effect models. For place of articulation in word-final position, there was a significant difference between Word Targets and Actual Word Forms [F(1,895) = 87·516, p < ·001]. There was also a significant interaction between vocabulary size and the difference between Word Targets and Actual Word Forms [F(1,895) = 32·984, p < ·001]. Differences between Word Targets and Actual Word Forms tended to decrease with growth in vocabulary size for both place and manner in word-final position. There was also a significant interaction between spontaneous word measure (Word Targets, Actual Word Forms) and place of articulation [F(2,895) = 3·697, p = ·025]. Pairwise contrasts evaluated with the Bonferroni correction showed significant differences between Word Targets and Actual Word Forms for word-final coronals and dorsals. Both coronals [X 2 (1, N = 895) = 40·799, p < ·001 and dorsals [X 2 (1, N = 895) = 15·632, p < ·001] were more frequent in Word Targets than in Actual Word Forms. However, there was no significant difference between Word Targets and Actual Word Forms for word-final labials [X 2 (1, N = 895) = 4·052, p = ·132].
Results of the Generalized Mixed Effects Negative Binomial Regression on Spontaneous Word Measures in Word-final Position. The Intercept Represents the Reference Condition: Spontaneous Word Measure Was Word Targets, Place was Coronal, Manner was Fricative.

Notes. estimatea = exponential estimate; vocab = vocabulary.
For manner of articulation in word-final position, relative to vocabulary size, there were significant interaction effects of spontaneous word measure (Word Targets vs. Actual Word Forms) with vocabulary growth [F(1,595) = 15·808, p < ·001]. Differences between Word Targets and Actual Word Forms tended to decrease with growth in vocabulary size for both place and manner in final position. The spontaneous word measure (Word Targets vs. Actual Word Forms) by final manner interaction was significant [F(1,595) = 15·922, p < ·001]. Oral stops in Word Targets were significantly more frequent than in Actual Word Forms [X 2 (1, N = 595) = 19·433, p < ·001]. In contrast, there was no significant difference between the frequencies of final fricatives in Word Targets and Actual Word Forms [X 2 (1, N = 595) = 4·199, p = ·081].
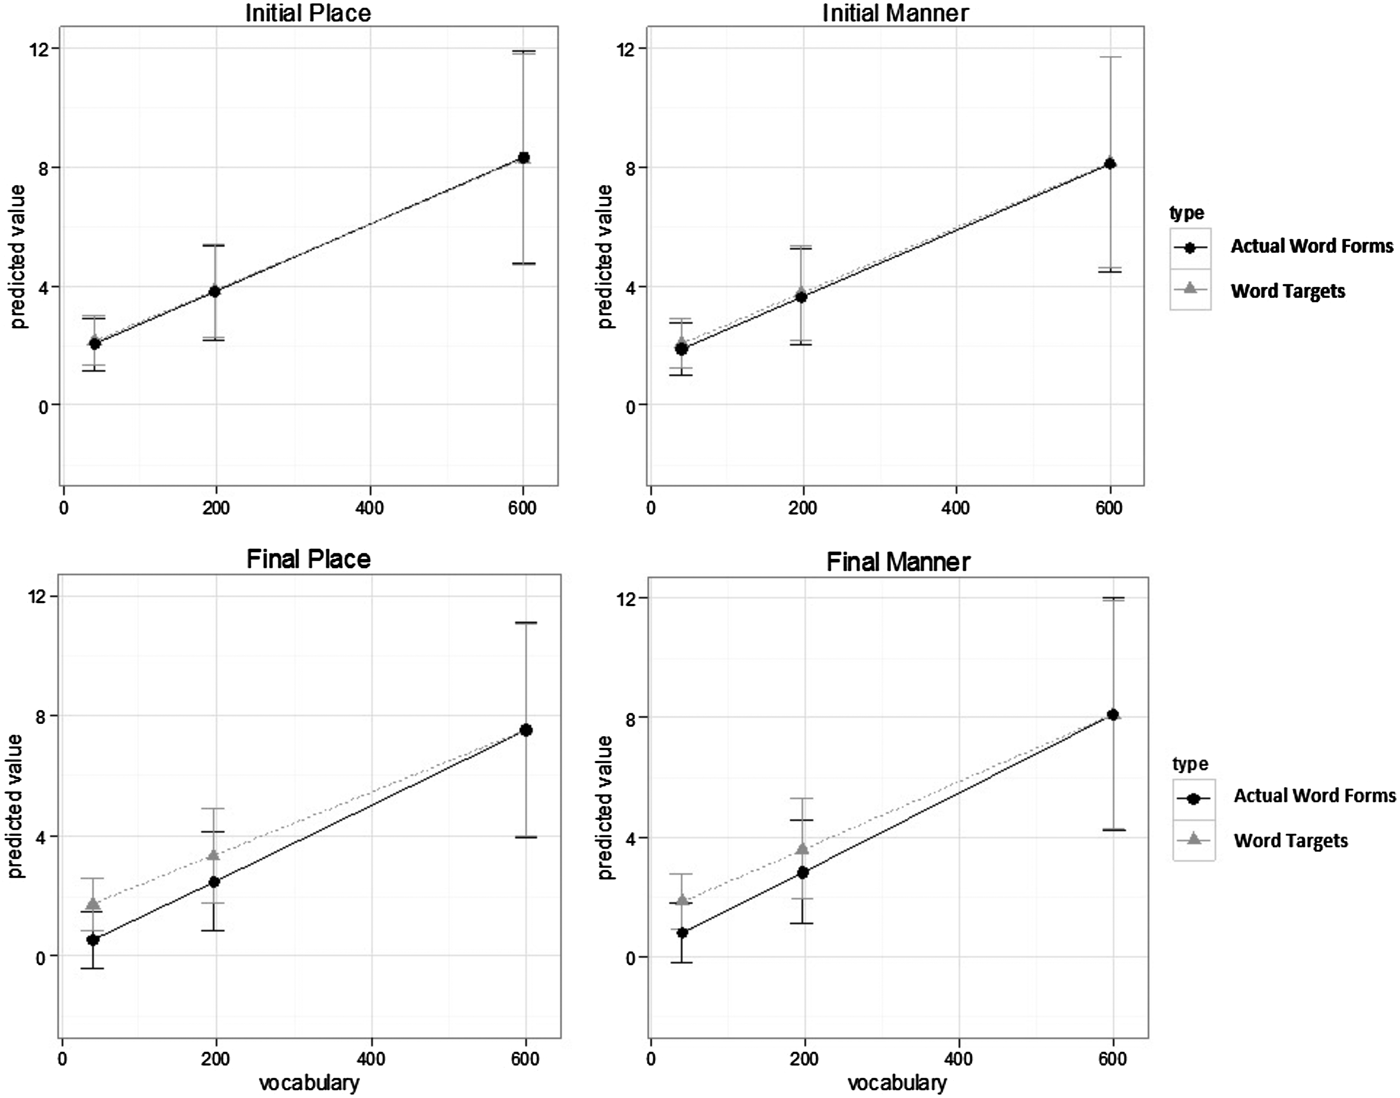
To further investigate the significant interaction in word-final position between the spontaneous word measure (Word Targets, Actual Word Forms) and the numerical variable of vocabulary growth, three pairwise contrasts with the Bonferroni correction were evaluated (at vocabulary sizes of 40, 197, and 600) using the ls means package in R (Lenth, Reference Lenth2015). These datapoints were chosen because qualitative changes appeared to be occurring when the children were producing approximately 40 word types (see Figures 4 and 5 and the discussion above); the mean vocabulary size was 197 for this group of six children and 600 was the peak vocabulary level. Both word-final – place and word final – manner analyses showed identical outcomes. For final place, when vocabulary size was relatively smaller (40 and 197), differences between Word Targets and Actual Word Forms were significant [40: z = 6·461, p < ·001, 197: z = 4·461, p < ·001]. When vocabulary size was larger (600), the difference between Word Targets and Actual Word Forms was not significant [z = 0·007, p = ·994]. For word final – manner, the differences between Word Targets and Actual Word Forms were significant at a vocabulary size of 40 [z = 5·490, p < ·001], and 197 [z = 3·750, p < ·001], but not when vocabulary size was relatively large (600) z = 0·014, p = ·989]. Figure 6 illustrates these results and shows the predicted means for the Word Targets and Actual Word Forms based on the regression with growth of vocabulary size for place and manner in initial and final positions.
Comparisons of Word Targets and Actual Word Forms at three different vocabulary sizes. Graphs illustrate interactions between place and manner of articulation with vocabulary size at 40, 197, and 600 word types. The upper two graphs show predicted values across phonological dimensions for word-initial position, the bottom two graphs show predicted values for word-final position based on the regression models using the lsmeans package in R.

To summarize, differences between Word Targets and Actual Word Forms were observed in both word-initial and word-final position. In word-initial position, only fricatives were significantly more frequent in Word Targets than in Actual Word Forms. However, there were no differences for the other dimensions of place and manner, and no significant interactions between spontaneous word measure (Word Targets, Actual Word Forms) and vocabulary size. In contrast, in word-final position, coronal and dorsal place as well as oral stop manner were significantly more frequent in Word Targets than in Actual Word Forms. In addition, there was a significant interaction between Spontaneous Word measures (Word Targets, Actual Word Forms) and vocabulary size, for both place and manner. Vocabulary growth also interfaced with final position: the differences between Word Targets and Actual Word Forms were significant when vocabulary size was small (40) or medium (197), but not when vocabulary size was large (600).
General discussion
The goal of this study was to evaluate phonological ‘selection and avoidance’ hypotheses for understanding the earliest phases of speech and language acquisition. Confirmation of such hypotheses can support the assertion that children are choosing words to say in their natural communication environment that reflect their own ability to produce the sounds in those words. We analyzed the phonological properties of labial, dorsal, coronal place, and oral stop and fricative manner of consonant articulation in initial and word-final position in spontaneously produced early words. We presented statistical comparisons of the distributions of sounds in the children's lexicon (the Word Targets they choose to say) and their Actual Word Forms across a longitudinal period of early vocabulary growth between the chronological ages of 0;8 and 2;11. We proposed that a phonological selection hypothesis would be affirmed by a lack of significant differences between distributions of phonological dimensions over time as measured by vocabulary growth (i.e., children would be choosing word targets to say that were consistent with their sound production capacities). Alternatively, we argued that overall significant differences between distributions in Word Targets and Actual Word Forms would be consistent with proposed lexical dominance hypotheses (i.e., children would be choosing words to say without consideration of whether they could produce the sounds in those words). The results from our analyses of spontaneous speech did not provide straightforward support for either a phonological ‘selection and avoidance’ theory of early word production, nor for an overall lexical strategy where children choose to say words regardless of their speech production capacities. Results for word-initial position showed no significant differences between Word Targets and Actual Word Forms for dimensions of labial, coronal, or dorsal place or for oral stop manner. This lack of significant differences for four out of five phonological dimensions is consistent with the hypothesis that the words children choose to say in this early period are influenced by the words’ phonological properties: children chose to say words containing sounds they can produce in word-initial position.
However, the distribution of fricatives was significantly higher in children's Word Targets than in their Actual Word Forms. Fricatives tend to appear later in phonological output (e.g., Gildersleeve-Neumann, Davis, & MacNeilage, Reference Gildersleeve-Neumann, Davis and MacNeilage2000). Based on online word-recognition experiments, it has been argued previously that fricatives may have a different (and later-specified) status compared to oral stops in early phonological lexical representations (Altvater-Mackensen, van der Feest, & Fikkert, Reference Altvater-Mackensen, van der Feest and Fikkert2014). The current result indicates that children are choosing to say words containing fricatives, even though those sounds are likely not part of their own production inventory, which is consistent with a lexical but not phonological dominance hypothesis. In other words, while a phonological strategy for choosing words to say may overall appear to dominate in word-initial position in this early period, when we consider a comprehensive set of phonological dimensions we see that children are choosing Word Targets with initial fricatives, even when they may not actually be able to produce them consistently. This lack of consistency in findings across different sound types emphasizes the importance of including both place and manner when evaluating lexical versus a phonological dominance hypotheses in this early stage.
Relative to vocabulary size in word-initial position, we found no significant differences between Word Targets and Actual Word Forms related to vocabulary size changes for these children across the whole period of analysis. The results for word-initial position indicate that, within this period from the onset of word use to production of more than 600 word types in spontaneous speech, the children demonstrated stable patterns for choosing their target words to say related to their production repertoire. This finding is again most consistent with a phonological dominance hypothesis.
In contrast, our results for word-final position showed significant differences between Word Targets and Actual Word Forms for both place and manner of articulation. Proportions of coronal and dorsal place and oral stop manner were significantly more frequent in these six English-learning children's Word Targets than in their Actual Word Forms. Coronal place and oral stop manner occur frequently both in English (Ladefoged & Maddieson, Reference Ladefoged and Maddieson1996) and in child inventories (e.g., Davis et al., Reference Davis, MacNeilage and Matyear2002). Dorsals are not frequent in children's early word productions (e.g., Aoyama, Peters, & Winchester, Reference Aoyama, Peters and Winchester2010; Stoel-Gammon, Reference Stoel-Gammon1985). The higher overall proportions of coronals, oral stops, and dorsals in children's Word Targets compared to their Actual Word Forms can be related to their higher frequency in the input even if the children cannot actually produce them consistently in word-final position. These findings for word-final position are thus more consistent with a lexical dominance hypothesis where children attempt to say words regardless of their actual ability to produce them in final position, that is vulnerable to omission by English learning children (Kim & Davis, Reference Kim and Davis2015).
Only the proportions of labial place and fricative manner in word-final position were not significantly different in children's Word Targets and their Actual Word Forms. Labials have been reported to occur early in children's inventories (e.g., McCune & Vihman, Reference McCune and Vihman2001), while fricatives are described as later-acquired sounds. In sum, the significant differences found between Word Targets and Actual Word Forms for coronals, dorsals, and oral stops, but not for labials and fricatives, make the results for word-final position less straightforward as well: these findings do not provide unambiguous support for either a ‘lexical or a ‘phonological’ dominance hypothesis.
Several factors may have influenced the outcomes for word-final position, apart from the typical developmental timeline for mastery of these different sound contrasts by young children. Importantly, final consonant deletion is a prominent and persistent strategy characterizing children's output. In our data, the rate of final consonant deletion was 63% in CVC forms. As a result, word-final position overall can be considered relatively less stable in children's actual productions of early words. This is consistent with the early speech perception literature, where it has been argued that children initially may focus more on phonological detail in word-initial than word-final position (see, e.g., Nazzi & Bertoncini Reference Nazzi and Bertoncini2009; Swingley, Reference Swingley2005, Reference Swingley2009). Word-final consonants may be more difficult to identify, and word-initial consonants are relied on to a much greater extent in word identification even by adults (Creel, Aslin, & Tanenhaus, Reference Creel, Aslin and Tanenhaus2008; Redford & Diehl, Reference Redford and Diehl1999). In this light, the attested differences between Word Targets and Actual Word Forms in children's production patterns in word-final position compared to word-initial position may not be surprising. Many early speech production studies to date have focused on word-initial position to evaluate the influence of lexical versus phonological factors (e.g., Edwards et al., Reference Edwards, Munson and Beckman2011). However, since CVC monosyllables are the dominant word form in English language input (Ladefoged & Maddieson, Reference Ladefoged and Maddieson1996), both word positions seem cogent to fully understanding lexical–phonological relationships in the words children choose to say in this period.
Unlike in word-initial position, vocabulary growth interfaced with the findings for word-final position. There were significant differences between Word Targets and Actual Word Forms at small (40) and medium (197) vocabulary levels, but no significant differences at large (600) vocabulary levels in this cohort of children. These significant differences found in Word Targets and Actual Word Forms at lower vocabulary levels support the assertion that the children choose words to say based on their lexical properties, rather than on whether those words reflect their own speech production capacities. The lack of significant differences between Word Targets and Actual Word Forms at higher vocabulary levels, on the other hand, would be consistent with a phonological dominance hypothesis. However, it is probable that the children were accurately matching phonological properties of Word Targets more frequently when they had achieved 600 word types. For instance, at 197 words vocabulary size, these children demonstrated 75% final consonant deletion; final consonant deletion was reduced to 29% by 600 words. In addition, the consonant inventory is quite larger later in vocabulary development in typically developing children (e.g., Sander, Reference Sander1972). Thus, the lack of significant differences between word-final Word Targets and Actual Word Forms at the highest vocabulary sizes in our sample could arguably be attributed to growth in accuracy, rather than consistent with the proposal that children only produce words with sounds they can say. This could be addressed in future studies by an analysis of word-level accuracy patterns in word-final as well as word-initial positions in this cohort. Overall, results in word-final position show a contrastive tilt toward a lexical strategy, with little evidence that children choose Word Targets based predominantly on their own production system capacities. It is interesting to note here that previous studies (e.g., Scobbie, Gibbon, & William, Reference Scobbie, Gibbon, William, Broe and Pierrehumber2000; Song et al., Reference Song, Demuth and Shattuck-Hufnagel2012) have reported young children's use of ‘covert contrasts’, especially in word-final position: detailed acoustic analyses of children's speech in those studies reveal that they do maintain consistent differences between phonemes that are not overtly clear in perception for adult listeners. Detailed acoustic analyses, as well as claims about the exact representation of phonological contrasts that are not yet mastered in production, lie outside the scope of the current study. However, these are issues that may be addressed in potential future studies connecting the use of specific covert contrasts with children's choice of early words. The choice of target words that likely do not match children's production capacities may be taken to suggest a lexical strategy consistent with data on word-initial position for children older than four (consistent with Munson et al., Reference Munson, Edwards, Beckman, Cohn, Fougeron, Huffman, Cohn, Fougeron and Huffman2011; Pierrehumbert, Reference Pierrehumbert, Bybee and Hopper2001).
However, in word-initial position, only words containing fricatives showed a similar pattern of significant differences between Word Targets and Actual Word Forms. The overall results in word-initial position do not, therefore, support a lexical dominance hypothesis at this early phase of language acquisition. Thus, our findings show that when distributions of different phonological dimensions in different word positions are considered, there is not a clear case to be made for either phonological or lexical dominance in these English-learning children.
The data in this study are from a large longitudinal corpus of spontaneous data, consistently collected from the onset of word use. Structured responses elicited in experimental settings enable more control over relevant variables. However, unlike the data we analyzed for this study, experimental set-ups do not necessarily reveal a child's functional use of lexical and phonological capacities to initiate and respond to daily life situations with spoken language forms. Most previous lexical selection studies have utilized experimental study designs (e.g., Edwards et al., Reference Edwards, Munson and Beckman2011; Storkel, Reference Storkel2009), and have focused exclusively on word-initial position. Experimental paradigms, including word repetition designs, might enable a more nuanced understanding of some of these findings in word-final position. In particular, the diverse findings for different components of the phonological system in word-final position would profit from exploration of differences observed in children's output in experimental paradigms. Relevant factors could be controlled more than they are in this naturalistic corpus of spontaneous output. Information about the presence of labials and fricatives in individual children's phonetic inventories might also help to disambiguate these results. It should be noted, however, that while very young children can relatively easily participate in perception experiments (e.g., eye tracking paradigms), production experiments such as elicited production tasks can be more challenging with young children in a laboratory setting (and even in the home).
One final differentiating aspect of our methodological approach is the use of vocabulary size as the comparison metric in observing change over this period. These six children were individually unique in both their age of onset (Table 1) and the number of words acquired during the study. Age of word use onset varied between 8 and 12 months. The number of words acquired were quite diverse as well, ranging from less than 500 to almost 1,000 across these six children. This finding indicates a range of volubility and language maturity. This type of information could ultimately contribute to the ongoing dialogue on early differential diagnosis of ‘late talking toddlers’ (e.g., Stokes, Reference Stokes2010, Reference Stokes2014). Future research might consider whether children with lower volubility showed for instance less mature phonological profiles relative to independence of phonological properties consistent with a finding of significant differences between Word Targets and Actual Word Forms.
Our analyses of this large corpus of spontaneous data enables a broad picture of relationships between Word Targets children attempt and their actual realizations across an early period of acquisition of lexical and phonological components of language. We did not analyze other concurrent aspects of early acquisition that are likely to affect word choices in this age range, such as word level complexity or morphophonological properties. These and other aspects of language growth could be important dimensions affecting the phonological output for words children choose to say, and might be a fruitful additional avenue to comprehensive analysis of our questions. In addition, consideration of the perception of input frequencies (i.e., word and phoneme frequencies, neighborhood density) and subsequent cognitive processing including memory, storage, and retrieval capacities related to the statistical characteristics of the input, have been proposed as dominating expansion of the lexicon during this early period (e.g., Storkel & Hoover, Reference Storkel and Hoover2011; Storkel & Lee, Reference Storkel and Lee2011). These cognitive processing approaches enable consideration of the child's acquisition of phonological and lexical patterns from the input language. Like the addition of contextual variables such as word level complexity and morphophonological interfaces, analyses of phonological characteristics of children's lexical output might provide an additional dimension to understanding of cognitive processing dimensions of acquisition.
Taken together, the present results challenge an ‘either–or’ ‘phonological’ or ‘lexical’ dominance hypothesis for understanding development in the earliest periods of lexical and phonological growth. Positional differences related to the outcomes of this study are apparent, and are potentially related to differences in perceptual processing and/or production system capacity in initial and word-final positions. To gain further insight on the factors influencing speech production patterns in early words children produce spontaneously, future studies could focus on analyzing contextual influences of morphological or word-level complexity (including phonotactic and syllable structure) as well as growth in accuracy for all phonological dimensions. These questions about the process of early typical language production development that this study generates in the context of the large body of well-established data on speech production and phonological milestones indicate the merit of investigating a multifactorial set of influences on the words that young children choose to say.
Supplementary material
For supplementary material for this paper, please visit <https://doi.org/10.1017/S0305000917000484>.