Zn3P2 is an important II–V group semiconductor for optoelectronic applications since it has a direct bandgap in the range of 1.4–1.6 eV that corresponds to the optimum range for solar energy conversion.Reference Fagen1–Reference Yang, Chueh, Morber, Snyder, Chou and Wang3 Its large optical absorption coefficient of >104 cm−1 and long minority diffusion length of ∼13 μm allow high current collection efficiency.Reference Fessenden, Sobhanadri and Subramanian4 Furthermore, both of its constituent atoms are abundant, which leads to increased feasibility of large scale development of devices, such as solar cells, infrared, and/or ultraviolet sensors.Reference Kakishita, Aihara and Suda5, Reference Misiewicz, Bryja, Jezierski, Szatkowski, Mirowska, Gumienny and Placzekpopko6 In addition, Zn3P2 is also considered as one of the most promising negative electrode materials for Li-ion battery application due to its low polarization and decent reaction potential with Li during initial and successive cycles.Reference Bichat, Monconduit, Pascal and Favier7, Reference Kishore and Varadaraju8 Syntheses of one-dimensional (1D) nanostructures, such as tubes, wires, belts, and ribbons, have drawn considerable attention because of potential applications in nanosize devices with various functionalities due to their unique physical and chemical properties. A number of studies have reported synthesis of 1D Zn3P2 nanostructures using various synthesis methods including thermochemical processes,Reference Shen, Bando, Hu and Goldberg9–Reference Shen, Chen, Bando, Goldberg and Zhou11 thermal-assisted pulsed laser ablation,Reference Hermann, Madan, Wanlass, Badri, Ahrenkiel, Morrison and Gonzalez2 and chemical vapor deposition.Reference Liu, Dai, Ma, Yang and Qin12, Reference Liu, Dai, You, Xu, Ma, Yang, Zhang and Qin13 From the perspectives of technology, however, the synthesis temperatures in those reports are rather high ranging from 850 to 1400 °C.Reference Hermann, Madan, Wanlass, Badri, Ahrenkiel, Morrison and Gonzalez2, Reference Fessenden, Sobhanadri and Subramanian4–Reference Misiewicz, Bryja, Jezierski, Szatkowski, Mirowska, Gumienny and Placzekpopko6, Reference Shen, Bando, Hu and Goldberg9–Reference Shen, Chen, Bando, Goldberg and Zhou14 In this letter, we report low-temperature synthesis of Zn3P2 nanowires using a chemical reflux method.
The details of Zn3P2 nanowires synthesis are as follows: 5 mL of trioctylphosphine (TOP) is supplied to a glass vessel in which a Zn foil that was precleaned with a solution of nitric acid (5 mL), sulfuric acid (5 mL), and distilled water (50 mL) is placed on the top of a fritted glass. When heated, the Zn foil is exposed to vapors of TOP. The vapors of TOP are refluxed back to the bottom of the glass vessel due to the cooling water at the top of the vessel. The glass vessel was heated to 350 °C for 2 h and then slowly cooled to room temperature. The vessel is purged with nitrogen gas throughout the synthesis process to prevent undesirable oxidation. Zn3P2 nanowires are found to synthesize on the both sides of the Zn foil with amber-brownish color. The synthesized Zn3P2 nanowires are examined with Zeiss Supra 55 VP field emission scanning electron microscope (FE-SEM, Oberkochen, Germany) at 5 kV for overall morphology. Then, the Zn3P2 nanowires are carefully exfoliated from the Zn foil and transferred on a Cu grid coated with lacey carbon film for transmission electron microscopy (TEM) examination. TEM analysis was performed using 200 kV JEOL JEM-2100F field emission TEM equipped with energy dispersive x-ray spectroscopy (EDS, Tokyo, Japan) in Analytical and Diagnostics Laboratory at State University of New York at Binghamton. For elemental and phase analyses, nanobeam EDS (NBEDS) and nanobeam electron diffraction (NBED) techniques were used. High-resolution TEM (HRTEM) in combination with fast Fourier transform (FFT) technique is also implemented to investigate comprehensive microstructural details.
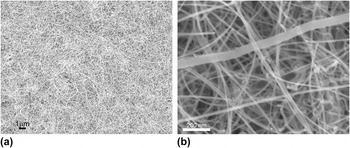
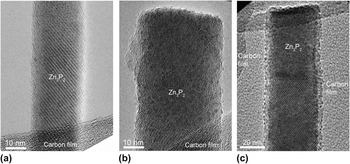
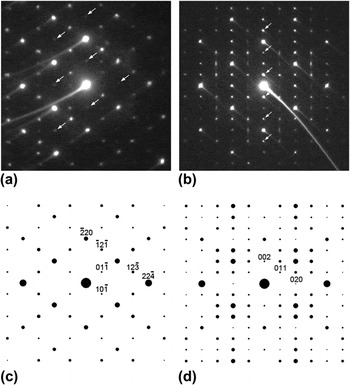
Figure 1 shows plan-views of FE-SEM image of the as-prepared sample. As an overview at low magnification, Fig. 1(a) shows that Zn3P2 nanowires are grown on large surface area of Zn foil in a highly homogeneous way, while a magnified image of Fig. 1(b) reveals that straight nanowires mixed with some of curly ones are found to have a diameter distribution ranging from ∼15 to 70 nm. To investigate the structural details of the nanowires, TEM images were also obtained. Figures 2(a)–2(c) are typical bright-field TEM images obtained from nanowires with different diameter sizes. It should be noted that all the images show no signs of either significant lattice strains or lattice defects such as dislocations and stacking faults. In fact, all the images show lattice fringes indicating their high crystalline quality. To identify the crystal structure of the nanowires, NBED technique was applied to nanowires in Figs. 2(b) and 2(c) with a probe size of ∼30 nm as exhibited in Figs. 3(a) and 3(b), respectively (The tails in some of bright intensity maxima should be disregarded as they are artifacts from CCD camera shutter movement). The structure factor, Fhkl, where hkl represents a specific Bragg reflection, was calculated for tetragonal α-Zn3P2 phase (a = 0.8095 nm, c = 1.147 nm, and space group = P42/nmc). The calculation of the electron diffraction patterns was based on the kinematical approximation:

Plan-view scanning electron microscopy images of Zn3P2 nanowires grown on the surface of Zn foil. (a) Low magnification image showing nanowires grown uniformly on a large area. (b) High magnification image showing nanowires with different diameters.

Bright-field transmission electron microscopy (TEM) images of Zn3P2 nanowires placed on top of lacey carbon film. All three images of (a), (b), and (c) show no sign of significant lattice strain or defects.

Nanobeam electron diffraction (NBED) patterns and their simulations based on kinematical approximation. (a) NBED pattern obtained from the nanowire in Fig. 2(b). (b) NBED pattern obtained from the nanowire in Fig. 2(c). (c) Electron diffraction simulation of [111] tetragonal α-Zn3P2 that corresponds to (a). (d) Electron diffraction simulation of [100] tetragonal α-Zn3P2 that corresponds to (b).

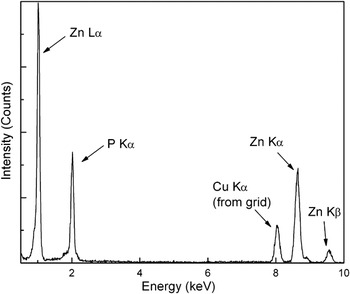
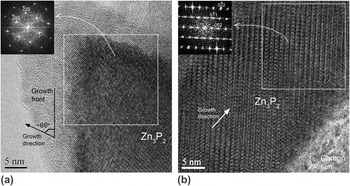
where fn is the atomic scattering factor for atom n at fractional coordinates (xn, yn, zn). Among the calculation results for various zone axes, the net patterns of [111] and [100] of α-Zn3P2 phase are shown in Figs. 3(c) and 3(d). They match well with Figs. 3(a) and 3(b) respectively. Note that the extra intensity maxima (i.e., forbidden Brag reflections) denoted by white arrows in Figs. 3(a) and 3(b) are due to double diffraction.Reference Williams and Carter15 Thus, these simulated patterns unambiguously show that the synthesized nanowires are tetragonal α-Zn3P2. Figure 4 shows a NBEDS result from the nanowire shown in Fig. 2(c) with a probe size of ∼30 nm. It shows the existence of Zn and P peaks. In addition, the quantitative calculation result of Fig. 4 yielded ∼58 at.% of Zn and ∼42 at.% of P, which is close to 3:2 of Zn:P ratio in α-Zn3P2 phase. Based on the NBED and NBEDS results, it is concluded that α-Zn3P2 is successfully synthesized by the current method. Previous studies showed that when metals are exposed to TOP, P–C bond of TOP can easily break resulting in phosphorous diffusion into the metals. This indicates that TOP is a highly reactive compound that can be used as a stabilizer, solvent, and phosphorous source when synthesizing metal phosphide nanocrystals. Chen et al.Reference Chen, Tai and Chi16 hypothesized catalytic cleavage of P–C bond in an effort to explain the formation of FeP by the reaction between TOP and nanocrystalline Fe. Khanna et al.Reference Khanna, Jun, Hong, Baeg and Mehrotra17 synthesized nanocrystalline InP with bulk In and TOP. More recently, Henkes et al.Reference Henkes, Vasquez and Schaak18 reported a more general approach for synthesizing nanocrystals of various transition metal phosphides, such as Ni2P, PtP2, Rh2P, Au2P3, Pd5P2, and PdP2 at low temperatures ranging from 290 to 370 °C. Note that they used preformed metal nanocrystals as metal precursors to obtain nanosized design. They later showed the syntheses of bulk powders and thin films of Zn3P2 using Zn bulk powder (∼7 μm) and Zn thin film grown on glass substrate (1 × 3 cm2).Reference Henkes and Schaak19 However, Zn3P2 nanoparticles were not reported by them due to lack of Zn nanocrystal precursors. To the best of our knowledge, this study is the first to synthesize Zn3P2 nanowires at a temperature as low as 350 °C without the use of Zn nanocrystals as precursors. To further investigate the structural details of these α-Zn3P2 nanowires, HRTEM images were obtained from the nanowires in Figs. 2(b) and 2(c) and are exhibited in Figs. 5(a) and 5(b). FFT patterns of each image are obtained to investigate relationship between crystal orientation and nanowire growth direction as shown in the insets of Figs. 5(a) and 5(b). The zone axes of each FFT pattern correspond to [111] and [100] of α-Zn3P2 phase, respectively, which matches well with the NBED result shown in Fig. 3. In addition, it should be noted that the growth direction of the two nanowires is parallel to [101] of α-Zn3P2. This result is in good agreement with the growth direction of thermochemically synthesized Zn3P2 nanobelts and nanowires reported previously.Reference Shen, Chen, Bando, Goldberg and Zhou11, Reference Shen, Ye, Goldberg, Hu and Bando20 Furthermore, the angle between growth direction and growth front of α-Zn3P2 is measured ∼66° as denoted in Fig. 5(a). It is worth noting that the angle between [101] direction and (101) plane in α-Zn3P2 is ∼71° since α-Zn3P2 has tetragonal structure. Although this calculated angle of ∼71° is close to the measured angle of ∼66°, the 5° difference between these values cannot be neglected. Accordingly, it is considered that the growth front of α-Zn3P2 may be in the vicinity of (101) plane. A previous first-principle simulation study on β-tetragonal boron crystal (a = 1.014 nm, c = 1.417 nm and space group = P41) showed that the highest surface energy plane is (101).Reference Hayami and Otani21 Given that β-tetragonal boron has similar tetragonal structure, it can be presumed that the α-Zn3P2 nanowires in this study grows on a vicinity of (101) plane that may have the highest surface energy with a [101] growth direction. However, more theoretical work for α-Zn3P2 might be necessary to elucidate the details of this point. In addition to the structural characterization reported in this study, an effort to investigate optoelectronic properties of the α-Zn3P2 nanowires is underway using photoluminescence and cathodoluminescence.
Energy dispersive x-ray spectroscopy spectrum obtained from the nanowire in Fig. 2(c).

High-resolution TEM (HRTEM) images of α-Zn3P2 nanowires. (a) HRTEM image obtained from the nanowire in Fig. 2(b) with fast Fourier transform (FFT) pattern indicating that growth direction is along [110] (b) HRTEM image obtained from the nanowire in Fig. 2(c) with FFT pattern also indicating that growth direction is along [110].

In summary, α-Zn3P2 nanowires were synthesized using Zn foil and TOP by chemical reflux method at temperature as low as 350 °C. SEM and TEM images show that their diameter varies from ∼15 to 70 nm. NBED and NBEDS clearly reveal their phase as tetragonal α-Zn3P2. Phosphorous diffusion is proposed as its formation mechanism. In addition, it is also proposed that α-Zn3P2 may grow on a vicinity of the highest surface energy plane of (101) along [101] direction as a possible growth mechanism.
ACKNOWLEDGMENTS
This research was partially funded by Small Scale Systems Integration and Packaging Center (S3IP) at State University of New York at Binghamton. S3IP is a New York State Center of Excellence and receives funding from the New York State Office of Science, Technology, and Innovation, the Empire State Development Corporation, and a consortium of industrial members. This work was also supported in part by Defense Advanced Research Projects Agency under Award No. HR00011101002.