Implication
This study provides the definition of the breeding goal for a local breed of goat used for meat production in the tropics. The breeding goal definition includes weight and reproduction as well as parasite resistance and resilience traits. This step of defining a breeding goal is crucial for the implementation of a breeding programme aimed at increasing goat meat production in Guadeloupe by giving priority to the indigenous breed of the island.
Introduction
Approximately 31 000 goats (Agreste, 2006) are reared for meat production in Guadeloupe (F.W.I.,16° Lat. N., 61° Long. W.). The local breed, named Creole, originates from a mixture of West African, European and Indian breeds imported to the island during colonisation. Naturally selected for its ability to thrive in a tropical environment, this breed shows good reproduction and parasite resistance performance. However, the goat population in Guadeloupe does not fulfil the local demand for goat meat since production represents only 58% of the apparent consumption (Alexandre et al., Reference Alexandre, Asselin de Beauville, Shitalou and Zebus2008). As an example, 1.4 tonnes of goat and sheep meat were imported in 2009 (Agreste, 2009).
Therefore, farmers, extension services and the guadeloupean organisation of goat breeders, called Cabricoop, have decided to organise a breeding programme for the Creole breed, designed with INRA expertise. Selection on adaptative as well as productivity traits has been advised for tropical areas (Shrestha and Fahmy, Reference Shrestha and Fahmy2007) due to the specific constraints (climate, diseases, poor feeding) of the environment. As shown by a survey (Gunia et al., Reference Gunia, Mandonnet, Arquet, de la Chevrotière, Naves, Mahieu and Alexandre2010), farmers wish to improve the meat production of the Creole breed as well as its reproductive performance. Disease resistance traits should also be included in the breeding objective, because of the high prevalence of gastro-intestinal nematodes such as Heamonchus sp. and Trichostrongylus sp. in Guadeloupe. They are responsible for more than 80% of the mortality rate before weaning (Aumont et al., Reference Aumont, Pouillot, Simon, Hostache, Varo and Barré1997) and 30% loss in productivity in kids at slaughter age.
Defining the breeding goal is the preliminary crucial step before the setting up of a breeding programme (Hazel, Reference Hazel1943, Ponzoni and Newman, Reference Ponzoni and Newman1989). The breeding goal should encompass all traits affecting profitability, which is typically defined at the farm level. Economic values are derived by the partial differentiation of the profit function with respect to individual traits (Moav and Hill, Reference Moav and Hill1966). Each economic value indicates the marginal increase in profit caused by the improvement of one physical unit of the corresponding trait of the breeding objective.
The aim of this study was threefold: first, derive the economic values of production, reproduction and parasite resistance traits for a Creole goat breeding scheme, second, analyse the sensitivity of these economic values to changes in the economic and the environmental context of goat meat production and third, identify the means of assisting farmers in appropriating and exploiting our findings.
Material and methods
Basic features of the model
A deterministic bio-economic model was developed to calculate the economic values of breeding goal traits relevant to Creole goat production. This model considered the profit of a Guadeloupean goat farm as a function of specific biological traits to be genetically improved. Deterministic models have been used widely for such aims, in goat (Bett et al., Reference Bett, Kosgey, Bebe and Kahi2007) or sheep (Kosgey et al., Reference Kosgey, van Arendonk and Baker2003; Legarra et al., Reference Legarra, Ramon, Ugarte and Perez-Guzman2007), as well as in cattle (Phocas et al., Reference Phocas, Bloch, Chapelle, Becherel, Renand and Menissier1998). The level of management modelled for the farm used in this study was above average relative to those farms registered in the Cabricoop breeding organisation. This model farm represented the management and farming practices observed in most Cabricoop farms (Gunia et al., Reference Gunia, Mandonnet, Arquet, de la Chevrotière, Naves, Mahieu and Alexandre2010). Some practices described in the model (such as three kiddings in 2 years and selective anthelmintic treatment of does) were not found in all Cabricoop farms. Hence, this goat farm model does not represent the diversity of practices in field data, but instead represents a technical level that could be achieved by most of the Cabricoop farms.
Performance recording has not yet been implemented by farmers. Therefore, the herd performances and production parameters were derived from the 30-year-old database of the Creole goat experimental herd at INRA-Gardel (Alexandre et al., Reference Alexandre, Aumont, Fleury, Mainaud and Kandassamy1997; Mahieu et al., Reference Mahieu, Archimede, Fleury, Mandonnet and Alexandre2008). The prices used in this study were the market prices of 2010. Only variable costs (which depend on the level of animal performance) and fixed cost per animal (which does not vary with the performance level) were considered in the cost function. The fixed costs per herd were not considered because they do not depend on the level of animal performance or the number of animals. Therefore, the profit function is a gross margin of the modelled farm without accounting for any salaries, subsidies, investments or housing taxes. Because genetic improvement should not be a substitute for technical progress, the farm management is assumed to be at maximum technical efficiency to derive the economic values (Smith et al., Reference Smith, James and Brascamp1986). Equations of costs and income, as well as the profit function were calculated using Microsoft Excel 2002®.
Description of herd management
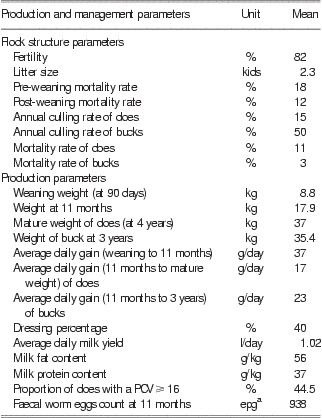
A pasture-fed herd of 30 Creole does was simulated. The flock composition and dynamics for one year are shown in Figure 1. The corresponding flock structure parameters as well as the main production parameters are presented in Table 1.
Flock composition of the modelled Creole goat herd for one year.

Flock structure and production parameters in the Creole goat farm model

PCV = packed cell volume.
aWorm eggs per gram of faeces.
The 30 does were mated three times in 2 years with a ratio of 15 does mated per natural service buck. Kids were reared by their mothers, before being weaned at 3 months of age. Female replacement was carried out within the herd, whereas new bucks were brought in from other farms. Each year, 7.8 young females were kept to renew the doe herd. The other females and males were sold at 11 months of age (except for one male, which was consumed by the farmer's family); three young bucks were sold alive for breeding, whereas the others were sold for slaughter. All kids were sold at 11 months of age, whatever their weight. All goats grazed on Dichantium sp. pasture throughout the year. Commercial concentrate was given to does for 2 months before delivery and for 3 months after kidding and to kids from weaning to 11 months of age. Growth was assumed to be linear from weaning to 11 months and from 11 months to adult age.
Kids between 3 and 11 months of age and adult bucks were regularly drenched against gastro-intestinal nematodes. The main species found in Guadeloupe were Haemonchus contortus, Trichostrongylus colubriformis and Oesophagostomum columbianum. The drenching frequency was three times per year for adults and four times per year for kids. Does were drenched using the Famacha© method (Bath et al., Reference Bath, Malan and Van Wyk1996). The Famacha© method is a measurement of the ocular conjunctivae colour, which allows selective drenching of only anaemic animals. In humid countries where H. contortus, a haematophagous nematode, is the primary parasitic pathogen, this method can be applied at the farm level to reduce the number of treatments administered. However, other parasites such as T. colubriformis cannot be monitored using this method. In Creole goats, a Famacha© score of 4 or 5 (anaemic animals) can be related to a packed cell volume (PCV) below or equal to 16. Using this method, 55.5% of the fertile Creole does were drenched each year and the drenched goats were dosed 1.54 times on average (Mahieu et al., Reference Mahieu, Arquet, Kandassamy, Mandonnet and Hoste2007). The does that failed to reproduce were not treated. They were less susceptible to gastro-intestinal nematode infection than pregnant and lactating does (Mandonnet et al., Reference Mandonnet, Bachand, Mahieu, Arquet, Baudron, Abinne-Molza, Varo and Aumont2005).
All animals were sprayed fortnightly with acaricide to prevent the occurrence of tick-borne diseases such as heartwater and dermatophilosis.
Breeding goal traits
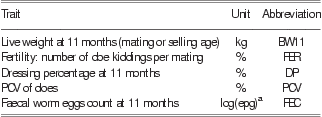
The main traits in the breeding goal and their abbreviations are presented in Table 2. In order to ensure a balanced selection, the breeding objective consisted of two production traits, live weight (BW11) and dressing percentage (DP) at 11 months (the mating or selling age), and one reproduction trait: fertility (FER), which is the number of doe kiddings per mating. To assess animal response to parasite infection, two other traits were also considered. PCV, a resilience trait, is a measurement of the proportion of red cells in the blood used to diagnose anaemia caused by haematophagous parasites such as H. contortus. This trait was measured on does. Faecal worm eggs count (FEC) is a measurement of the number of gastro-intestinal parasite eggs found in the faeces. This measurement was used to assess the resistance of an animal and was measured on kids at 11 months of age. Mortality was not included in the breeding objective because the estimate of the genetic variability of this trait in Creole goats was null, probably due to the very low number of dead animals in the INRA herd (Mandonnet et al., Reference Mandonnet, Ducrocq, Arquet and Aumont2003). Litter size (LS) was deliberately not included in the breeding objective because in the model only the positive effects of LS could be taken into account easily, although negative effects are expected, such as increased labour for the farmer (especially if artificial milking is required) and lower kid weight.
Breeding goal traits for Creole goat
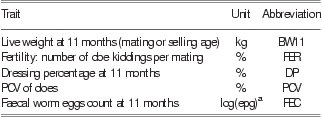
BW11 = live weight at 11 months; FER = fertility; DP = dressing percentage at 11 months; PCV = packed cell volumes of does; FEC = faecal worm eggs count measured at 11 months of age.
aNatural logarithm of worm eggs per gram of faeces.
Income and costs equations
Profit
The farm profit was calculated as the difference between income and costs:
 $$ {\rm{Profit}}\,{\rm{ = }}\,{\rm{Income - costs}} $$
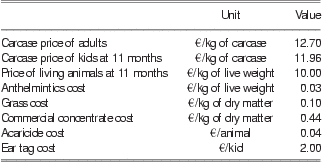
The farm income came from the sale of animals: culled does and bucks sold for meat purposes as well as a few young bucks sold to other herds for breeding purposes. The farm costs were feed (grass and commercial pellets), treatments against gastro-intestinal parasites and ticks as well as identification (ear tags). The prices are presented in Table 3.
Prices in the income and costs equations of the Creole goat farm model
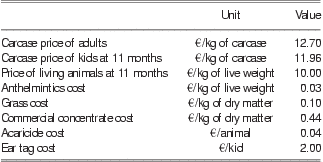
For the income and costs equations, five categories of animals were considered in the model: kidding does, non-kidding does, bucks, kids from 3 to 11 months of age (i.e. weaning to selling or mating age) and kids before weaning. The average number of animals in each category was expressed as a function of the number N 0 of mated does according to the following equation:
 $$ {{N}_i}\,{\rm{ = }}\,{{a}_i}\,\times \,{{N}_{\rm{0}}} $$
where i is the animal category (one kidding does, two non-kidding does, three bucks, four kids from 3 to 11 months of age, five kids before weaning) and ai is a coefficient varying for each animal category:
a 1 = FER;
a 2 = (1-FER);
a 3 = breeding buck to breeding does ratio;
N 4, the number of kids from 3 to 11 months of age, is the average of the number of kids weaned and the number of kids reaching 11 months of age.
a 4 = 0.5 × [1.5 × FER × LS × (1 – pre-weaning mortality rate) + 1.5 × FER × LS × (1–pre-weaning mortality rate) × (1 – post-weaning mortality rate)];
a 4 = 0.5 × 1.5 × FER × LS × (1 – pre-weaning mortality rate) × (2 – post-weaning mortality rate);
N 5, the number of kids before weaning, is the average of the number of kids born and the number of kids weaned.
a 5 = 0.5 × [1.5 × FER × LS + 1.5 × FER × LS × (1– pre-weaning mortality rate)];
a 5 = 0.5 × 1.5 × FER × LS × (2 – pre-weaning mortality rate).
The coefficient 0.5 was used to calculate the average between the two groups of kids: weaned kids and 11-month-old kids for a 4, and kids born and weaned for a 5. The coefficient of 1.5 was used to take into account the three kiddings in 2 years to obtain an annual profit function.
Income
The income equations were:
 $$ \displaylines{ {\rm{Income}} \ {\rm{of}} \ {\rm{meat}}\,& {\rm{ = }} \,{\rm{Number}} \ {\rm{of}} \ {\rm{animals}} \ {\rm{sold}} \ {\rm{for}} \ {\rm{meat}}\, \cr & \quad\times \,{\rm{Live}} \ {\rm{weight}}\,\times \,{\rm{Dressing}} \ {\rm{percentage}} \cr & \quad\times \,{\rm{Price}} \ {\rm{per}} \ {\rm{kg}} \ {\rm{of}} \ {\rm{carcase}} \ {\rm{weight}} $$
 $$ \displaylines{ {\rm{Income}} \ {\rm{of}} \ {\rm{animals}} \ {\rm{sold}} \ {\rm{alive}}\qquad\qquad\qquad\qquad\quad\cr\quad{\rm{ = }} \,{\rm{Number}} \ {\rm{of}} \ {\rm{animals}} \ {\rm{sold}} \ {\rm{alive}} \,\times \,{\rm{Live}} \ {\rm{weight}}\, \cr & \ \,\quad\times \,{\rm{Price}} \ {\rm{per}} \ {\rm{kg}} \ {\rm{of}} \ {\rm{live}} \ {\rm{weight}} $$
The selling price of a goat depended on its carcase or live weight. A fixed price per kg of live weight was also considered for young males sold alive as reproducers. For animals sold for slaughter, the price per kg of carcase weight was higher for the stock class where the average carcase weights are higher. Carcase quality is not presently taken into account in Guadeloupe. Carcase price is not much higher than live weight price due to the differences in marketing network: official for goats sold to the slaughter house (controlled prices with taxes and fees deducted) and informal for live goats (with free prices).
Subsidies were ignored in the income equations because of their variable amounts and questionable persistence.
Costs
The cost equations were:
 $$ \displaylines{ & {\rm{Anthelmintics}} \ {\rm{costs}} \ {\rm{for}} \ {\rm{does}}\, \qquad\qquad\qquad\qquad\qquad\cr & \; \; {\rm{ = }}\,{{N}_{\rm{1}}}\,\times \,{\rm{Proportion}} \ {\rm{of}} \ {\rm{does}} \ {\rm{with}} \ {\rm{PCV}} \cr & \ \ \; \; \leq \,{\rm{16}}\,\times \,{\rm{Live}}\,{\rm{weight}}\,\times \,{\rm{Price}}\,{\rm{of}}\,{\rm{anthelmintics}} \cr & \; \quad\times \,{\rm{Number}} \ {\rm{of}} \ {\rm{treatments}} \ {\rm{per}} \ {\rm{year}} $$
 $$ \displaylines{ {\rm{Anthelmintics}} \ {\rm{costs}} \ {\rm{for}} \ {\rm{bucks}} \ {\rm{and}} \ {\rm{kids}}\cr\quad{\rm{ = }} \,{{N}_i}\,\times \,{\rm{Live}} \ {\rm{weight}} \,\times \,{\rm{Price}} \ {\rm{of}} \ {\rm{anthelmintics}}\, \cr & \ \ \quad\times \,{\rm{Number}} \ {\rm{of}} \ {\rm{treatments}} \ {\rm{per}} \ {\rm{year;}} \ {\rm{with}}\;i\,{\rm{ = }}\,{\rm{3,4}} $$
 $$ \displaylines{ {\rm{Acaricide}} \ {\rm{costs}}\,{\rm{ = }} \,{{N}_i}\,\times \,{\rm{Price}} \ {\rm{of}} \ {\rm{acaricide}} \cr & \ \ \times \,{\rm{Number}} \ {\rm{of}} \ {\rm{treatments}} \ {\rm{per}} \ {\rm{year;}} \ \cr\quad{\rm{with}}\;i\,{\rm{ = }}\,{\rm{0,3,4}} $$
 $$ {\rm{Identification}} \ {\rm{costs}}\,{\rm{ = }}\,{{N}_{\rm{5}}}\,\times \,{\rm{Price}} \ {\rm{of}} \ {\rm{ear}} \ {\rm{tags}} $$
The price of anthelmintics (expressed per kg of live weight) was the average of the market prices of different anthelmintics commonly used in Guadeloupe.
Feed costs were based on diets composed of Dichantium sp grass and commercial pellets if the grass was not sufficient to meet the animal feed requirements. Energy and protein needs as well as feed intake were calculated for each animal category. They were expressed as a function of live weight and average daily gain and were calculated using two different systems. INRA equations (Sauvant et al., Reference Sauvant, Giger-Reverdin and Meschy2007) were used for doe diets. The requirements and feed intake were different for does whose mating was successful and does whose mating was unsuccessful. Increased feed requirements for lactating does were attributed to the does and not to the kids. For bucks and growing kids, the equations of metabolisable energy and metabolisable protein requirements considered were based on the equations of Sahlu et al. (Reference Sahlu, Goetsch, Luo, Nsahlai, Moore, Galyean, Owens, Ferrell and Johnson2004) for indigenous goats. Dry matter (DM) intake was calculated from the equations of Luo et al. (Reference Luo, Goetsch, Nsahlai, Moore, Galyean, Johnson, Sahlu, Ferrell and Owens2004). For all animal categories, the amount of grass required was increased by 10% from the calculated amount to take into account refusals. The cost of grass was the maintenance cost of the pasture. It included the cost of fencing, fertilisation, irrigation and labour (Fleury J., personnal communication). The cost of pellets was the commercial price paid by Cabricoop farmers.
Derivation of the economic values of BW11, FER, DP and PCV in the base situation
The economic values were the marginal variation in annual profit per mated doe, due to the increase of one unit of the trait, while maintaining the other traits constant at the population mean:
 $$ {\rm{EV}}\:t\;{\rm{ = }} \ {\rm{(}}{{P}_{\rm{1}}}{\rm{ - }}{{P}_{\rm{0}}}{\rm{) /}}{{N}_{\rm{0}}} $$
with EV t being the economic value of trait t, P 1 the profit after an increase of one unit of the trait t and P 0 the initial profit for N 0 = 30 does in the base situation. The economic values of the breeding goal traits were derived by ‘finite differences’ approximation of derivatives rather than by direct analytical derivatives of the profit function with respect to trait t, since the efficiency of this procedure has been proven by Phocas et al. (Reference Phocas, Bloch, Chapelle, Becherel, Renand and Menissier1998).
Standardised economic values were calculated by multiplying the economic values (expressed in euro per physical unit of the traits) by the genetic standard deviations of the traits. The units of the traits used in this study are presented in Table 2. These genetic standard deviations were 1.89 for BW11, 12.25 for FER, 1.60 for PCV and 0.38 FEC in Creole goats (Gunia et al., Reference Gunia, Phocas, Arquet, Alexandre and Mandonnet2011). For DP, no data were available for Creole goats or other breeds of goat in the literature; hence, the genetic standard deviation (1.22) given by Greeff et al. (Reference Greeff, Safari, Fogarty, Hopkins, Brien, Atkins, Mortimer and van der Werf2008) in sheep was used.
Derivation of the economic value for DP implies only the income equation for meat (3) because DP was not linked to any cost.
Derivation of the economic value for BW was based on the income equations (3) and (4), the feed cost equations (equations not detailed here) and the anthelmintic cost equations (5) and (6).
FER influences the number of kids, as shown in equation (2). Therefore, derivation of its economic value requires that changes in all income and costs concerning kids are taken into account. Changes in the feed costs of does also need to be accounted for because the diet differs between fertile and barren does.
According to equation (5), a change in profit ΔP will occur on increasing the proportion of does with PCV ⩾ 16 by 1%. In order to rescale this ΔP at the animal level to derive the economic value for PCV, an underlying normal distribution of PCV was assumed that allowed the derivation of the economic value for PCV by using the probability density function Φ(x) of a normal distribution:
 $${\rm{E}}{{{\rm{V}}}_{{\rm{PCV}}}}\,{\rm{ = }}\,{\rm{\rPhi (}}x{\rm{)}} \cdot {\rm{\rDelta }}P$$
 $${\rm{\rPhi }}(x)\, = \,\frac{1}{{\sqrt {2\pi {{\sigma }^2} } }}{{e}^{{{{\rm{ - }}{{{(x{\rm{ - }}\mu )}}^2} } \mathord{\left/ {\vphantom {{{\rm{ - }}{{{(x{\rm{ - }}\mu )}}^2} } {2{{\sigma }^2} }}} \right. \kern-\nulldelimiterspace} {2{{\sigma }^2} }}}} $$
with μ = 24.13 being the mean of the PCV distribution, σ = 4.97 its phenotypic standard deviation and x = 16 the threshold value of PCV.
Independent calculation of the economic value of FEC when anthelmintics are ineffective
No obvious relationship was found between FEC and costs or revenues, which made it difficult to derive the economic value of this trait. Therefore, a somewhat different method was used to independently calculate the maximum economic value of FEC when selection was focused only on this trait. The economic value of FEC was derived by considering the expected profit and average FEC in the base situation and in a situation in which anthelmintics were ineffective, because parasites had developed resistance to these products.
The equation used to derive the economic value of FEC was as follows:
 $$ \displaylines{ {\rm{E}}{{{\rm{V}}}_{{\rm{FEC}}}}\, = & \,\frac{1}{{{{N}_0}}}\;\times \;\frac{{\delta {{P}_{}}}}{{\delta {\rm{FEC}}}}\, = \,\frac{1}{{{{N}_0}}}\;\times \;\frac{{\delta {{P}_{}}}}{{\delta ({{e}^{{\rm{FEC}}}} )}}\,\times \;\frac{{\delta ({{e}^{{\rm{FEC}}}} )}}{{\delta {\rm{FEC}}}}\; \cr & \, \approx \,\frac{1}{{{{N}_0}}}\;\times \;\frac{{{{P}_A}{\rm{ - }}{{P}_B}}}{{{{e}^{{\rm{FE}}{{{\rm{C}}}_A}}} {\rm{ - }}{{e}^{{\rm{FE}}{{{\rm{C}}}_B}}} }}\;\times \;{{e}^{{\rm{FE}}{{{\rm{C}}}_B}}} $$
with EVFEC being the economic value of FEC, N 0 the number of does, which was fixed and equal to 30, P the profit, e FEC the exponential function of FEC, A the situation with ineffective anthelmintics and B the base situation. FEC was the only trait in the breeding goal, because the change in profit was not calculated by maintaining BW11, FER and PCV constant at their average level.
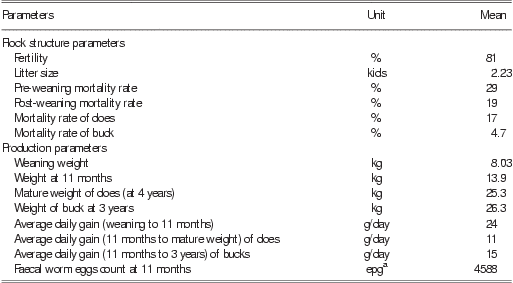
In the situation with ineffective anthelmintics, parasites were not controlled by any veterinary product. Mortality and FEC increased (by 55% to 60% for mortality and by almost 400% for FEC), whereas FER, LS and growth rate decreased by 1.2%, 3% and 35%, respectively. Drenching was discontinued due to its inefficiency. The modified parameters in this extreme scenario are presented in Table 4. They were based on the performance records at INRA-Gardel, in 1999, when the anthelmintics applied were no longer effective (Chevalier, Reference Chevalier2001). Considerable loss in production had occurred during this period, with an increase in mortality of 55% to 60% and a decrease in the average daily gain of 35% for kids during the pre-weaning period and the post-weaning period until 11 months of age. No data were available on growth after 11 months or on the mortality of mature does and bucks. We therefore assumed that they showed the same reduction in growth and increase in mortality as that found in kids after weaning.
Flock structure and production parameters in the Creole goat farm model in the situation with ineffective anthelmintics
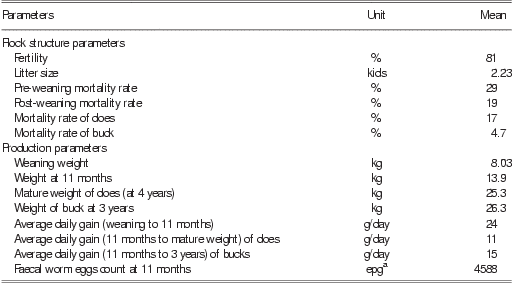
aWorm eggs per gram of faeces.
Sensitivity analysis
After deriving the economic values in the base scenario with a fixed number of does, six alternative situations were studied to analyse the sensitivity of profit and economic values to changes in the economic context. The six situations were as follows: fixed amount of grass, fixed amount of pellets, increased carcase price, increased pellets price, drought and expensive anthelmintic.
Fixed feed input scenarios
In the base situation described previously, the number of does was assumed to be fixed each year. Another strategy to define a breeding goal is to consider some physical or economical constraints that involve using a fixed amount of input instead of a fixed number of does. The following two situations were considered: a situation with a fixed amount of grass and a situation with a fixed amount of pellets. These two situations provided a good insight into the importance of the different traits in two different feeding systems. Limitation in the amount of grass may occur when farmers cannot expand their pasture surface. On an island, this situation is highly probable. Financial difficulties (limitation in cash flow) could also prevent the farmer from increasing the quantity of pellets. In these two situations, the economic values were derived by changing the number of does after a marginal increase in a trait in order to fit the size of the quota (Groen, Reference Groen1989). If the marginal increase of the trait led to an increase in the total amount of fodder (or pellets) consumed, the total number of does was reduced to maintain the amount of feed at its initial level. The economic values in the fixed input situations were calculated using the following equation:
 $$ {\rm{E}}{{{\rm{V}}}_{{\rm{ft}}}}\,{\rm{ = }}\,{\rm{ (}}{{P}_{{\rm{ft}}}} \ {\rm{ - }} \ {{P}_{\rm{0}}}{\rm{) /}}{{N}_{\rm{0}}} $$
where EVft is the economic value of the trait t in the situation with fixed input f, N 0 the number of mated does in the base situation, P ft the profit after an increase of one unit of the trait t and adjustment of the number of does in the situation with fixed input f and P 0 the initial profit.
The new number of does changed to fit the quota and used in the income and costs equations for the calculation of P ft was as follows:
 $$ {{N}_{ft}}\, = \,\frac{{Q{{T}_f}}}{{\sum _{{i\, = \,1}}^{4} {{a}_i}{{Q}_{ift}}}} $$
with Nft being the new number of does after an increase of one unit of the trait t in the situation with fixed input f, QTf the total quantity of feed f given to the whole herd in one year in the base situation before the increase of trait t, Qift the quantity of feed f given to the animal category i (i = 1 to 4) in one year after an increase of one unit of the trait t and ai the coefficient varying for each animal category i already described in equation (2).
Slow increase in price
In this situation, we studied the consequences on the farm profit of realistic and likely increases in carcase weight price and concentrate price. We estimated what these prices would be in 2015 using a linear extrapolation of the prices of 2000 to 2010. Each price was increased while maintaining the other prices constant. The carcase price would be increased by 2.50€ per kg of carcase, which represents an increase of 20% of the initial price. The commercial pellet price would be increased by 0.048€ per kg of DM matter, which represents an increase of 10.9% of the initial price.
Extreme situations
We tested the stability of the farm profit and the economic values in two extreme situations: ‘drought’ and ‘expensive anthelmintic’. These two situations were realistic, even if their probability of occurrence may be low.
In the ‘drought’ scenario, rainfall would decrease markedly in the driest part of the island at present, where most of the goat farms are situated. In this situation, farmers would have to buy hay instead of growing grass. We used the present price of hay (0.40€/kg of DM), even though this price could increase in the case of long-lasting drought. Hay is expensive in Guadeloupe because agricultural machines are imported from Metropolitan France at a high cost, their maintenance is expensive and the volumes of hay produced are limited, resulting in high production costs per hey bale.
In the ‘expensive anthelmintic’ scenario, the present anthelmintic would no longer be used, because of a resistance developed by parasites to these products. The only possibility of treatment would be the use of a new and expensive anthelmintic. Its price was fixed at 10 times the present price, that is, 0.3€ per kg of live weight.
The use of alternative scenarios provided us with the possibility of assessing the robustness of the economic values to variations in the economic and environmental contexts.
Results
Income, costs and profit
The income, costs and profit in different situations are presented in Table 5. In the base situation as well as in the situation with a fixed feed input, the profit of the farm was 90.29€/doe per year. The total profit per year for the 30-doe herd was therefore 2709€. In the situation used to calculate the economic value of FEC, with ineffective anthelmintics, profit was reduced by 73.36€. This reduction represents an 81% loss in profit, which clearly emphasises the cost of parasite infections. In the slow price rise situations, the change in profit varied. The 11% increase in the price of the pellets had a limited impact on profit, which only increased by 3.5%, whereas the 20% increase in carcase price had a major impact on profit, which increased by 40%. In extreme situations, profit decreased markedly. In the drought situation, the costs exceeded the income and the farmer lost 96€/doe per year. Buying hay would not be a good solution to compensate for the lack of grass. A 44% loss in profit was observed in the situation that required the use of expensive anthelmintics.
Income, costs and profit (in €/doe per year) of a Creole goat farm in different situations

General consideration of economic values in alternative situations
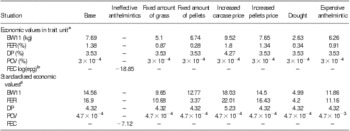
The economic values for BW11, FER, DP and PCV in alternative situations as well as the economic value of FEC are presented in Table 6. The economic values of BW11, FER, DP and PCV were all positive in the base situation as well as in the alternative situations. The economic value of FEC was the only negative one. Using standardised economic values facilitated a comparison of traits. In the base situation, FER had the highest standardised economic value, followed by BW11, which clearly indicated the importance of these two traits. The standardised economic value of FEC came in third position (in absolute value). However, this value should be considered with caution due to the calculation method used. It reflects more the maximum economic value of FEC than its current value in 2011. The economic value of DP was lower, whereas the economic value of PCV was very low, which is probably due to the underestimation of the costs associated with PCV. The highest economic values were found for the scenario with increased carcase price and the lowest for the drought scenario. The economic values of BW11 and FER were very sensitive to changes of situation, which was undoubtedly due to their relationship with the modified prices and costs, whereas the economic values of DP and PCV, which were not related to the value or the amount of concentrate and grass, remained unchanged.
Economic values for each trait of the breeding goal for Creole goat in different situations

BW11 = live weight at 11 months; FER = fertility; DP = dressing percentage at 11 months; PCV = packed cell volumes of does; FEC = faecal worm eggs count measured at 11 months of age.
aEconomic values expressed in €/trait unit per doe per year.
bNatural logarithm of worm eggs per gram of faeces.
cEconomic values in €/trait unit per doe per year multiplied by the genetic standard deviation of the trait. The standardised economic values provided the gain in profit caused by the improvement of one genetic standard deviation of the trait.
Economic values with fixed feed input
In the situations with fixed feed input, the economic values of BW11 and FER decreased. In the situation with a fixed amount of pellets, the economic values of FER decreased considerably (by 80%), whereas BW11 was less affected (12% loss). In contrast, in the situation with a fixed amount of grass, the economic values of FER and BW11 decreased almost equally (by 37% for FER and by 34% for BW11).
An increase in FER of 1% led to an increase in the number of pregnant and lactating does as well as the number of kids. Therefore, the total amount of grass and pellets consumed increased. The increase in the amount of pellets provided was especially high, due to the higher proportion of pregnant and suckling does, which required pellets in addition to grass. The reduction in the number of does to fit the quota was therefore higher in the situation with a fixed amount of pellets than in the situation with a fixed amount of grass. In the fixed amount of pellets scenario, the new profit (P ft) and therefore the economic value of FER decreased more markedly than in the fixed amount of grass scenario.
An increase in BW11 led to an increase in the average weights of kids and does, whose energy requirements increased accordingly. For kids, the amounts of both grass and pellets increased. For does, the feed intake capacity increased and allowed them to fulfil their additional energy requirements with grass instead of concentrate. The total amount of pellets consumed by does was even slightly reduced. Hence, an increase in BW11 of 1 kg had more consequences on the total amount of grass than on the total amount of pellets. The reduction in the number of does to fit the quota is therefore higher in the situation with a fixed amount of grass, which decreased the new profit (P ft) and therefore the economic value of BW11 more drastically than in the situation with a fixed amount of pellets.
Economic values with a slow increase in price
In the situation with carcase prices increased by 20%, the economic values of BW11, FER and DP increased by 21% to 30%. In the scenario where pellet prices increased by 11%, the economic value of FER decreased by 3%, BW11 remained almost the same and the others did not vary. The economic value of BW11 remained stable because an increase of this trait did not alter significantly the total amount of pellets consumed, as explained in the previous paragraph.
Economic values in extreme situations
The extreme situations modified the economic values considerably. They all decreased, except for the economic value of PCV, which multiplied by 10 in the situation with the use of expensive anthelmintics. This economic value was still lower than the economic values of BW11 and FER, which were reduced by 18% and 34%, respectively. In the drought scenario, the standardised economic values of BW11, FER and DP were all in the same range. The increased price of hay reduced the economic values of BW11 by 66% and those of FER by 75%, bringing them down to the same level as the economic value of DP.
Discussion
Profit and economic values under alternative situations
This research sought to use profit equations in a bio-economic model to derive the economic values of the traits of the breeding objective. As shown in a survey (Gunia et al., Reference Gunia, Mandonnet, Arquet, de la Chevrotière, Naves, Mahieu and Alexandre2010), goat breeding is a supplementary professional activity. The small size of herds (about 30 does) and the 2709€ profit per year are not sufficient to maintain this activity alone. Extreme situations jeopardise the future of the goat breeding activity by substantially decreasing a farmer's profit.
The differences in the timing and the frequency of expression of the different traits were not accounted for by using discounted geneflow principles. The geneflow principles are based on the number of expected improved progeny when following the genes of an improved reproducer. When accounting for each of the selection paths in a closed selection nucleus, each selection path makes the same genetic contribution in the long term. Because all costs and expenses are expressed by breeding doe over all age classes, the right number of expressions of improved parents for each trait is accounted for at a given time period at birth of their progeny. Then, the only issue is the fact that one may wish to discount the expressions of improved traits to account for their different patterns of expressions over time. In our case, all traits are expressed with a very short period of time for a given progeny cohort (between 11 months and 16 months). Therefore, there is not a long delay between the expression of production and functional traits. Considering discounting would only have a significant impact on the relative economic weights if high discount rates are considered. However, imposing high discount rates yields a short-term perspective, which conflicts with the inherently long-term nature of genetic improvement. Without discounting, the weight of the resilience trait is almost set to zero in the breeding goal. Discounting will only reinforce the very small economic value of resilience trait v. production and resistant traits. Therefore, we propose to test the robustness of the economic weights and regularly update them, rather than to account for discounted geneflow in the derivation of breeding goal.
Therefore, running alternative scenarios facilitated the assessment of the robustness of the economic values to changes of situation. The economic values under different constraints were not equivalent in Creole goats. As summarised by Groen (Reference Groen1989), different economic values are obtained in different perspectives (fixed number of animals, fixed input) when the value of production factors differs between alternative uses. The equivalence of the economic value in different perspectives could be obtained with the use of three conditions, but were not applicable in our case. They are as follows: one-product situation or income (or other products considered as negative costs), equilibrium in a purely competitive industry and all costs being variable per unit of product. The fixed number of does or fixed amount of grass situations are probably the most appropriate perspectives in Guadeloupe breeding systems.
Choice of traits and comparison of their economic values
The traits included in the breeding objective were close to the traits desired by farmers, as reported in a survey (Gunia et al., Reference Gunia, Mandonnet, Arquet, de la Chevrotière, Naves, Mahieu and Alexandre2010). Creole goats are an indigenous breed, whose meat production is important to farmers. Its maternal qualities are also important, especially for farmers using Creole does as a maternal line for crossbreeding.
Fertility had the highest standardised economic value in the base situation. This trait was the most important, even if the replacement costs were not included in the derivation of its economic value. Age was the main reason for culling and does that failed to reproduce were generally kept for one or two other cycles of reproduction before culling.
LS was not included in the breeding objective due to the difficulties in modelling the negative effects of an increase of this trait. Moreover, farmers want to maintain the high LS of Creole goats (2.3 kids per doe), without increasing it. In studies on sheep breeds used for meat production (Wolfova et al., Reference Wolfova, Wolf and Milerski2009; Byrne et al., Reference Byrne, Amer, Fennessy, Cromie, Keady, Hanrahan, McHugh and Wickham2010), LS was one of the traits with the highest standardised economic value. As observed by Amer et al. (Reference Amer, McEwan, Dodds and Davis1999a), the economic value of LS depended on its current average level and on the intensity of the production systems. These authors modelled the proportion of singles, twins, triplets and quadruplets as flock prolificacy increased. The economic value reduced as LS increased and the proportion of triplets or quadruplet increased. They found an optimal LS of 2.2 or 2.3 lambs per ewe lambing, which is the current prolificacy level of Creole does. Therefore, evolution of LS will be monitored and in case of necessity, future selection could aim at stabilising LS by including this trait in a restricted selection index (Itoh and Yamada, Reference Itoh and Yamada1987).
Desirability of selecting Creole goats for parasite resistance and resilience
In Guadeloupe, as in many tropical countries, gastrointestinal parasites are endemic. Their infections are responsible for a high mortality rate, reduced growth rate, reduced reproductive performance and general loss of productivity (Perry et al., Reference Perry, Randolph, McDermott, Sones and Thornton2002). Our results show that goat farm profit is reduced by 81% when parasite infections are no longer controlled by anthelmintics.
However, even if these results emphasise the benefits of using anthelmintics to control parasitism, these anthelmintics are not a sustainable solution because firstly, they have a cost, which in some rare cases cannot be compensated for by reduced loss (Perry et al., Reference Perry, Randolph, McDermott, Sones and Thornton2002), secondly, residues of these products can be found in meat (Love, Reference Love1999) and thirdly, parasites develop resistance to the treatments (Kaplan, Reference Kaplan2004). Kaplan (Reference Kaplan2004) suggested the possibility that in some places, there would not be any efficient anthelmintic remaining. Non-chemical alternative approaches have been developed for more integrated parasite control for small ruminants (Jackson and Miller, Reference Jackson and Miller2006; Torres-Acosta and Hoste, Reference Torres-Acosta and Hoste2008) and for Creole goats (Mahieu et al., Reference Mahieu, Arquet, Fleury, Coppry, Marie-Magdeleine, Boval, Archimede, Alexandre, Bambou and Mandonnet2009). These methods include (among others) rotational grazing, improved nutrition, selective drenching and selection of resistant or resilient animals (Baker and Gray, Reference Baker and Gray2004). Selection is a long-term process with a persistent effect, in contrast to the other short-terms measures aimed at reducing FEC (Eady et al., Reference Eady, Woolaston and Barger2003). Resistant animals, with low FEC, can suppress the establishment of parasites or parasitic burden. Resilient animals are those that are capable of surviving and producing when facing a parasitic challenge. They can resist the effects of infection rather than resisting the infection itself (Bisset and Morris, Reference Bisset and Morris1996).
Feasibility of selecting Creole goats for parasite resistance and resilience
Faecal egg count, the density of worm eggs excreted in the faeces of the animal, is the traditional and convenient trait used to select animals resistant to parasites (Bishop and Morris, Reference Bishop and Morris2007). These animals contaminate the pasture less, which has a strong impact on the epidemiology of worm infection and reduces the need for treatments (Eady et al., Reference Eady, Woolaston and Barger2003). Another measurement, PCV, has also been used as a proxy for resilience (Baker et al., Reference Baker, Audho, Aduda and Thorpe2001) when H. contortus is predominant. When animals are submitted to H. contortus infections, the genetic correlation between PCV and FEC is negative (Baker et al., Reference Baker, Audho, Aduda and Thorpe2001; Mandonnet et al., Reference Mandonnet, Aumont, Fleury, Arquet, Varo, Gruner, Bouix and Khang2001). Hence, resistant animals are also resilient, at least under the challenge of this parasite (Bisset and Morris, Reference Bisset and Morris1996).
Attempts to select sheep and goats for resistance/resilience while comparing their performance with susceptible or control lines have proven successful (Bisset and Morris, Reference Bisset and Morris1996; Vagenas et al., Reference Vagenas, Jackson, Russel, Merchant, Wright and Bishop2002). Commercial programmes that include resistance to nematodes in sheep have already been implemented in Australia, New Zealand (Woolaston and Baker, Reference Woolaston and Baker1996) and the United Kingdom (Jackson and Miller, Reference Jackson and Miller2006). Previous studies in Creole goats have shown that it is possible to select this breed for resistance and resilience to parasites (Mandonnet et al., Reference Mandonnet, Aumont, Fleury, Arquet, Varo, Gruner, Bouix and Khang2001) by selecting on their FEC or PCV.
Benefits of selecting goats for resistance and resilience
Limited knowledge is available on goats in tropical countries under H. contortus infection. The main results produced are in sheep under infection from other parasite species. The selection of small ruminants on parasite resistance is interesting because it seems that parasites cannot develop resistance against the mechanisms that their host has developed (Kemper et al., Reference Kemper, Elwin, Bishop, Goddard and Woolaston2009). It is also the method with the strongest effect on FEC reduction (Eady et al., Reference Eady, Woolaston and Barger2003), which means reduced egg output leading to reduced pasture larval contamination, and therefore subsequent larval challenge (Bishop and Stear, Reference Bishop and Stear2003). The main benefits are thus in terms of the epidemiology of the parasite. The original hypothesis was that selecting for low FEC would increase live weight. However, this predicted increase in productivity has not often been attained (Greer, Reference Greer2008). Even if gains in productivity are hypothetical, it seems reasonable to assume some reduction in the number of necessary anthelmintic treatments, as occurred in Merino sheep selected for low FEC (Kahn et al., Reference Kahn, Knox, Walkden-Brown and Lea2003). However, selecting animals on FEC would not be equivalent to drenching them, because adult worms would not be eliminated from the digestive tract.
Selection on resilience is a method that does not apply any selection pressure on parasites, which can complete their life cycle unimpeded. Therefore, resilient animals will still contaminate the pasture. However, they can better cope with the challenge in terms of productivity (Bisset and Morris, Reference Bisset and Morris1996). In contrast to selection on resistance, production benefits can be expected from selection on resilience. Nevertheless, it is difficult to predict the actual benefit in terms of productivity, reduced number of treatments or potential change in FEC. Selection on resilience has received less attention in the literature than selection on resistance and the results vary according to the nematode species, the traits used to assess resilience (drench requirement, growth under challenge, PCV) and, more generally, the environment and breeding conditions.
In Creole goats, there were no significant genetic correlations between FEC and production traits, but there were favourable genetic correlations between PCV of does and weight and fertility (Gunia et al., Reference Gunia, Phocas, Arquet, Alexandre and Mandonnet2011). The genetic correlation of FEC measured on kids at 11 months and PCV of does was not significantly different from zero, whereas the genetic correlations between FEC and PCV measured at the same age were strongly negative (Mandonnet et al., Reference Mandonnet, Aumont, Fleury, Arquet, Varo, Gruner, Bouix and Khang2001; Mandonnet et al., Reference Mandonnet, Menendez-Buxadera, Arquet, Mahieu, Bachand and Aumont2006). Selecting Creole goats on FEC will obviously reduce FEC in the herd and therefore pasture contamination. Productivity benefits will probably be limited, but it seems possible that drenching requirements will be reduced. Selecting on PCV will help maintain better herd health and will probably lead to some gain in production. The need for treatments will be reduced. However, it is not clear whether FEC will decrease significantly. These two traits would clearly be complementary for improving resistance and resilience in goats.
Deriving economic values for parasite resistance and resilience
As reported by Kominakis and Theodoropoulos (Reference Kominakis and Theodoropoulos1999), assigning an economic value to FEC is not straightforward. Previous attempts in the scientific literature for FEC in sheep relied mostly on the desired gain method (Woolaston, Reference Woolaston1994; Kominakis and Theodoropoulos, Reference Kominakis and Theodoropoulos1999; Gicheha et al., Reference Gicheha, Kosgey, Bebe and Kahi2005), even if this method has been criticised (Gibson and Kennedy, Reference Gibson and Kennedy1990). An attempt to derive an economic value for FEC in sheep in New Zealand and Australia was made by Amer et al. (Reference Amer, Woolaston, Eady and McEwan1999b). This economic value takes into account a reduction in parasite epidemiology and reduced contamination in commercial flocks. It links changes in flock average FEC to changes in the adult worm burden. These changes in worm burden are related to the costs of reduced body weight and fleece weight and the costs of increased mortality. The economic values for FEC varied from −0.02 NZ$ to −0.03 NZ$ per 1% increase in flock average FEC in ewes and in lamb, respectively, for one year in New Zealand, and from −0.13 A$ to 0.04 A$ per adult and per lamb, respectively, in summer-dry areas in Australia for one year. They are low, and even if comparison is hazardous due to differences in currencies and breeding systems, they seem closer to the economic value of PCV found in Creole goats than to the maximum economic value attributed to FEC in Creole goats.
In this study, the economic value of FEC is derived considering an extreme situation, when parasites are resistant to anthelmintics and when infection levels are not controlled by any alternative method. This weighting is a maximum value and does not reflect the economic value at the present time. Nevertheless, it provides a good insight into the long-term benefits of parasite resistance when anthelmintics will no longer be effective. Selection on reduced FEC will become increasingly more important as the drenching frequency reduces when shifting from a preventive to a curative approach. Analysis of the database on production traits and FEC for Creole goats during normal years (when parasites were controlled by anthelmintics) did not show any clear relationship between FEC and production traits. The effects of change in pasture contamination have not yet been evaluated for Creole goats, but it seems that an increase of FEC of one unit during the normal period does not lead to any change in productivity. The high weighting of FEC is therefore the result of a non-linear phenomenon, when a sudden increase in FEC results in considerable production loss.
The economic value of PCV only accounts for the costs of anthelmintic treatments that are still relatively inexpensive, which explains the low value obtained. The costs and performance recording of PCV may be considered more expensive than the potential benefit of improving this trait. However, this value does not take into account the potential gain in productivity that could be achieved from an improvement in animal PCV.
Transferring scientific knowledge into farming practices
The two economic values for resistance and resilience raise important issues. Which point of view should be favoured (short or long term)? How could selection on these traits be implemented on-farm? Farmers are not fully aware of the importance of resistance to parasites (Gunia et al., Reference Gunia, Mandonnet, Arquet, de la Chevrotière, Naves, Mahieu and Alexandre2010) and rely strongly on anthelmintics. If their awareness of the anthelmintics issue is not improved, they will probably not want to invest in selection on resistance or resilience.
A preliminary step could be to attribute weighting to FEC according to the desired gain method, to aim at maintaining this trait without degrading it. At first, PCV could be retained in the breeding objective, even without being recorded. Simulation will be run to ensure that this trait does not deteriorate.
An easier way, perhaps more suitable for farmers, could be to select animals on Famacha© mark (measurement of the ocular conjunctivae colour). This trait is moderately heritable (Riley and Van Wyk, Reference Riley and Van Wyk2009), very easy to record and highly correlated with PCV. If the Famacha© method is widely adopted by farmers (presently, this method is still new and has only been adopted by a few), it would probably make more sense to farmers to select on a directly visible trait. This trait could be used as an indicator trait for PCV or could even replace PCV in the breeding objective. However, further research would be required to study the feasibility of selection including this new trait in Creole goats.
Selection of Creole goats for resistance and resilience is feasible and highly desirable. Therefore, FEC and PCV should be included in the breeding goal and their weights should be high enough to prevent deterioration of these traits. In the future, selection on Famacha© mark could be implemented to encourage farmers in appropriating and exploiting our findings.
Conclusion
Our study presents a balanced breeding goal for production and reproduction as well as parasite resistance and resilience traits. Defining such a breeding goal is a crucial step in setting up a breeding programme for Creole goats. Different alternatives are proposed for the integration of resistance and resilience. With further research, selection on both resistance and resilience can be implemented in Guadeloupe and will pave the way for a tropically adaptative selective breeding of goats.
Acknowledgements
We acknowledge ‘la Région Guadeloupe’ and the European Community (FEOGA) for the financial support provided, Donald White (ABIES doctoral school) for the English proofreading, as well as Régis Alexandre (Chambre d'Agriculture), Rangit Manicom (Iguavie), Marylene Madassamy (Cabricoop), Stephan Asselin de Beauville (Iguavie) and Jérôme Fleury (INRA) for their information and advice about field data, Harry Archimède and Daniel Sauvant (INRA) for the help on feeding equations, Maurice Mahieu (INRA) and Jean Marie-Felix Cherdieu d'Alexis (Veterinarian) for information about anthelmintics and integrated methods for parasite control, Fabien Stark (EPLEFPA de la Guadeloupe) and all INRA-URZ colleagues for the relevant advice and ideas given.