INTRODUCTION
Relationships between frequency of torrential rainstorms and long-term climate trends are crucial for determining impacts of global and regional climate change but remain poorly understood. Recent model analyses concerning the eastern Mediterranean show an ambiguous behavior of extreme rainstorms when mean precipitation decreases (Alpert et al., Reference Alpert, Ben-Gai and Baharad2002; Alpert et al., Reference Alpert, Krichak, Shafir, Haim and Osetinsky2008; Black, Reference Black2009; Orlowsky and Seneviratne, Reference Orlowsky and Seneviratne2012; Polade et al., Reference Polade, Pierce, Cayan, Gershunov and Dettinger2014). Paleoclimatic investigations can assist in testing the relation between extreme rainstorm frequency and the long-term climate trend. Reliable evidence, however, is yet missing because of the scarcity of well-dated continuous records, which archive both the long-term mean climate and torrential rainstorms.
The main climate trends in the eastern Mediterranean are reasonably well-established for the late Holocene (e.g., Enzel et al., Reference Enzel, Bookman, Sharon, Gvirtzman, Dayan, Ziv and Stein2003; Bookman et al., Reference Bookman, Enzel, Agnon and Stein2004). Lacustrine sediments recovered near the western Dead Sea shore (Fig. 1) recorded rainstorms as discrete coarse-grained detrital and graded layers intercalated in otherwise finely laminated sediments (Neugebauer et al., Reference Neugebauer, Brauer and Schwab2015). Neugebauer et al. (Reference Neugebauer, Brauer and Schwab2015) hypothesized that an increased frequency of rainstorms during a late Holocene regional drought in the eastern Mediterranean (3.0–2.4 cal ka BP) was related to a shift in prevailing synoptic atmospheric circulation patterns. At that time, however, a further specification, how the regional atmospheric patterns have changed, remained elusive. Here, we reexamine the interval studied by Neugebauer et al. (Reference Neugebauer, Brauer and Schwab2015) in order to provide more conclusive insights and evidence for this shift in the synoptic atmospheric circulation patterns. We additionally use modern hydroclimatological observations (Ben David-Novak et al., Reference Ben David-Novak, Morin and Enzel2004; Dayan and Morin, Reference Dayan and Morin2006; Kushnir et al., Reference Kushnir, Dayan, Ziv, Morin and Enzel2017) to illustrate the climatologic-hydrologic-sedimentologic mechanisms of debris flow deposition in more detail. The unique setting of the core site enables us to associate the occurrence of graded detrital layers with a specific precipitative synoptic system and, thereby, to better explain frequency changes of precipitation patterns during the study interval. We test the preference of such rainstorms to drought conditions on modern meteorological data to validate our findings.
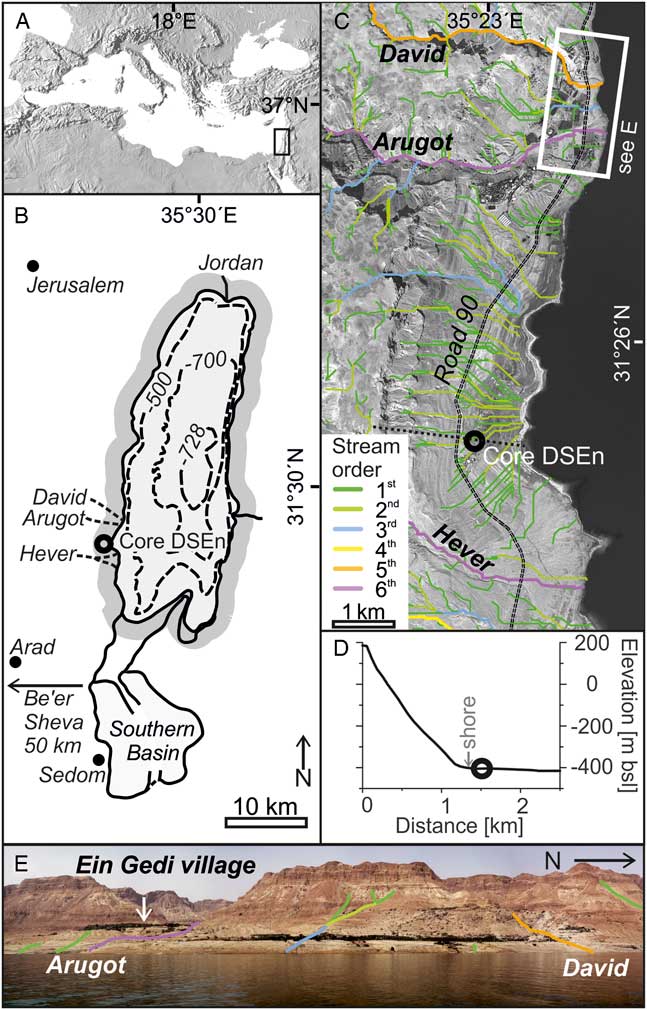
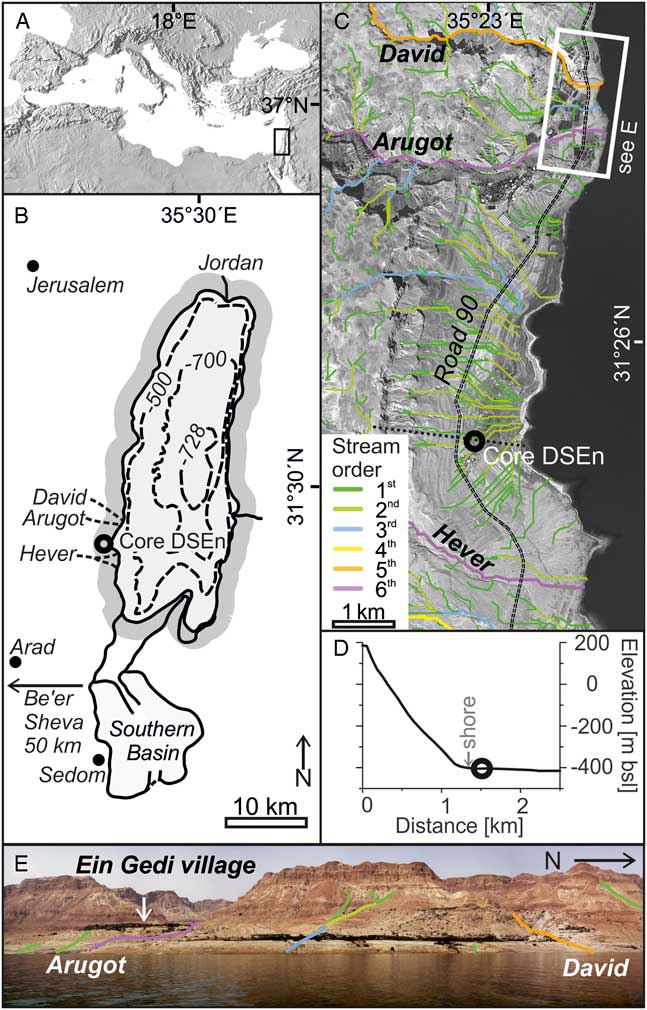
Study site. (A) Location of the Dead Sea (rectangle) in the eastern Mediterranean (modified from Neugebauer et al., Reference Neugebauer, Brauer and Schwab2015). (B) Dead Sea with the Dead Sea Ein Gedi (DSEn) coring site (circle) and rain gauges (black dot, arrow; adapted from Neugebauer et al., Reference Neugebauer, Brauer and Schwab2015). (C) Satellite image of coring location (circle) with stream order (first to sixth); Nahal David, Nahal Arugot, and Nahal Hever; topographic profile (dotted line, see D); the Road 90 (dashed line) roughly traces the lake level during the study interval. First- and second-order streams affect the coring location (green and light green). (D) Topographic profile intersecting the escarpment (see C, dotted line), the coring location (circle), and the location of the lake shore during the study interval (gray arrow). (E) The western Dead Sea escarpment with Nahal David, Nahal Arugot, and Ein Gedi village. Note that the greenery near the shore and in Ein Gedi village is twentieth-century date plants and not natural vegetation. (For interpretation of the references to color in this figure legend, the reader is referred to the web version of this article.)
Setting core Dead Sea Ein Gedi (DSEn)
Sediment core Dead Sea Ein Gedi (DSEn) was recovered at the base of the high (~600 m) and steep western Dead Sea escarpment at a very specific position. The core is located directly in front of first- and second-order ephemeral streams (Fig. 1C and D) but is not affected by the larger fifth- and sixth-order ephemeral streams (Arugot, David, and Hever) draining into the Dead Sea in some distance. Present-day hydroclimatology shows that these first- and second-order streams are activated by torrential rainstorms, which potentially induce debris flows and are commonly associated with localized convective precipitation cells generated by the Active Red Sea Trough (Ben David-Novak et al., Reference Ben David-Novak, Morin and Enzel2004). Therefore, our core provides a unique record of debris flows through time, and in turn, for changes in synoptic atmospheric circulation patterns from sedimentological data.
REGIONAL AND CLIMATIC SETTING
The Dead Sea (Fig. 1; 431.5 m below mean sea level in June 2017; Israel Hydrological Service) is a hypersaline terminal lake located between Israel and Jordan, and occupies the pull-apart Dead Sea basin along the Dead Sea transform. Within the past decades the lake level decline accelerated to about 1 m yr−1 due to anthropogenic water consumption in its upper reaches (Lensky and Dente, Reference Lensky and Dente2015). The lake is bounded to its west and east by steep escarpments. The western escarpment is drained by first- and second-order ephemeral streams draining <2 km2 steep, small-scale, hyperarid (50–100 mm yr−1) watersheds. These streams discharge water and sediments directly into the lower gradient near shore areas (Fig. 1C). The large fifth- and sixth-order ephemeral streams (“wadi” in Arabic, “nahal” in Hebrew) have drainage areas of ~17 to 250 km2. These streams head either in the wetter (550–650 mm yr−1) Judean Mountains or the arid (100–150 mmyr−1) Judean Desert and carve steep elongated canyons into the escarpment bedrock. Discharge in these first- to sixth-order ephemeral streams is in response to sporadic precipitation events mostly during the rainy winter season (October to March; Greenbaum et al., Reference Greenbaum, Ben-Zvi, Haviv and Enzel2006), while summers are dry. The climate at the Dead Sea and its western escarpment is hyperarid, with an approximate evaporation of >1,500 mmyr−1 (Dayan and Morin, Reference Dayan and Morin2006) and rainfall <100 mm yr−1 (Kushnir et al., Reference Kushnir, Dayan, Ziv, Morin and Enzel2017). At present, three different synoptic patterns cause rainstorms in the Dead Sea region (Dayan and Morin, Reference Dayan and Morin2006): (1) the rain-bearing, regional-scale eastern Mediterranean winter cyclones (Cyprus Lows) primarily affect the northern and western parts of the Dead Sea catchment and control mean annual regional precipitation in the eastern Mediterranean and Dead Sea lake levels (e.g., Enzel et al., Reference Enzel, Bookman, Sharon, Gvirtzman, Dayan, Ziv and Stein2003; Ziv et al., Reference Ziv, Dayan, Kushnir, Roth and Enzel2006; Saaroni et al., Reference Saaroni, Halfon, Ziv, Alpert and Kutiel2010); (2) the Active Red Sea Trough, extending from northeastern Africa and the Arabian Peninsula through the Red Sea towards the eastern Mediterranean (Ashbel, Reference Ashbel1938; De Vries et al., Reference De Vries, Tyrlis, Edry, Krichak, Steil and Lelieveld2013), produces heavy and localized convective precipitation in the Dead Sea catchment during fall and winter, inducing debris flows under certain conditions (Kahana et al., Reference Kahana, Ziv, Enzel and Dayan2002; Ben David-Novak et al., Reference Ben David-Novak, Morin and Enzel2004; Dayan and Morin, Reference Dayan and Morin2006); (3) the Tropical Plumes (also termed subtropical jet-related disturbances) resulting in regional-scale rainstorms (Ziv, Reference Ziv2001; Rubin et al., Reference Rubin, Ziv and Paldor2007).
MATERIAL AND METHODS
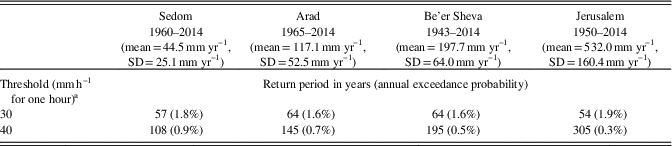
The 21-m-long sediment core DSEn was obtained in 1997 on the western Dead Sea shore (Fig. 1C; Migowski, Reference Migowski2001). We reconstructed the original core location based on consultation of participants of the coring campaign and new GPS measurements to correct previously published core locations (Migowski, Reference Migowski2001; Neugebauer et al., Reference Neugebauer, Brauer and Schwab2015). The corrected location of the DSEn core is 31°25.18N, 35°22.83E. In this study, we link the sedimentology at this core location directly with modern hydroclimatological observations in the adjacent first- and second-order streams, which drain the small-scale watersheds on the escarpment. Stream order (Fig. 1C) is calculated after Strahler (Reference Strahler1957) using a 25-m resolution Digital Terrain Model (DTM) of Israel (Hall, Reference Hall2008). Minimum drainage basin area for first order streams is 31,250 m2 (ca. 0.03 km2). Modern precipitation patterns were calculated using data from four meteorological stations in vicinity of the Dead Sea (Fig. 1B). These stations represent different climatic regimes: hyperarid (Sedom, with mean annual rainfall of 44 mm), arid (Arad; 117 mm), semi-arid (Be’er Sheva; 197 mm), and Mediterranean (Jerusalem; 532 mm; Table 1). The frequency of torrential rainstorms was obtained by fitting a generalized extreme value distribution (using the L-moments method) to the annual series of maximal precipitation intensities. This frequency represents the annual probability of rainstorms exceeding a certain precipitation threshold and can be converted to return periods, which are the average interval between such rainstorms.
Return periods for precipitation thresholds for four meteorological stations.
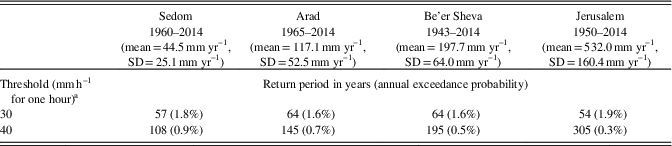
a After Ben David-Novak et al., Reference Ben David-Novak, Morin and Enzel2004.
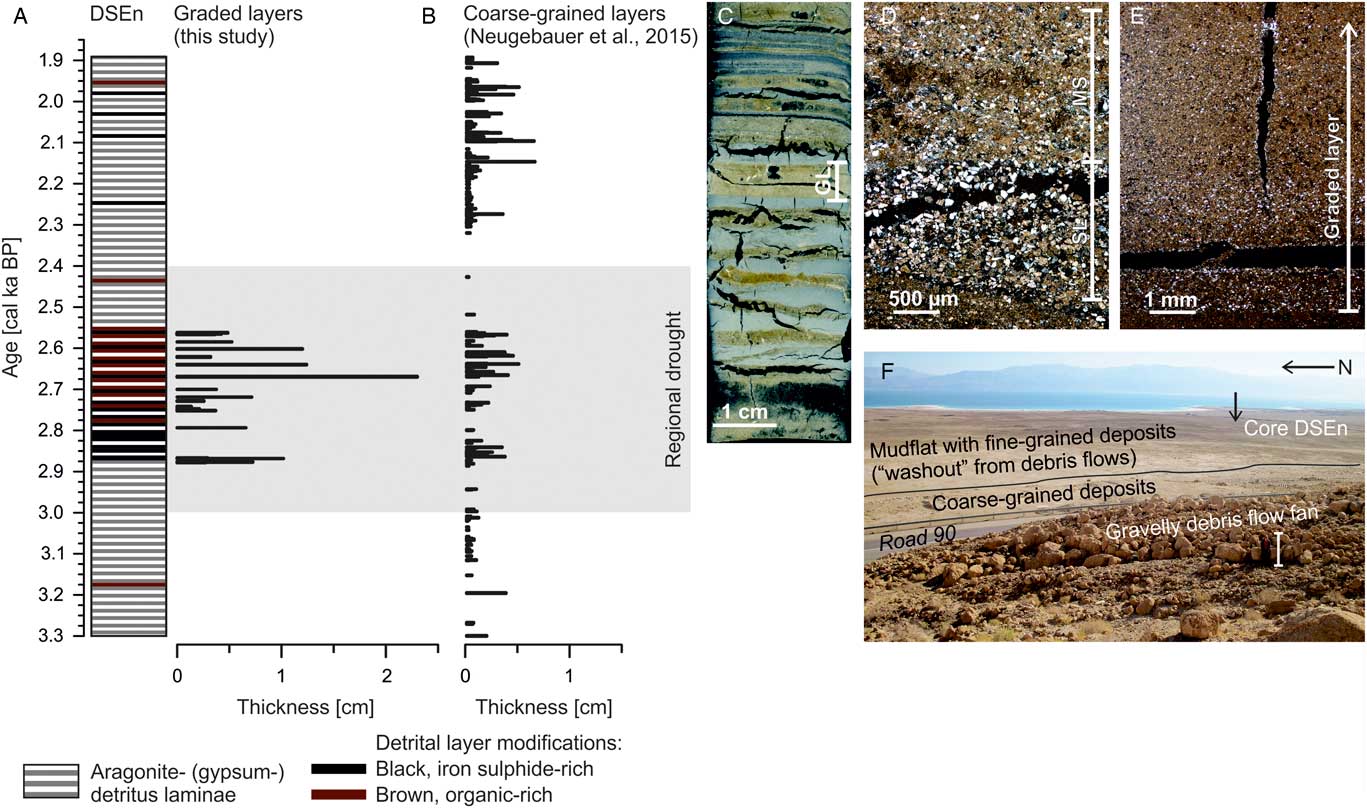
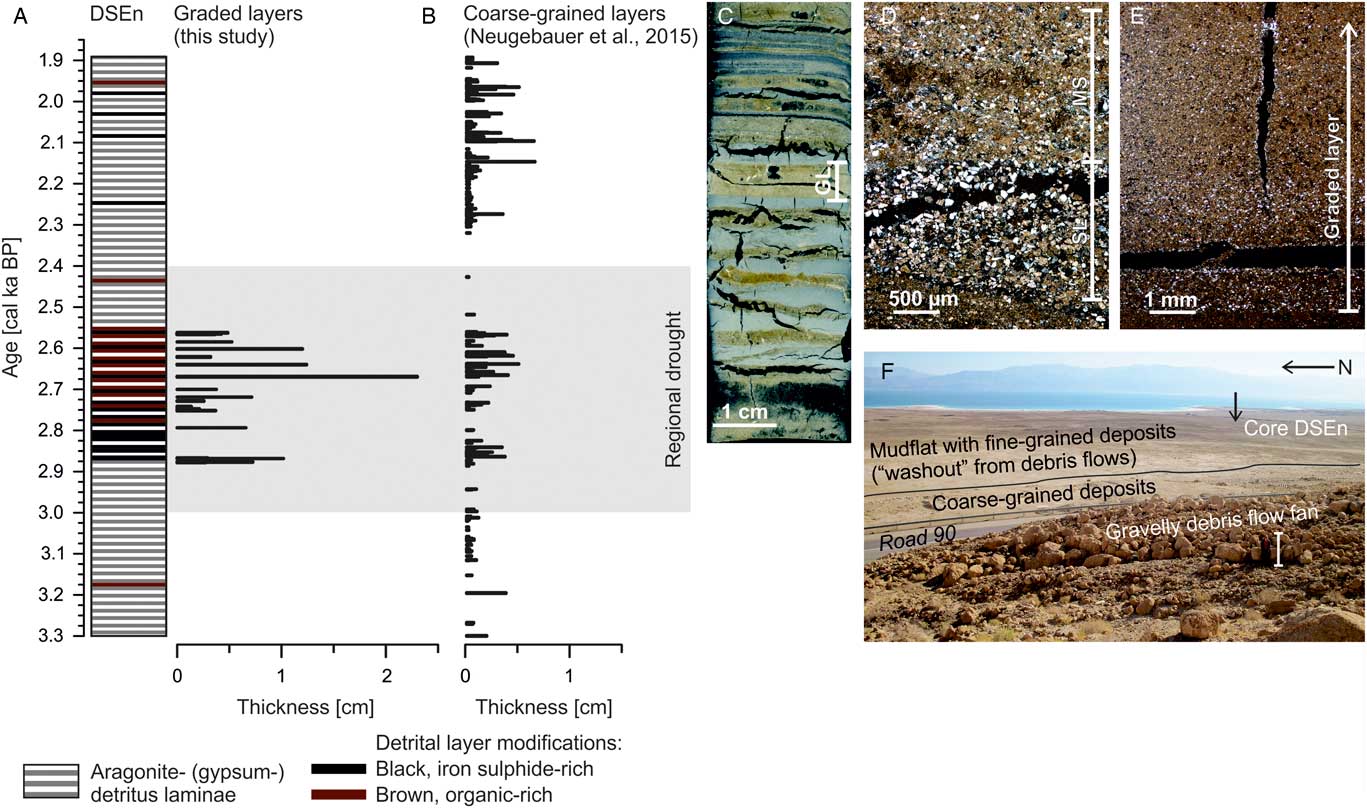
This study focuses on the time interval between 3.3 and 1.9 cal ka BP (4.35 to 2.10 m composite core depth), which mostly consists of alternating detrital and aragonite laminae comprising the “uppermost aragonite sequence” of core DSEn (Migowski, Reference Migowski2001; Migowski et al., Reference Migowski, Agnon, Bookman, Negendank and Stein2004; Neugebauer et al., Reference Neugebauer, Brauer and Schwab2015). Detrital laminae represent seasonal winter floods, whereas the aragonite and gypsum laminae precipitate during the dry summer months (Stein et al., Reference Stein, Starinsky, Katz, Goldstein, Machlus and Schramm1997). In contrast to fine laminations in the Holocene Ze’elim Formation, which apparently do not represent annual laminations (López-Merino et al., Reference López-Merino, Leroy, Eshel, Epshtein, Belmaker and Bookman2016), the couplets in the DSEn core from the Ein Gedi site are of annual origin as further confirmed by the agreement of laminae counting and radiocarbon ages (Neugebauer et al., Reference Neugebauer, Brauer and Schwab2015). Occasionally intercalated within the seasonal succession are discrete graded detrital layers with a maximum thickness of 2.3 cm (Fig. 2C; Neugebauer et al., Reference Neugebauer, Brauer and Schwab2015).
(A) Lithostratigraphy of sediment core Dead Sea Ein Gedi (DSEn; modified from Neugebauer et al., Reference Neugebauer, Brauer and Schwab2015) with time-series of discrete graded layers occurring during a drought (gray). (B) Coarse-grained layers according to dataset of (Neugebauer et al., Reference Neugebauer, Brauer and Schwab2015). (C) Thin section scan (length=7 cm) with alternating aragonite (gray) and detritus (brownish) laminae and one graded layer (GL; note the cracks in the thin sections visible as black gaps). Microscope images of debris flow deposits (please notice the different scales and cracks in the thin sections visible as black gaps): (D) Graded layers type 2 with a basal sublayer (SL) followed by a matrix-supported sequence (MS); and (E) graded layer type 1. (F) Debris flow deposits with coring location (arrow) on the mudflat (black line), Road 90 roughly traces the lake levels during the study interval. Please note the person as scale (white bar). (For interpretation of the references to color in this figure legend, the reader is referred to the web version of this article.)
Thirty-seven petrographic thin sections were prepared from sediment core DSEn following the standard procedure (Brauer and Casanova, Reference Brauer and Casanova2001), but in this case, under dry conditions due to the high salt content of the sediments (Neugebauer et al., Reference Neugebauer, Brauer and Schwab2015). Microfacies and maximal grain size of graded layers were analyzed using a petrographic microscope under polarized light. The chronology is based on 1351±53 annual laminae anchored by four calibrated (Bronk Ramsey, Reference Bronk Ramsey2009; Reimer et al., Reference Reimer, Bard, Bayliss, Beck, Blackwell, Ramsey and Buck2013) radiocarbon ages of terrestrial plant remains (Neugebauer et al., Reference Neugebauer, Brauer and Schwab2015).
RESULTS AND DISCUSSION
A record of late Holocene debris flows
The location of the DSEn core is crucial for our interpretation of the sedimentary processes and understanding the meteorological conditions controlling the deposition of the discrete graded layers (Fig. 1–2). Sediment deposition at the location of core DSEn is not directly affected by sediment flux from the fifth- and sixth-order ephemeral streams Arugot, David, and Hever due to the remote location of the core site with respect to these streams (Fig. 1C). These fifth- and sixth-order ephemeral streams carry flash floods induced by episodic, regional-scale precipitation events during the rainy winter season, except for Nahal David, which is also affected be localized rainfall. Instead, sedimentation at the core site is predominantly controlled by debris flows induced by local-scale precipitation events over the adjacent first- and second-order ephemeral streams on the escarpment. Repeated past debris flow activity in the direct vicinity of the core DSEn is confirmed by exposed debris flow fans located just landwards of the coring site (Fig. 2F). Debris flows in this area are fed by sediments from talus slopes (Ben David-Novak et al., Reference Ben David-Novak, Morin and Enzel2004) and former Lake Lisan margin deposits mantling the escarpment (Bartov et al., Reference Bartov, Bookman and Enzel2006). Present-day observations confirm that the coarse-grained fraction of the debris flows settles immediately as debris flow levees, fronts, cones, and fans when reaching the low gradient slopes at the base of the escarpment. The finer (fine sand to clay) fraction of these debris flows is instantly flushed into the lake and partly accumulated on narrow lake margin mudflats (Fig. 2F; Bartov et al., Reference Bartov, Bookman and Enzel2006). Consequently, the graded layers intercalated within the sediment record represent distal subaquatic deposits of debris flows originating from the abutting first- and second-order streams.
Microfacies of the subaquatic debris flow deposits
The data presented here are based on Neugebauer et al. (Reference Neugebauer, Brauer and Schwab2015), but have been complemented by three additional graded layers, which were previously not described. More importantly, and in contrast to Neugebauer et al. (Reference Neugebauer, Brauer and Schwab2015), we further distinguish between graded detrital layers and coarse-grained detrital layers without grading. Our catchment investigations and modern hydroclimatic data revealed that only the graded layers (Fig. 2D–E) represent distal deposits of debris flows triggered by torrential rainfall events. In contrast, the more frequent coarse-grained layers without grading likely reflect small-scale erosion flows or successive events related to rainstorms in the winter season. Some of these rainstorms may have generated minor surface runoff carrying small amounts of suspended material, which were deposited as coarse-grained layers. In the case of these layers, a triggering synoptic pattern cannot be linked as all three prevailing patterns (i.e., Mediterranean cyclones, Active Red Sea Troughs, and Tropical Plumes) potentially induce low-intensity rainstorms. In result, our data show that graded layers, and thus major debris flow events, exclusively occurred in the time interval from 2.9 to 2.5 calkaBP (Fig. 2A), whereas the coarse-grained layers without grading commonly occur over the entire studied interval from 3.3 to 1.9 cal ka BP (Fig. 2B). The exclusive occurrence of debris flow deposits during a regional drought interval (Neugebauer et al., Reference Neugebauer, Brauer and Schwab2015) suggests a causal relation, which is discussed in more detail below.
We further discriminate two micro-morphological types of the graded layers (Fig. 2D–E). Type 1 layers (21 out of 23 layers) consist of a fining-upward sequence of calcite and quartz grains supported by a brownish clay-silt matrix (Fig. 2E). Because of the lack of a sharp basal contact, which would be typical for hypopycnal or mesopycnal flows (Sturm and Matter, Reference Sturm and Matter1978; Mulder and Alexander, Reference Mulder and Alexander2001), we interpret this type of layer as over- or interflow deposit. Eighteen out of 21 type 1 layers directly overlie a regular fine-grained detrital winter season laminae, thus indicating deposition during or immediately after the rainy winter season. Only three of these layers overlie aragonite laminae, suggesting deposition before or early in the rainy season. Type 2 layers are rare (2 out of 23 layers) and are characterized by a coarse basal sublayer (SL; Fig. 2D) of grain-supported and well-sorted calcite and quartz grains with a sharp basal contact to the underlying laminae. These coarse basal sublayers are followed by brownish, matrix-supported, clay-silt sequences with a fining-upward trend (MS; Fig. 2D). The sharp basal contact to the underlying laminae and the coarse basal sublayer (Fig. 2D) are characteristic for hyperpycnal underflow depositions (Mulder and Alexander, Reference Mulder and Alexander2001). Since hyperpycnal underflows are potentially erosive, the seasonality of type 2 layers cannot be defined. The different sedimentation process compared to type 1 might be related to the magnitude of the debris flow, the amount of available sediments, or both. We assume that a considerably larger debris flow or higher sediment availability would increase the density of the flow that would result in an underflow.
Modern debris flow processes as indicators of rainstorm intensity and synoptic pattern
The unique, modern observations of rainstorms and related sedimentation processes on the western Dead Sea escarpment provide rare tools for quantifying rainstorm intensity and duration and assessing related causative synoptic pattern (Ben David-Novak et al., Reference Ben David-Novak, Morin and Enzel2004). These observations indicate that the initiation of debris flows is linked to a well-defined precipitation threshold over the escarpment. The observed threshold is 30 mm h−1 for the duration of one hour (~20% of affected first- and second-order streams experienced debris flows) and 40 mm h−1 for one hour for major debris flow events (debris flows in almost all first- and second-order streams; Ben David-Novak et al., Reference Ben David-Novak, Morin and Enzel2004). Mobilization of unconsolidated sediments as debris flows requires the occurrence of a convective precipitation cell precipitating directly over the first- and second-order ephemeral streams on the escarpment (Fig. 1C). Modern observations indicate that rainstorms exceeding precipitation thresholds for debris flow formation are commonly caused by the Active Red Sea Trough synoptic-scale circulation pattern (Ben David-Novak et al., Reference Ben David-Novak, Morin and Enzel2004). Debris flow deposits in core DSEn thus indicate the combination of the following meteorological conditions: (1) occurrence of Active Red Sea Troughs causing these torrential rainstorms; (2) rainstorms exceeding the abovementioned precipitation threshold; and (3) position of the convective precipitation cell is directly over the first- and second-order streams discharging to the DSEn site. In contrast, rainstorms over the Judean Mountains or the Judean Desert west of the Dead Sea beyond the escarpment rim (Fig. 1C) are drained by larger order ephemeral streams and are likely to produce flash floods in these streams but no debris flows that could reach the coring site. However, debris flow formation might be accompanied by flash floods restricted to the path of the fifth- and sixth-order streams (Ben David-Novak et al., Reference Ben David-Novak, Morin and Enzel2004). Sediment loads of flash floods reaching the Dead Sea in these streams are deposited in front of their deltas, while the fine fraction is carried farther into the lake as sediment plumes (Nehorai et al., Reference Nehorai, Lensky, Hochman, Gertman, Brenner, Muskin and Lensky2013), which do not affect the DSEn site.
Past changes in atmospheric circulation pattern
The debris flow deposits are distinctly clustered between 2.9 and 2.5 cal ka BP (Fig. 2A) coinciding with a well-defined, regional, multi-century drought (3.0–2.4 cal ka BP; Neugebauer et al., Reference Neugebauer, Brauer and Schwab2015). This phenomenon is unlikely to be explained by changes in vegetation cover, human impact, or changes of lake level. There is no evidence that vegetation covered the escarpment during the Holocene or that there were significant vegetation changes in the region over the last few thousands of years (Neumann et al., Reference Neumann, Kagan, Schwab and Stein2007; Litt et al., Reference Litt, Ohlwein, Neumann, Hense and Stein2012). The escarpment is dominated by exposed Cretaceous carbonates and dolomites and talus with hyperarid surface soils characterizing environment without vegetation (Fig. 1E; Amit et al., Reference Amit, Enzel and Sharon2006; Amit et al., Reference Amit, Enzel, Grodek, Crouvi, Porat and Ayalon2010). Likewise, human impact is negligible because human activity concentrated near the Arugot and David stream mouths and the Ein Gedi springs, whereas no historic and/or prehistoric settlements are documented in the contributing streams or in the vicinity of the core site (Migowski et al., Reference Migowski, Stein, Prasad, Negendank and Agnon2006). The lake-level decline during this regional drought interval should have slightly elongated the first- and second-order streams due to shore regression. The falling lake levels, however, would not have altered sediment erodibility on the steep rocky escarpment, where debris flows originate primarily from undermining the talus. Consequently, falling lake levels potentially have resulted in thicker distal debris flow deposits but could not have affected the frequency of debris flows. This is also reflected by the sediments in core DSEn, which show no sedimentological indications of any major lake level changes during this time interval (Neugebauer et al., Reference Neugebauer, Brauer and Schwab2015), meaning that the coring site was always (before the 1990s) covered by water. Based on these considerations, the increased debris flow frequency during the studied late Holocene drought must have been caused by an increased frequency of rainstorms affecting the escarpment.
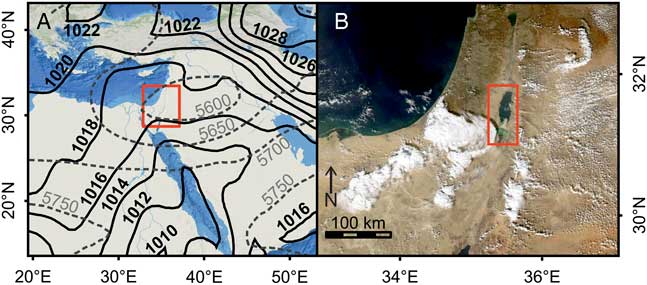
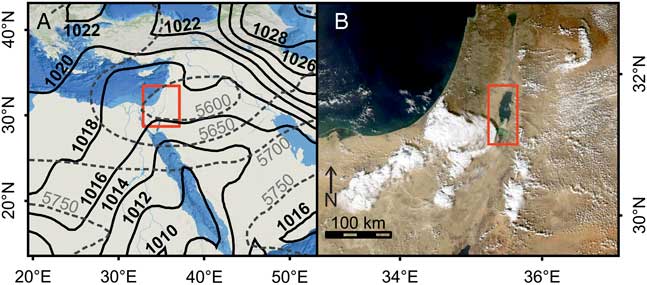
The most likely explanation for an increased rainstorm activity at that time is an increased frequency, and perhaps even intensification, of the Active Red Sea Trough synoptic pattern (Fig. 3). We further suggest that the decreased frequency of eastern Mediterranean cyclone passages over the region, which caused the regional drought and lake level lowering, encouraged the development of more frequent Active Red Sea Troughs. In general, Red Sea Troughs (not all active and precipitating) tend to develop and become more common in the late fall and winter in absence of other significant prevailing synoptic systems (Sharon and Kutiel, Reference Sharon and Kutiel1986). Consequently, we interpret the observed changes in the precipitation patterns, as reflected by the sedimentary record of core DSEn, as indicator of a shift of regional synoptic-scale atmospheric circulation.
(color online) Synoptic conditions of an Active Red Sea Trough event. (A) Mean sea level pressure (solid lines) and 500 hPa geopotential height (dashed lines) for February 11, 2013, 12UTC, from reanalysis data (Dee et al., Reference Dee, Uppala, Simmons, Berrisford, Poli, Kobayashi and Andrae2011) and study region (rectangle). (B) Satellite image from the same time showing localized high-intensity rain cells associated with the Active Red Sea Trough (modified from NASA Worldview) and study region (rectangle).
A similar scenario for northern Israel has been suggested for the mid-twenty-first century from CMIP5 atmospheric model simulations (Peleg et al., Reference Peleg, Bartov and Morin2015). These simulations point to a noticeable reduction of the total rainfall due to a decrease in the frequency of eastern Mediterranean cyclones and a relative increase in Active Red Sea Troughs.
Present-day data from the Sedom, Arad, Be’er Sheva, and Jerusalem meteorological stations also show more frequent torrential rainstorms in drier regions (Table 1). In the hyperarid Sedom station, the return period for rainstorms exceeding the 40 mm h−1 threshold is 108 years (Table 1). In comparison, in Arad, Be’er Sheva, and Jerusalem, representing the transition from arid to wetter Mediterranean climate, the return periods are 145, 195, and 305 years, respectively. Given the much shorter return period of only 14 years for similar rainstorms during the studied late Holocene drought deduced from the Dead Sea sediment data, we speculate that this interval was even drier than today, but with a higher frequency of extreme localized Active Red Se Trough-associated rainstorms.
Applying debris flow events as proxy for the frequency of Active Red Sea Troughs and torrential rainstorms during a regional drought provides insights into past and present hydroclimate variability in the eastern Mediterranean. These findings are particularly valuable given the ongoing decrease in mean annual rainfall in the eastern Mediterranean (e.g., Shohami et al., Reference Shohami, Dayan and Morin2011) and might offer indications for a better anticipation of future scenarios.
ACKNOWLEDGMENTS
This study is a contribution to the PALEX project “Paleohydrology and Extreme Floods from the Dead Sea ICDP core”, funded by the DFG (grant no. BR2208/13-1/-2). Y. Enzel, Y. Ben Dor, and M. Armon were also funded by Israel Science Foundation (ISF) grant 1436/14 to Y. Enzel. This is a contribution to the Helmholtz Association climate initiative REKLIM Topic 8. G. Arnold, D. Berger, and M. Köhler kindly provided laboratory assistance. Rainfall data were obtained from the Israeli Meteorological Service.