INTRODUCTION
Climate is one of the factors most affecting wine production (Nigond Reference Nigond1971). Adverse weather conditions can result in a reduced grape harvest, due to direct damage to flowers and fruits, and due to indirect effects on the various events involved in reproduction (e.g. pollen release and dispersal) and fertilization (mainly in cross-fertilized varieties). Grapevines are mainly wind pollinated, but the particular floral morphology of Vitus allows self-pollination (Kamel Reference Kamel1959), the frequency variation depending partly on the grape variety concerned. Dry weather and a slight breeze are considered ideal conditions for fertilization (Gil Reference Gil1999); rain may affect the fertilization efficiency through washing pollen grains off the stigma (Ortega et al. Reference Ortega, Dicenta and Egea2007) and fertilization is also affected adversely by temperatures below the optimum 20°C.
Airborne Vitis pollen counts provide an indirect measure of pollination, and can thus be used as a variable when predicting final harvest. This technique has been used widely since the 1990s to forecast output for other major commercial crops in the Mediterranean area, such as olives and almonds (Besselat & Cour Reference Besselat and Cour1990; Candau et al. Reference Candau, González Minero and González Romano1991, Reference Candau, González Minero and Tomás1998; Fornaciari & Romano Reference Fornaciari and Romano1995; Galán et al. Reference Galán, Vázquez, García-Mozo and Domínguez2004, Reference Galán, Cariñanos, Alcázar and Domínguez2007). Optimal fertilization – and thus large harvests – depends primarily on the correct development of floral organs and on the production of highly viable pollen with good germinative capacity (largely regulated by genetic factors). Although few studies have addressed this issue (Kelen & Demirtas Reference Kelen and Demirtas2003), there is little doubt that pollen production needs to be included as a variable in any model for predicting grape harvest.
Weather-related variables not only influence pollen production and airborne pollen counts but also determine the virulence of the various diseases affecting final grape harvests. The particular climate of north-western Spain (high-atmospheric humidity and high temperatures during the grapevine vegetative cycle) favours the development of fungal pathogens in Galician wineries. In the short term, these pathogens, including Botrytis cinerea, Uncinula necator and Plasmopara viticola, give rise to a drastic decline in the quantity and quality of harvested grapes; in the long term, they may lead to death of the vine (Mansilla et al. Reference Mansilla, Pintos and Abelleira1991). Certain grapevine phenological phases are especially sensitive to phytopathogenic fungal attack. A number of studies in various geographical areas have focused on the timing of ascospore release and grapevine phenology: of the six principal grapevine stages, according to the BBCH scale (see details below), the most vulnerable to attack by fungal pathogens is the flowering stage (Stage 6) (Cortesi et al. Reference Cortesi, Bisiach, Ricciolini and Gadoury1997; Magarey et al. Reference Magarey, Gadoury, Emmett, Biggins, Clarke, Wachtel, Wicks and Seem1997). The sugary exudates present in pollen and flowers during this phase favour the colonization of vine tissue by B. cinerea (Esterio et al. Reference Esterio, Auger, Droguett and Arroyo1996). Vines are also vulnerable during the period from ripening of berries to harvest (Latorre Reference Latorre1986; Bulit & Dubos Reference Bulit, Dubos, Pearson and Goheen1988). The ideal conditions for U. necator infection coincide with the period from beginning of flowering to the time at which berries attain a diameter of 7 mm (Campbell et al. Reference Campbell, Bendek and Latorre2007). Finally, flowering and the beginning of development of fruits are considered the most sensitive phases for P. viticola infection (Díaz Reference Díaz1999).
Advance knowledge of potential grape production is of great value for harvest and post-harvest planning, in that it enables the winery to estimate requirements in terms of crop insurance and grape-picking workforce, and to optimize post-harvest processes. At the same time, it facilitates the detection of possible fraud due to the introduction of foreign grapes into Designation of Origin areas such as north-western Spain. Average annual grape production in Galicia is over 40 million kg; 0·85 of grapes are of white varieties (Albariño, Palomino, Treixadura and Godello) (Blanco-Ward et al. Reference Blanco-Ward, García Queijeiro and Jones2007). Of the five Designation of Origin areas, the oldest is Ribeiro, which has been regulated since 1976 and includes the native Godello variety. The present study sought to develop an accurate model for predicting Godello grape output, using meteorological, phenological and phytopathological variables.
MATERIALS AND METHODS
Area and period of study
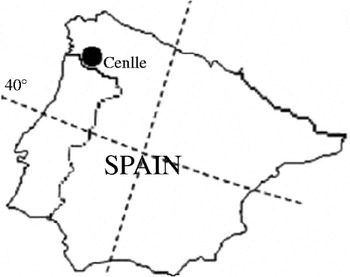
The Ribeiro region of north-western Spain covers a total area of 371 km2 (Fig. 1). The study was carried out in a vineyard at Cenlle (75–400 m asl) (latitude: 42°18′N and longitude: 8°6′W) characterized by fairly steep valleys and hillsides. This region in southern Galicia has an Oceanic–Mediterranean transition ecoclimate due to the natural barriers that protect the territory from sub-Atlantic storms. According to the Multicriteria Climatic Classification system , most winemaking areas in this region watered by the river Miño would be defined as temperate and warm, sub-humid, with very cold nights (Blanco-Ward et al. Reference Blanco-Ward, García Queijeiro and Jones2007). The main grape varieties grown are Treixadura, Godello and Loureira.
Location of Cenlle in Spain.

Sampling was carried out during the active Vitis season, from 1 April to the harvest date (vintage date) during the study years, on 9 years old cultivar Godello grapevine (on rootstock 110 Richard) with a Ferti-irrigation system. The cultivar pruning and training system was Cordon de royat, characterized by one horizontal branch bearing five spurs (with two eyes) along the carrier wire, which was at least 0·60 m from the ground. Ground cover was maintained without ploughing.
Aerobiological study
Aerobiological sampling was performed using a LANZONI VPPS-2000 volumetric trap located in the central part of the vineyard. The sampler was placed 2 m above ground level, so that spore trapping would not be impeded by vine growth. The trapping system worked continuously for a week with an intake of 10 litres of air/min, which allowed easy computation of the daily fungal spore concentrations in 1 m3 of air of the vineyard. Melinex tape coated with a 20 g/litre silicone solution was used at the spore-trapping surface. The exposed tape was cut into seven pieces, which were mounted on separate glass slides. B. cinerea and U. necator conidia and sporangia of P. viticola were counted following the model proposed by the Spanish Aerobiological Network (R.E.A.), based on two longitudinal transects along the slides (Galán et al. Reference Galán, Cariñanos, Alcázar and Domínguez2007). Spores were identified and counted following the methods of Aira et al. (Reference Aira, Jato and Iglesias2005) and Galán et al. (Reference Galán, Cariñanos, Alcázar and Domínguez2007). During the grapevine flowering stage, the Vitis vinifera pollen in the air was also identified and counted. The results were expressed as spores or pollen for total values or spores/m3 or pollen/m3 of air when referring to daily mean values. The sampling was interrupted by power cuts on 12 and 13 May, 22–25 July and 4–7 September in 2004; on 6 September 2005; 31 August–6 September 2006; from 10 to 14 September 2007 and finally 30 April in 2008.
Phenological study
The phenological study was carried out on 20 selected vines of cvar Godello. During the 6 years of study (2004–9) the sampling area was visited weekly, except during the flowering stage, when the visits increased to twice a week. The phenological phases of the selected vines were observed using the scale recommended by Lorenz et al. (Reference Lorenz, Eichorn, Bleiholder, Klose, Meier and Weber1994), adopted by the BBCH as a standardized scale for phenological grapevine observations (Meier Reference Meier2001). The five principal stages were monitored: stage 1 (leaf development), stage 5 (inflorescence emergence), stage 6 (flowering), stage 7 (development of fruits) and stage 8 (ripening of berries). Each phenological stage was considered to begin when 0·50 of the studied vines had reached that stage.
Production study
To determine the numbers of pollen grains, flowers and bunches produced per plant, 10 vines were selected randomly from the 20 on which the phenological study was conducted. In order to calculate the number of pollen grains per anther, the model proposed by Cruden (Reference Cruden1977) and refined by Hidalgo et al. (Reference Hidalgo, Galán and Domínguez1999) was used. The quantity of pollen per anther was calculated for three bunches from each vine by selecting three flowers per bunch and three anthers of each flower, i.e. pollen production was calculated for 27 anthers on each vine. The pollen production per flower was estimated by considering a mean of five anthers per grapevine flower. To estimate the number of flowers on the vine, the number of tertiary branches of each bunch was counted and assuming that each tertiary ramification represented a group of 25 flowers.
Meteorological data
Meteorological data were obtained from a Hobo Micro Station data logger, located in the vineyard. The parameters monitored were temperature (maximum, average and minimum) and dew point. Information on rainfall was registered by means of a Davids weather station.
Statistical analysis
To determine the influence of the main meteorological, phenological and phytopathological parameters in the total grape production, a Spearman's correlation was calculated and significance attributed at P⩽0·05 and P⩽0·01. Finally, in order to construct a model to predict the final grape production, linear regression and multiple regression analyses were carried out. As model estimators, the meteorological, phenological and phytopathological variables with the highest significance and a positive Spearman correlation coefficient were selected. In all statistical analyses, the SPSS 16.0 software package was used (IBM, Somers, NY, USA). The accuracy of the models was evaluated with training data from 2004 to 2008 (included to develop the models) and finally with the data of the 2009 harvest as test data (i.e. was not included in the development of the models).
RESULTS
Aerobiological and phenological study
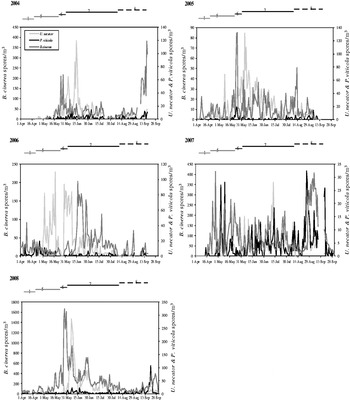
During the study period, the most abundant local airborne spores were B. cinerea, followed by U. necator and finally P. viticola. The highest annual B. cinerea count was 40 773 spores (2008), while U. necator had a maximum annual count of 4141 spores and P. viticola 921 spores. The presence of B. cinerea spores in the air was constant throughout the grapevine flowering cycle in all study years except for 2007, when spores were not recorded until 13 April. In contrast, U. necator and P. viticola spores were not constantly present, being recorded mainly during the months of April, June and August (Fig. 2).
Evolution of the B. cinerea, U. necator and P. viticola spore concentrations. The bars along the top of each diagram indicate the duration of BBCH development stages in each year: Stage 0 (sprouting), Stage 1 (leaf development), Stage 5 (inflorescence emergence), Stage 6 (flowering), Stage 7 (development of fruits) and Stage 8 (ripening of berries).

Airborne pathogen counts were analysed in terms of BBCH grapevine phenological stages, namely: Stage 1=leaf development, Stage 5=inflorescence emergence, Stage 6=flowering, Stage 7=development of fruits and Stage 8=ripening of berries (Meier Reference Meier2001). The analysis showed that peak B. cinerea values were recorded during Stage 5 in 2005, 2007 and 2008, Stage 7 in 2006 and Stage 8 in 2004 (Fig. 2). Peak U. necator counts were observed during Stage 6 in 2005 and 2008, Stage 7 in 2004 and 2007 and Stage 5 in 2006. Particularly elevated U. necator counts were recorded during flowering in 2008, with daily peaks of 286 spores/m3. Finally, peak P. viticola counts were noted during Stage 8 in 2007 and 2008, although in other years maximum values were recorded earlier: during Stages 1, 5 and 7.
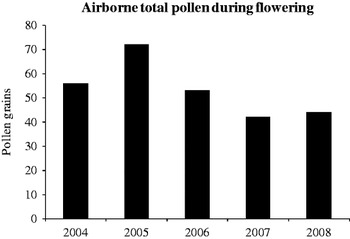
The highest total airborne Vitis pollen count was recorded in 2005 (72 grains), followed by 2004, 2006, 2008 and finally 2007 with only 42 pollen grains (Fig. 3). Average daily counts were low, with a maximum value of 11 grains/m3 on 6 June 2006.
Number of total Vitis pollen grains in the atmosphere of the vineyard during Stage 6 (flowering).

Pollen and bunch production
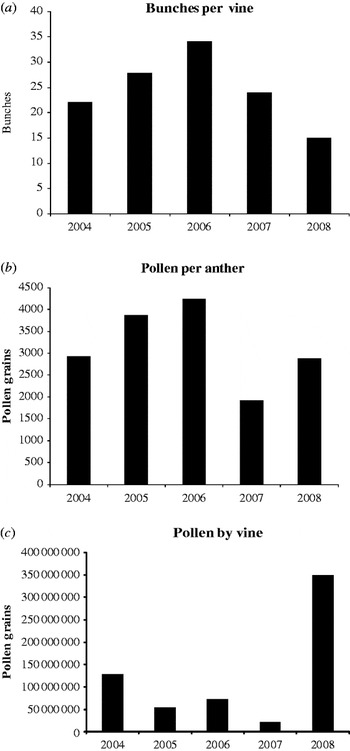
The largest number of bunches per vine was observed in 2006 (average 34 per vine). The highest average value for pollen production per anther (4236 grains) was also recorded in that year. Pollen production per vine was highest in 2006 (72·96 million pollen grains, s.d. 31·76), and lowest in 2008 (20·48 million pollen grains, s.d. 10·24) (Fig. 4).
Phenological variables during the period of study: bunches per vine, pollen per anther and pollen per vine.

Weather conditions during the study period
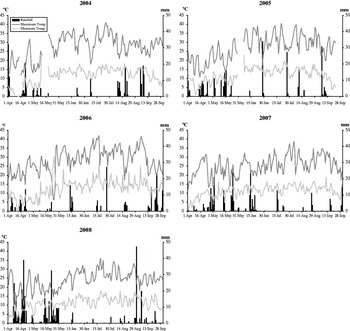
The highest average maximum temperatures were recorded in 2006 (28·2°C), followed by 2004, 2005, 2007 and finally 2008 (24°C). The highest values for total rainfall were observed in 2008 (442 mm), followed by 2005, 2007, 2004 and finally 2006 (232 mm) (Fig. 5). Analysis of weather conditions as a function of major BBCH phenological stages revealed that the highest maximum temperatures were registered during Stage 7 in 2004, 2005, 2006 and 2008, while in 2007 the peak was delayed to Stage 8. The phenological stages with the heaviest rainfall were Stage 1 in 2008 (175 mm), followed by Stage 5 in 2007, Stage 8 in 2004 and Stage 7 in 2005 and 2006 (92 and 74 mm, respectively).
Evolution of the main meteorological parameters during the period of study. Meteorological model; phytopathological model, phenological model, meteorological–phytopathological–phenological model.

From a bioclimatological point of view, in the area of study the Winkler index ranges from 1500 to 2000 (Amerine & Winkler Reference Amerine and Winkler1944), reaching values higher than 1700 during the period 2004–08. Moreover, the bioclimatic Huglin index (Huglin Reference Huglin1983) generally varies from 2200 to 2700, recording values above 2500 during the research period (2004–8). Both Index values correspond to potentially ‘excellent’ harvest.
Harvest prediction models
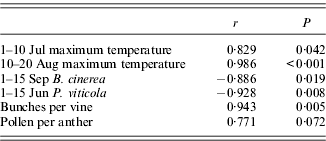
In order to determine the effects of the major meteorological, phenological and phytopathological variables on final grape production, Spearman's linear correlations (r) were calculated. A summary is shown in Table 1, in order to highlight the variables displaying the strongest correlation with the final grape production. The meteorological variables selected were maximum temperatures in the first 10 days of July and the second 10 days of August. The phenological variables displaying the greatest correlation with grape output were number of bunches per vine and pollen production per anther. Phytopathological variables displayed a negative correlation with final grape production, the strongest correlations being recorded when airborne phytopathogenic spore counts were highest, i.e. June and September, mainly for P. viticola.
Summary of significant Spearman correlation coefficients of various parameters with Godello observed production

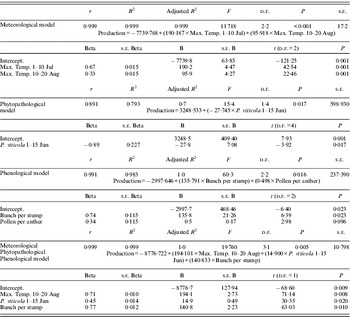
Using the results obtained by correlation analysis, multi-linear regression equations were drawn up to forecast final grape production, including the meteorological, phenological and phytopathological variables as estimators displaying elevated significance levels and correlation coefficients. The first model included only meteorological variables as independent parameters (maximum temperature in the first 10 days of July and the second 10 days of August); the regression equation obtained accounted for 0·99 of variance in grape production. The model that included only phytopathological estimators (P. viticola counts over the first week in June) accounted for 0·74 of variation in grape production. The regression equation obtained including only number of bunches per vine and pollen production per anther accounted for 0·97 of variation in grape harvest. Finally, a model was developed to combine the three types of variable: meteorological, phytopathological and phenological. The most accurate model included maximum temperature during the second 10 days of August, P. viticola spore counts during the first 2 weeks in June and number of bunches per vine as independent variables (Table 2).
Models forecasting grapevine yields using meteorological, phonological or phytopathological variables, or all three combined

The Beta coefficient is the standardized regression coefficient (all variables standardized to a mean of 0 and a standard deviation of 1·0) and s.e. Beta is its standard error. The B coefficient is the unstandardized regression coefficient and s.e. B is its standard error.
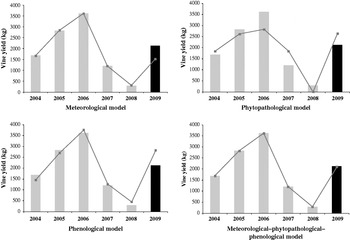
Models were validated for accuracy using data for the years 2004–8 (used to develop the models) and data for 2009 (not included in model development). Results are shown in Fig. 6. All models displayed high predictive capacity, the best results being obtained with the general equation combining meteorological, phytopathological and phenological variables. Production estimates by all models approximated actual production figures (Fig. 6). The precision of the model was statistically verified by t-test and the results indicated no significant differences between estimated and actual production figures (Table 3).
Vine yield (kg) observed (bars) and predicted (lines) by means of the regression models during the period of study.

t-test for the real production values and estimated production values. Marked differences significant at P<0·050; Diff: significant differences, s.d. Diff.: Standard deviations differences

DISCUSSION
A good harvest depends primarily on adequate floral-organ development and on the production of highly viable pollen with good germination capacity. Fertilization behaviour differs among grapevine varieties: some are self-compatible or semi-fertile, while others are self-incompatible (Kimura et al. Reference Kimura, Okamoto and Hirano1998; Kelen & Demirtas Reference Kelen and Demirtas2003) and require a pollinator to ensure good quantitative and qualitative results (Kelen et al. Reference Kelen, Sutyemez, Beyhan and Yalinkiliç1996). Pollination mainly involves wind and certain insects.
Final grape production is also influenced by meteorological variables affecting pollen emission, by the presence of phytopathogenic fungi and by the duration of the various phenological phases. In the present study, consecutive annual records for these variables were used to generate regional output forecasts (Naab et al. Reference Naab, Caccavari and Caramuti2003) for the Godello variety. Mean duration of the Godello cycle was 161 days from the start of Stage 1 to harvest; any variety whose cycle exceeds 140 days in the Ribeiro region is considered a late variety (McIntyre et al. Reference McIntyre, Lider and Ferrari1982). Stage 6, flowering – the key stage for a successful grape harvest – started in early June and lasted an average of 10 days. This value is slightly lower than the average of 12–16 days reported for flowering duration in different grapevine varieties in Turkey (Kelen & Demirtas Reference Kelen and Demirtas2003). Adequate weather conditions are essential during this stage to ensure fertilization: temperatures around 20°C with dry weather and a slight wind are considered ideal for pollination (Gil Reference Gil1999), whereas low temperatures around 15–16°C accompanied by rain may impair the efficacy of fertilization due to a delay in normal flower opening, falling of the corolla, interference in carbohydrate physiology and adverse effects on ovule development and/or pollen tube growth (Lebon et al. Reference Lebon, Duchêne, Brun and Clément2005). Temperatures from 26·7 to 32·3°C are ideal for ovule germination and pollen tube growth, whereas these processes are inhibited at temperatures below 15·6°C and above 37·8°C (Dokoozlian Reference Dokoozlian and Christensen2000). In the present study, weather conditions during flowering generally favoured fertilization: the average temperature was around 20°C and maximum temperatures varied from 24 to 34°C; rainfall was scarce (totalling only 8 and 11 mm, respectively, in 2007 and 2008).
Another key determinant of final grape production is airborne spore counts during the crop flowering cycle. Previous studies in various Galician vineyards have highlighted the abundance of B. cinerea spores in comparison with U. necator and P. viticola spores (Díaz et al. Reference Díaz, Iglésias and Jato1997, Reference Díaz, Iglésias and Jato1998; Rodríguez-Rajo et al. Reference Rodríguez-Rajo, Jato and Aira2002; Albelda et al. Reference Albelda, Rodríguez-Rajo, Jato and Aira2005). In ecological terms, this may be due in part to nutritional or toxic antagonistic interactions between the three fungal species (Picco Reference Picco1992). Moreover, the vulnerability of grapevine to pathogenic attack depends largely on the phenological stage at which the attack takes place, on the particular pathogen involved and on prevailing weather conditions. Stage 6 and the period from beginning of ripening to harvest (Stages 7 and 8) are the most vulnerable to B. cinerea attack (Latorre Reference Latorre1986; Bulit & Dubos Reference Bulit, Dubos, Pearson and Goheen1988). Critical periods for U. necator attacks are from the start of flowering until the berries reach 7 mm in diameter (Stages 6 and 7) (Campbell et al. Reference Campbell, Bendek and Latorre2007), while for P. viticola vines are at their most vulnerable during flowering and development of fruits (Díaz Reference Díaz1999). In the present study, maximum B. cinerea counts were recorded during Stage 5, which lasted a mean 35 days. In 2005, 2007 and 2008, weather conditions during this stage included maximum temperatures of around 20°C, and slight rainfall for 2–3 days followed a dry period of 4–5 days. These conditions would prompt an increase in environmental humidity, thus providing ideal conditions for Botrytis infection (Broome et al. Reference Broome, English, Marois, Latorre and Avilés1995; Nair et al. Reference Nair, Guilbaud-Oulton, Barchia and Emmett1995; Latorre et al. Reference Latorre, Rioja and Lillo2002); this would account for the elevated incidence recorded. In 2006, B. cinerea counts did not peak until the start of Stage 7, while in 2004 maximum values were recorded during Stage 8. This delay may be related to severe disease incidence during flowering and the final phase of Stage 5. A number of authors (Latorre & Vasquez Reference Latorre and Vasquez1996; Holz et al. Reference Holz, Coertze and Basson1997; Wolf et al. Reference Wolf, Baudoin and Martínez-Ochoa1997) report that latent infections during this period are an important source of primary inoculums for infections in the harvest or post-harvest period.
U. necator counts increased from the start of Stage 5, peaking either at the end of this stage or during Stage 6. The average temperature during flowering was c. 24°C. Gadoury & Pearson (Reference Gadoury and Pearson1990) indicate that rainfall of 2·5 mm followed by a 4 h humid period with temperatures of 6–24°C enables Uncinula ascospore dispersal during these critical stages (Campbell et al. Reference Campbell, Bendek and Latorre2007). Intermittent rainfall coincided with peak U. necator counts in 2007 and 2008, although in 2007 peaks were delayed to Stage 7.
Maximum P. viticola spore counts were recorded during Stage 6 in 2008 and Stage 7 in 2004, while counts peaked earlier – during Stage 5 – in 2005, 2006 and 2007. A slight increase in Plasmopara counts was noted every year during Stage 8, though the magnitude of the increase varied year by year. Weather conditions during those stages favoured Plasmopara development: average temperature during Stage 6 in 2005, 2006, 2007 and 2008 ranged from 15·4 to 18°C, while in 2004 the temperature during Stage 7 was 22°C. Temperature is a critical factor regulating sporangial germination and maturation; temperatures of 20–24°C are deemed ideal for infection (Laviola et al. Reference Laviola, Burruano and Strazzeri1986), whereas temperatures of 5–30°C are conducive to sporulation (Lalancette et al. Reference Lalancette, Madden and Ellis1988). Therefore, in early spring, when nights are still cold, sporulation may limit the epidemic more than infection. In contrast, night temperatures in late spring and summer are ideal for sporulation but too high for infection. In the study area, the number of days on which maximum temperatures exceeded 30°C during July and August ranged from 20 to 45 (with the exception of only 13 days in 2007); this favoured an increase in spore counts during the summer. Moreover, rainfall of 10 mm on 1 or 2 consecutive days, accompanied by higher average temperatures of up to 12°C, favoured primary infection (Hidalgo Reference Hidalgo2002).
Recent years have seen a growing interest in phenological pollen-production studies, since these can contribute to advanced forecasts of final grape production. Meteorological, phenological and phytopathological variables – together with genetic factors – regulate pollen production per anther, number of bunches per vine and number of flowers per vine. These parameters will determine the amount of pollen available for self-fertilization, entomophily or anemophily, in order to ensure effective ovary fertilization and berry formation. Vitis floral biology favours self-pollination before flower opening is completed. Although this is uncommon in the Godello variety, phenological sampling occasionally showed that welded petals remained in place over already-studded fruits. As a result, the positioning of the calyptra over the ovary might impede pollen release, thus facilitating self-fertilization (personal observation, not included in data). Since few pollen-production studies have been published, available data are insufficient to evaluate potential differences between Vitis varieties. Average pollen production per anther in the present study was 3169 pollen grains. In the Turkish varieties Siyad gemre and Razaki, fewer pollen grains (1500 and 1406, respectively) have been reported by Kelen & Demirtas (Reference Kelen and Demirtas2003), while more grains were recorded in eight other varieties studied by those same authors. Pollen production per vine displayed considerable annual variation, and was mainly determined by differences in the number and size of bunches (which might account for the low pollen-per-vine figure recorded in 2008) and in pollen production per anther (whose value in 2007 was the lowest for the study as a whole).
Various grape-production forecasting models were developed on the basis of the meteorological, phenological and phytopathological studies performed in the present study. The difference between actual production and production estimated by the meteorological model for 2009 was 39%, compared with 23·9% for the phytopathological model and 24% for the phenological model. This suggests that while phenological variables during flowering affect potential harvest, other factors are also important in determining final production levels, and may thus be partly responsible for considerable economic losses in some years. In regions experiencing frequent water stress in summer, post-flowering factors have much less influence on wine production than flowering-related factors (Cunha et al. Reference Cunha, Abreu, Pinto and De Castro2003). However, in regions with early flowering or rainy post-flowering periods and a marked year-on-year variation in water stress, information on additional parameters – such as fungal disease (which could reduce wine production by 20–40%), crop practices and weather conditions after flowering – is required in order to obtain accurate models (Cunha et al. Reference Cunha, Abreu, Pinto and De Castro2003). Some authors (Vossen & Rijks Reference Vossen and Rijks1995; Besselat & Cour Reference Besselat, Cour, Dallemand and Vossen1996; Besselat et al. Reference Besselat, Cour, Montanarella and Conrradi1997; Cunha Reference Cunha2002) suggest that phenological forecasting parameters during flowering in vineyards are less applicable if year-on-year variations in water supply account for much of the deviation in final yield from the early crop potential as estimated at flowering (Cunha et al. Reference Cunha, Abreu, Pinto and De Castro2003). According to forecasting results obtained in various Portugal vineyards (Cunha et al. Reference Cunha, Abreu, Pinto and De Castro2003), statistical tests indicated that 0·69–0·95 of the annual variability in wine production could be explained by agropalynoclimatological forecast models. When the accuracy of these was tested with real yield data, a deviation from actual reported production of −12·4 to −0·8% was recorded (Cunha et al. Reference Cunha, Abreu, Pinto and De Castro2003). This technique has been widely used since the 1990s to predict output for other major commercial crops in the Mediterranean area, such as olives and almonds (Besselat & Cour Reference Besselat and Cour1990; Candau et al. Reference Candau, González Minero and González Romano1991, Reference Candau, González Minero and Tomás1998; Fornaciari & Romano Reference Fornaciari and Romano1995; Cunha et al. Reference Cunha, Abreu, Pinto and De Castro2003; Galán et al. Reference Galán, Vázquez, García-Mozo and Domínguez2004, Reference Galán, Cariñanos, Alcázar and Domínguez2007).
In order to predict the Godello harvest, the general model tested in the present work included a combination of the three types of variables (meteorological, phenological and phytopathological), with a view to taking into account the processes occurring during post-flowering stages. The general model – based on average maximum temperatures during the second 10 days of August, the sum of P. viticola spore counts during the first 2 weeks of June, and average bunch production per vine – accounted for 0·99 of harvest variability; the estimation for Godello production in 2009 using this model differed by 1% from actual data (Fig. 6). This means that the grape harvest can be accurately predicted one month beforehand, allowing the winery to organize harvest and post-harvest processes more effectively, and to detect possible fraud due to the introduction of foreign grapes in Designation of Origin areas.
The conclusions from this work are that forecasting models developed on the basis of meteorological, phenological and phytopathological variables affecting the period between flowering and harvest provide a valuable tool for predicting potential grape harvest and thus wine production. The forecasting model developed here, seems able to provide an accurate early indication of harvest quantity. Thus, the model could be used as a basis for crop-husbandry decisions, technical improvements, the detection of fraud (introduction of grapes from outside into Denomination areas) and the optimization of winery processes.
This study was financed by the project PGIDIT07PXIB2000076PR supported by the Galician Regional Government.