Introduction
Sea ice, and its potential interaction with the Earth's climate, has been the focus of an increasing number of studies in the last few decades. Indeed, the sea ice cover that seasonally expands around the Antarctic continent, and permanently covers much of the Arctic Ocean, has been shown to play a major role in the climate in terms of, for example, albedo feedback, production of water masses such as Antarctic Bottom Water and Intermediate Water, and matter and energy exchanges between the ocean and the atmosphere. There is also growing evidence that sea ice plays a very important biogeochemical role (Thomas & Papadimitriou Reference Thomas, Papadimitriou, Thomas and Dieckmann2003), notably in the carbon cycle via the incorporation of a large variety and considerable quantity of organisms (e.g. Horner et al. Reference Horner, Syversten, Thomas and Lange1988) which are trapped in the sea ice during its growth.
The Belgian SIBCLIM program (Sea Ice Biogeochemistry in a CLIMate change perspective), whose major aim is to study biogeochemical cycles in Arctic and Antarctic sea ice and to assess their impact on CO2 and DMS fluxes at the ocean-atmosphere interface of the polar regions (Tison et al. Reference Tison, Lorrain, Verbeke, Lancelot, Becquevort, Schoemann, Chou, de Jong, Lanuzelle and Dellile2003), has given us the opportunity of running field sampling programmes both in the pack ice and the land-fast sea ice. This paper relies on a time series of ice cores collected in McMurdo Sound (Ross Sea, Antarctica) between 1999 and 2003.
Past studies of physical and biological properties of land-fast sea ice in McMurdo Sound have shown that a 2 m thick cover of annual sea ice with a well developed biological bottom community was a feature commonly found from the end of the winter to the summer, which is the period of development of sea ice micro-organism communities (e.g. Knox Reference Knox, Kerry and Hempel1990). These communities include organisms from different taxonomic groups, such as algae, bacteria and protozoa, and different functional groups, e.g. autotrophs and heterotrophs. Although bottom communities are dominant in McMurdo Sound, other communities have also been described from elsewhere that live near the surface and in the interior of the ice sheet (Horner et al. Reference Horner, Ackley, Dieckmann, Gulliksen, Hoshiai, Legendre, Melnikov, Reeburgh, Spindler and Sullivan1992).
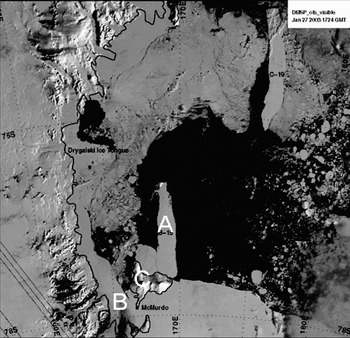
During the period covered by this study, more precisely at the beginning of year 2000, a very large iceberg (295 km long and 37 km wide, on average), named B-15, detached itself from the Ross Ice Shelf nearby and became stranded at the entrance of McMurdo Sound (see e.g. Arrigo et al. Reference Arrigo, van Dijken, Ainley, Fahnestock and Markus2002 and Fig. 1), where it prevented the usual oceanic circulation which usually leads to the annual collapse of the major part of the sea ice cover in the Sound. Barry & Dayton (Reference Barry and Dayton1988), among others, have described the oceanic circulation in the Sound, in the absence of grounded iceberg, and this is summarized in the next section.
Satellite image from 27 January 2003 Showing location of the B-15 iceberg (A), McMurdo Sound (B) and Ross Island (C). Background DMSP picture courtesy of USAP (http://www.usap.gov/videoClipsAndMaps/satImages/).

This paper focuses on the role of the B-15 iceberg on the evolution of some physical and biological properties of land-fast sea ice in McMurdo Sound between 1999–2003.
The sea ice regime in McMurdo Sound
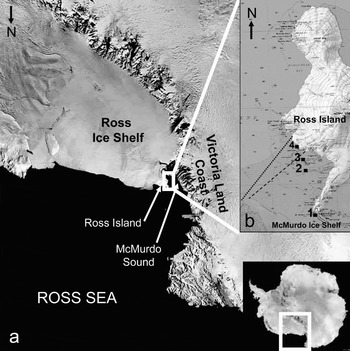
McMurdo Sound is located in the Ross Sea, in the Pacific sector of Antarctica, between Ross Island, the Ross Ice Shelf and the Victoria Land coast (Fig. 2a). Because the coastal environment is dominant, land-fast sea ice will be found rather than pack ice, which will considerably impact the structure of the sea ice cover. The air temperatures in McMurdo Sound fluctuate between -50°C in July–August and +5°C in December–January (Paige Reference Paige1966). Typically, the growth of the sea ice begins in March–April and continues until December, when the ice cover is generally 2 m thick. The maximum thicknesses are generally found in the western side of the Sound, where the ice can become multi-year (Leventer & Dunbar Reference Leventer and Dunbar1988).
a. Location of the McMurdo Sound and neighbouring geographical features, b. location of the four drilling sites in McMurdo Sound, and position of the ice edge on 22 February 2002 (dashed line) and 27 February 2003 (dotted line).

Because of the sheltered nature of McMurdo Sound, ice grows mainly as columnar congelation ice in the first half of the winter, following a short initial stage as granular-frazil ice. However, because of the proximity of the Ross Ice Shelf, ice growth will proceed through the accumulation, from July onwards, of a significant layer of platelet ice crystals. These form in supercooled waters which have been clearly identified at the front of the McMurdo Ice Shelf, where supercooling of surface waters increases closer to the ice shelf front (Lewis & Perkin Reference Lewis and Perkin1985), and particularly in the western part of the Sound (fig. 5 in Barry Reference Barry1988). It is not clear yet if most crystal nucleation occurs as ice shelf waters find their way out of the Ross subice shelf cavity or if some of it grows in situ at the underside of the sea ice cover as supercooled water emerges in front of the McMurdo Ice Shelf (e.g. Jeffries et al. Reference Jeffries, Weeks, Shaw and Morris1993, Gow et al. Reference Gow, Ackley, Govoni and Weeks1998, Tison et al. Reference Tison, Lorrain, Bouzette, Dini, Bondesan and Stievenard1998, Smith et al. Reference Smith, Langhorne, Haskell, Trodaht, Frew and Vennell2001, Leonard et al. Reference Leonard, Purdie, Langhorne, Haskell, Williams and Frew2006). Nevertheless, whatever its origin, platelet ice generally forms a layer several decimetres thick accreting at the bottom of the sea ice cover in the second half of the winter.
The oceanic circulation in the Ross Sea is characterized by a great cyclonic gyre that flows near the entrance of the Sound (Knox et al. Reference Knox, Ling, Patrick, Wilson and Waterhouse2001, fig. 3 in Assmann et al. Reference Assmann, Hellmer and & Beckmann2003). In the Sound, mean surface currents are southerly in the eastern part, northerly in the west, and mixed but slightly northward in the central Sound (Barry & Dayton Reference Barry and Dayton1988). Each summer, from January–March, this current, whose waters are warmer, will lead to the melting, breaking up and collapse of the major part of the ice cover of the Sound. From late January–March, the sea ice cover generally breaks up (Heine Reference Heine1963, Paige Reference Paige1971, Kovacs et al. Reference Kovacs, Gow, Cragin and Morey1982). The thinning of the ice cover is principally due to basal melting because of the warm oceanic current with surface melting of less importance.
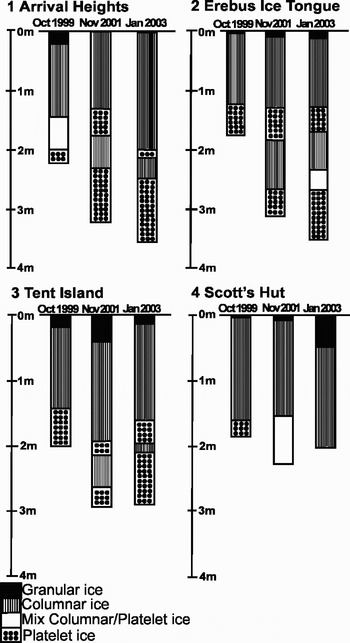
Time series of the thickness and texture of the sea ice cover at the four stations in McMurdo Sound.

Sampling and methods
Three drilling campaigns (spring 1999, spring 2001, summer 2003) were performed in McMurdo Sound, providing the material for this paper. They were all roughly located along a line from McMurdo/Scott Base to Cape Evans (Scott's Hut), aiming away from the McMurdo Ice Shelf front (Fig. 2b). Four stations (Table I) have been systematically sampled during these drilling campaigns.
Dates of sampling and location of stations.

A total of 4–8 cores were retrieved at each station in an homogeneous area of sea ice, and at a maximum distance of a few decimetres from each other. The absolute locations of the drilling sites were determined by GPS measurement, so that these locations could be revisited from year to year. The cores were extracted with a CRREL 3 inch ice auger, in a set of pieces of c. 50 cm in length. The cores could not be oriented in the horizontal plane, thus preventing the possibility of studying relationship of ice properties to subice water current directions and velocities.
Temperatures were systematically measured in the field, immediately after extraction, at regular depths on a first core (5 cm intervals), using a calibrated temperature probe (TESTO 720) with precision of ± 0.1°C. Another core was dedicated to the making of the thin sections for textural and fabric analysis and for salinity profiles. Thin sections were produced following standard procedures of Langway (Reference Langway1958) and Weeks & Gow (Reference Weeks and Gow1978, Reference Weeks and Gow1980). Continuous salinity measurements were obtained from melted ice slices with a mean thickness of 8 cm. A conductimeter TACUSSEL type CD810 and a conductivity probe TACUSSEL type XE100 were used for these measurements. Calibrations were done with standard solutions (KCl 12.85 mS s-1). The precision of the method was assessed to be ± 0.05% by Tison et al. (Reference Tison, Haas, Gowing, Sleewaegen and Bernard2002).
Relative brine volumes (Vb/V = brine volume/sea ice volume ratio) were calculated on the basis of temperature and salinity profiles following the equations of Cox & Weeks (Reference Cox and Weeks1983) and Leppäranta & Manninen (Reference Lepparänta and Manninen1988), revisited in Eicken (Reference Eicken, Thomas and Dieckmann2003).
The biological parameters discussed in this paper were measured only at the four stations sampled from January 2003, with the exception of microscopic counting of algae and protozoa which were performed for cores from stations 2 and 4 only. The samples came from discrete intervals within the cores, chosen with the following rationale: one at the surface, one to two in the interior and three to five at the bottom. The exact number of samples was guided by visual inspection of the cores (potential presence of algal inclusions). This specific setting was chosen because it was in good agreement with the basal-dominated communities previously reported in McMurdo Sound (Sullivan & Palmisano Reference Sullivan and Palmisano1984). It was, however, giving us (limited) opportunity to sample potential surface or internal communities, when these were not detectable visually. The chlorophyll a (chl a) concentrations were calculated with the spectrometric method described by Lorenzen (Reference Lorenzen1967) on the basis of in-laboratory melted ice samples diluted with artificial seawater prepared following Harrison et al. (Reference Harrison, Waters and Taylor1980). The algae, bacteria and protozoa abundance was determined by epifluorescence microscopy after DAPI staining (Porter et al. Reference Porter and Feig1980) on the basis of in situ ice samples melted in prefiltered seawater with formaldehyde (2%), in order to avoid osmotic shock fatal to sympagic organisms during sample melting (Garrison & Buck Reference Garrison and Buck1986). Bacterial biovolumes were determined by image analysis (Lucia 4.6 software) and calculated by treating rods and cocci as cylinders and spheres respectively (Watson et al. Reference Watson, Novitsky, Quinby and Valois1977). They were converted to specific carbon biomass by using the relationship established from data measured by Simon & Azam (Reference Simon and Azam1989). Numbers of phytoplankton-attached bacteria were estimated directly over phytoplankton or derived aggregates (Becquevort & Smith Reference Becquevort and Smith2001). Possible overestimation of attached bacteria due to scavenging of the free-living bacteria over particles during the filtration was considered. Algae and protozoan biomass was calculated from the abundance and the specific carbon biomass estimated by the relationship established by Menden-Deuer & Lessard (Reference Menden-Deuer and Lessard2000). The morphology of the different organisms was also taken into account with a set of geometric correspondences (Hillebrand et al. Reference Hillebrand, Dürselen and Kirschtel1999).
Results
Physical characteristics
Figure 3 shows the evolution of the ice thickness and the texture of the sea ice cover for the three observation periods. The mean thickness during the drilling campaign of 1999 was about 2 m for all stations, with spatial variability ranging between 3 and 13 cm between neighbouring cores at the same location. The stratigraphy consisted of a thin layer of granular ice, followed by a layer of congelation ice below which a platelet ice layer had been accreted. Between 1999 and 2003, the thickness of the sea ice cover generally increased to reach values higher than 3 m in some cases, and the stratigraphy was characterized by repeated alternation of columnar and platelet ice. The lower section of columnar ice was always thinner than the upper one. Only at station 4 did the sea ice cover thickness not significantly change from year to year, with also no sign of repeated columnar-platelet alternation. The absolute spatial ice thickness variability for cores taken in a given year at a given site ranged between 6 and 15.5 cm for 2001 and between 7.5 and 22 cm for 2003. No snow cover was observed at any location at any time.
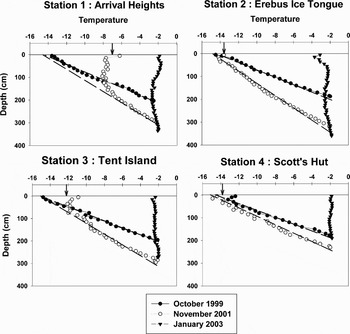
The evolution of the temperature profiles at the four stations during the three observation periods is illustrated in Fig. 4. All 1999 profiles are very similar and linear (with the exception of the upper 20 cm at Scott's Hut where slightly warmer temperatures were observed) trending towards a surface temperature of about -15°C. Mean temperature for 1999 ranged between -8°C and -8.3°C. In contrast, the temperature profiles for the first half of November 2001 show a dramatic warming trend over a few days. This trend affected up to 150 cm of the surface ice layer in the Arrival Heights profile, the lower half showing a linear trend. Mean temperature for 2001 ranged between -6.2°C and -8.8°C. In 2003, all profiles were characterized by temperatures ranging between -2°C and -4°C and mean temperature ranging between -1.9°C and -2.4°C. The three thickest stations (1, 2 and 3) however, lagged slightly behind by a maximum of 1°C. Also noticeable is the local surface cooling effect at the Erebus station 2.
Time series of temperature (°C) profiles in the sea ice at the four stations in the McMurdo Sound during the three observation periods (1999, 2001 and 2003). Dashed lines = extrapolated linear temperature profiles. Arrows indicate atmospheric temperature during sampling.

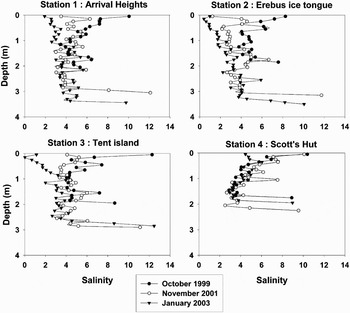
Figure 5 shows the evolution of the bulk ice salinity profiles at the four stations during the three observation periods. Point salinity values range from 0‰ to 13‰. Mean bulk ice salinities at the four stations vary between 4.9‰ and 5.6‰ for October 1999, between 3.8‰ and 5.2‰ for November 2001 and between 3.2‰ and 4.4‰ for January 2003. At all stations, the salinity profile of October 1999 always shows higher values at the top and the bottom of the sea ice cover (C-shaped profile). Only station 4 shows such a profile throughout the whole observation period, with a slight desalinization of the surface layer in January 2003. It is also worth noting the reduction in salinity heterogeneities as the season progressed. The most important trend is the decrease in the salinity of the three thickest stations (1, 2 and 3) which occurred principally in the upper part of the sea ice cover (where the shift of salinity to lower values was more important) between 2001 and 2003. It is also interesting to note that this desalination trend did not affect the salinity profile below 1.2–1.5 m in all those stations.
Time series of the salinity (‰) profiles at the four surveyed stations in McMurdo Sound.

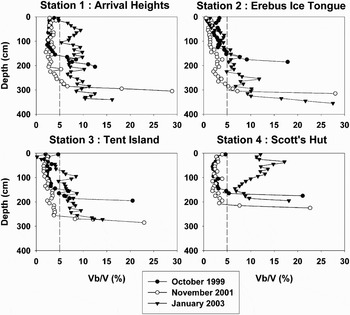
The calculated brine volume profiles at the four stations during the three observation periods is shown in Fig. 6 as well as the 5% brine volume threshold. Values of calculated mean brine volumes ranged between 3.9–4.5% for October 1999, between 3.3–4.8% for November 2001 and between 6.6–11.1% for January 2003. All October 1999 and November 2001 profiles show a strong similarity, with a “porous” layer (i.e. characterized by values higher than 5%) confined only to the bottom few decimetres. November 2001 profiles of the three thickest stations (1–3) additionally show a slight increasing trend with depth. More striking is the contrast between the 2003 profiles. Station 4 (Scott's Hut) showing high relative brine volume through its whole thickness, especially in its upper half and bottom part. In contrast, two out of the three thickest stations (2 & 3) have lower values in their upper 0.80 to 1.5 m.
Evolution of the calculated brine volume Vb/V (%) profiles at the four stations in McMurdo Sound. Dashed lines represent the 5% brine volume threshold.

Biological characteristics
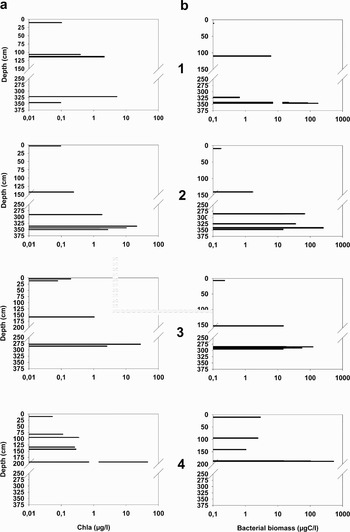
The chl a concentrations measured along sea ice profiles in January 2003 vary from 0.02–41.72 µg chl a l-1 (Fig. 7a). The maximum value is observed at station 4 (Scott's Hut) and is located at the ice-ocean interface. For the three other stations, the maximum values are found slightly above the ice-ocean interface with a decrease in concentrations toward the interface. Comparing maximum chl a values close to the ice-water interface shows a decreasing trend with ice thickness increase by a factor of 7 (41.72 µg l-1 to 5.29 µg l-1). Assessing algae biomass by microscopic observation, as was done for stations 4 (Scott's Hut) and 2 (Erebus Ice Tongue), confirms that the latter is characterized by a much lower algae biomass (375.3 µg C l-1) than the former (3924.7 µg C l-1). As for the chl a, the maximum values are localized at the ice-ocean interface for thinner station 4 and just above it for thicker station 2. The phaeopigments/chl a ratios were also assessed. They are much higher for stations 2 & 3, ranging between 1.10 and 0.81, while values of less than 0.30 were found for the other stations.
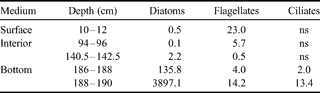
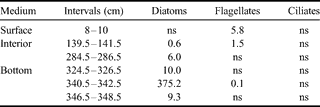
Our taxonomic observations for autotrophic organisms at stations 2 & 4 in January 2003 are summarized in Tables II & III. Pennate diatoms, in particular Amphiprora sp. and Nitzschia stellata, are by far the dominant group, occurring generally in the basal part of the sea ice cover, and in higher amounts at station 4. Diatoms are virtually absent from the upper part of the ice sheet, where flagellates dominate, with a particular species of dinoflagellates (Polarella glacialis) which is encysted. Some autotrophic ciliates were observed at the bottom section in station 4. It should be noted that, as for the diatoms in the bottom community, dinoflagellates of the surface and interior communities are in lower biomasses at station 2.
Autotrophic biomasses of different taxonomic groups at first year ice station 4 (Scott's Hut) in January 2003 (µg C l-1).
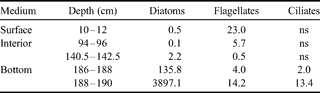
ns = non significant.
Autotrophic biomasses of different taxonomic groups at second year ice station 2 (Erebus Ice Tongue) in January 2003 (µg C l-1).
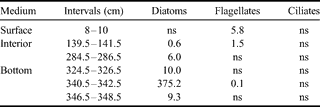
ns = non significant.
Profiles of bacterial biomass as measured for the four stations in January 2003 are shown in Fig. 7b. In each case the maximum values were found in the basal part of the ice sheet, although a decrease similar to the one seen in the chl a concentration in the very bottom part was also observed at some stations (2 & 3). Maximum values ranged between 123.9–203.9 µg C l-1 for stations 1–3, and 282.6 µg C l-1 for station 4. The latter thus shows a higher value, but the quantitative difference with second year ice stations is moderate. Nevertheless, there is an important quantitative difference in terms of percentage of attached bacteria, which ranged between 58–61% for stations 2 & 3 but less than 16% for stations 1 & 4.
a. Chlorophyll a concentrations at the four stations in McMurdo Sound in January 2003. b. Profiles of bacterial biomass at the four surveyed stations in McMurdo Sound in January 2003. Numbers 1 to 4 indicate the number of the corresponding station.

Finally, the biomass of heterotrophic protozoa was also globally assessed at stations 2 & 4. The trend was the same as for chl a, algal and bacterial biomass, namely higher at station 4. Maximum values were 22.1 µg C l-1 and 3.7 µg C l-1 for stations 4 and 2 respectively, and they were also found in the basal part of the ice sheet.
Discussion
Physical properties
The mean thickness measured during the drilling campaign of 1999 is in good agreement with findings in the past in McMurdo Sound (e.g. Jeffries & Weeks Reference Jeffries and Weeks1992, Gow et al. Reference Gow, Ackley, Govoni and Weeks1998), and corresponds to the typical stratigraphy of an annual ice sheet, i.e. a single sequence of granular-columnar-platelet ice. With the increased thickness and the appearance of repeated alternation of columnar and platelet ice, the ice sheet of three out of the four stations (1–3) demonstrates the build-up of second year ice while that of station 4 remained typical of annual ice, with a thickness similar to previous years and no repetition of ice types. For the three second year stations, the moderate thickness of the columnar section corresponding to the second year of ice growth is in accordance with the reduction of conductive heat fluxes due to the generally increasing thickness of the whole sea ice cover. The slight decrease in thickness of the second year station 3 between 2001–03 is not significant because it falls in the range of the measured spatial thickness variability at that station. This build-up of a second year ice cover in the eastern part of McMurdo Sound, along Ross Island, is a quite uncommon feature. The collapse of the sea ice cover, normally in January and February, did not happen in this part of the Sound, and this led to the build-up of a second year ice cover in the most remote part of the Sound, clearly disrupting breeding and feeding behaviour of penguins and seals and impacting the McMurdo Sound ecosystem (Arrigo et al. Reference Arrigo, van Dijken, Ainley, Fahnestock and Markus2002). Station 4, which is at the northern edge of this area, maintained a first year sea ice cover throughout the period, and was therefore, rebuilt each year, as suggested by the ice edge positions in February 2002 and January 2003 (Fig. 2b).
The temperature profiles of Fig. 4 are primarily controlled by air temperature changes at the scale of weeks to months. The surface temperature of about -15°C, towards which the linear profiles of October 1999 are trending, is in agreement with the mean air temperature at McMurdo in October on larger time scales (-15.6°C for the 1959–88 period, Doran et al. Reference Doran, Dana, Hastings and Wharton1995). All profiles in November 2001 also show this linear trend towards a surface temperature of about -15°C, at least in their lower half. The upper half of the sea ice cover at Tent Island (station 3) and Arrival Heights (station 1) has clearly readjusted to the local recent (daily to weekly) air temperatures, as shown by the observed air temperature measured on site at the time of sampling (arrows in Fig. 4) and by the November 2001 temperature records for these two stations (AWS and CLIFLO data bases, 2007). In early January 2003 all profiles reached close to isothermal, as expected.
Salinity profiles (Fig. 5) will reflect both the second year sea ice situation linked with the stranding of B-15 between 2000–03 and the time in the season (early spring 1999 to summer 2003) at which the sampling occurred. In 1999, the higher values found at the top and the bottom of the sea ice cover are characteristics of the so-called C-shaped profile which is commonly found in first year ice (Eicken Reference Eicken1992) including the one in McMurdo Sound (Gow et al. Reference Gow, Ackley, Govoni and Weeks1998). In the C-shaped profile, increased salinities at the top of the sea ice cover can be attributed to higher growth rates and therefore higher salt segregation occurring during the initial stages of ice growth, and to brine expulsion. Enhanced bottom salinities are due to the important porosity characterizing either the platelet ice layers or the columnar skeletal layer (station 4, 2003) forming the basal part of the sea ice cover. As shown in the previous section, only station 4 kept a C-shaped salinity profile during the whole observation period, as would be expected from a first year sea ice cover rebuilt each year. The slight desalinization of the surface layer of this annual station in January 2003 is due to the warmer summer regime. The decrease of heterogeneities in bulk ice salinity as the season progresses is a feature already described in degrading experimental young sea ice (e.g. Cottier et al. Reference Cottier, Eicken and Wadhams1999) and natural Antarctic pack ice (e.g. Eicken Reference Eicken1992, Tison et al. Reference Tison, Lorrain, Verbeke, Lancelot, Becquevort, Schoemann, Chou, de Jong, Lanuzelle, Dellile, Dumont and Masson2006). The important decreasing trend in ice salinity that took place during the period of stranding of B-15 is due to the fact that during the summer the ice sheet is under the influence of various desalinization processes. This trend has often been documented in Arctic sea ice where it has mainly been attributed to fresh water flushing. Past studies (Cox & Weeks Reference Cox and Weeks1974, Maykut Reference Maykut and Horner1985) have shown that multi-year ice, which survives the summer, has generally lower bulk salinities because of these processes. Moreover, an inverse relationship between the thickness and the bulk ice salinity has been highlighted (Cox & Weeks Reference Cox and Weeks1974). Eicken (Reference Eicken1992) showed that the process also exists in Antarctic sea ice, but that it is mainly restricted to second and multi-year ice in marginal zones and resulting in what he refers to as I or ? profiles; the latter is similar to our second year profiles. Finally, the interruption of a clear desalination trend at about 1.20–1.50 m in our second year ice station can be attributed to the tortuous brine inclusions morphology of the platelet ice that will strongly differ from the more linear connectivity of brine channels in columnar ice (Krembs et al. Reference Krembs, Gradinger and Spindler2000), meaning less efficient brine transport downward compared to the layer above.
The B-15 “stranding event” initiated the development of second year ice in McMurdo Sound, by hampering the summer disintegration of the sea ice cover. As discussed above, this second year sea ice cover is characterized by a strong desalination of its upper half. This is likely to have had a significant impact on the relative brine volume and therefore the permeability of the ice core. The calculated brine volume of Fig. 6 reflects both the bulk salinity and temperature properties of the ice. In January 2003, a clear contrast existed between second year stations 2 and 3 (upper metre below or close to 5% brine volume) and first year station 4 (Vb/V >> 5%). This 5% brine volume threshold has been shown to be an indicator of a significant increase in sea ice permeability, because of the reconnection between individual brine inclusions (Buckley & Trodahl Reference Buckley and Trodahl1987, Golden et al. Reference Golden, Ackley and Lytle1998). The reduced permeability of the second year ice will affect its mechanical properties. Indeed, as recently demonstrated by Johnston (Reference Johnston2006 fig. 9) for first year Arctic sea ice, increasing the brine volume from 3–10%, results in a decrease of bulk borehole strength by a factor of 3 (from 15 to 5 MPa and vice versa). Therefore, break-up (naturally or artificially) of the multi-year sea ice cover in McMurdo Sound, as opposed to the usual first year ice, should have been hindered, not only because of increased ice thickness, but also because of the enhanced sea ice strength in its upper layer.
Biological properties
A lower algal biomass in second year sea ice
The temporary development of the second year sea ice cover in McMurdo Sound must also have altered the sea ice biological community. Increased ice thickness hampers the autotrophic productivity by limiting the amount of light available. Horner & Schrader (Reference Horner and Schrader1982) estimated that for an ice thickness of 180 cm, only 2% of the light reaches the bottom of the sea ice. The effect of ice thickness on light penetration has been reported in terms of albedo by Perovich (Reference Perovich1996) who showed that second year ice has a higher albedo than first year ice. This means a less important proportion of the light will reach the bottom part of the ice sheet in the first case. Furthermore, the decrease in summer brine volume at the second year ice station will also affect the microbial network (bacteria, algae and protozoa).
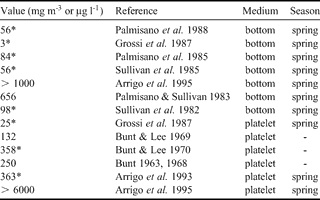
Chl a concentrations values from less than 10 to more than 6000 µg chl a l-1 have been reported for McMurdo Sound (see Table IV) and our data (Fig. 7a) thus lies in the lower part of this range. There is a considerably lower algae biomass present in the ice sheet from the second year sea ice station. The fact that the difference between the two types of stations is enhanced when using the carbon biomass from taxonomic counting as compared to the chl a concentrations is probably an indication that the algae adapt their chl a specific content in a low light environment (Palmisano et al. Reference Palmisano, SooHoo and Sullivan1985, Cota & Sullivan Reference Cota and Sullivan1990), which is the case at the base of a thicker ice sheet. In low light condition, almost all carbon produced in the cell is converted into pigment for photosynthesis (Geider et al. Reference Geider, MacIntyre and Kana1998), and the flux of excitation energy in carbohydrates is strongly reduced (Mock & Kroon Reference Mock and Kroon2002). This is clearly indicated by the C/chl a ratios of the basal parts of the two stations: 36.06 for station 2 (second year ice) and 94.07 for station 4 (first year ice). For various natural communities of polar algae in summer, C/chl a ratio has been recorded in the range between 20 and 200 (Smith & Sakshaug Reference Smith, Sakshaug and Smith1990, references therein). Values of 34.00 ± 12.1 were reported by Arrigo et al. (Reference Arrigo, Dieckmann, Gosselin, Robinson, Fritsen and Sullivan1995) for platelet ice algae. The value of station 2 is thus in agreement with previous observations. Nevertheless, the first year ice station 4 shows a much higher value, indicating lower light limitation in a thinner ice cover at the ice margin. There is therefore a strong contrast in the algal biomass between our first and the second year ice locations.
Maximum chl a concentration references in McMurdo Sound.
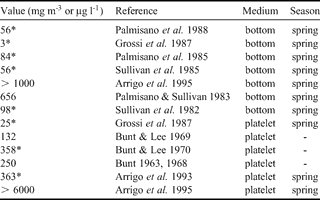
* * = recalculated from the corresponding reference.
A contrasted spatial species differentiation
Pennate diatoms, especially Amphiprora sp. and Nitzschia stellata, were dominant in the sea ice algal communities at both stations, particularly in the bottom part of the ice sheet. These algae species have already been reported for land-fast sea ice in Antarctica (Riaux-Gobin et al. Reference Riaux-Gobin, Tréguer, Poulin and &Vétion2000) including at McMurdo Sound (Palmisano & Sullivan Reference Palmisano and Sullivan1983, McMinn et al. Reference McMinn, Skerratt, Trull, Ashworth and Lizotte1999). Furthermore, the diatom-dominated assemblages have generally been reported to occur rather near the base of the ice sheet (Stoecker et al. Reference Stoecker, Gustafson, Black and Baier1998). By contrast, dinoflagellate-dominated communities have been reported to occur principally in the upper part of the ice sheet (e.g. Polarella glacialis, McMinn Reference McMinn1995) both in first year ice as well as in multi-year ice (Stoecker et al. Reference Stoecker, Gustafson, Merrell, Black and Baier1997). In particular, observations of this small photosynthetic dinoflagellate have already been reported for McMurdo Sound land-fast sea ice (Stoecker et al. Reference Stoecker, Gustafson, Merrell, Black and Baier1997, Montresor et al. Reference Montresor, Procaccini and Stoecker1999). Our results showing Polarella glacialis in the surface layer of the cores are thus in agreement with previous studies. The contrasted spatial distribution of diatoms and dinoflagellates in the ice sheet can be explained by the seasonal development and the survival capacities of both communities. Some dinoflagellates that populate the ice sheet during the autumnal bloom are able to survive during winter by encysting. Indeed, they can both grow and overwinter as a spiny encysted stage in the upper layer of land-fast sea ice (Montresor et al. Reference Montresor, Procaccini and Stoecker1999), notably because of their extremely halotolerant nature (Montresor et al. Reference Montresor, Lovejoy, Orsini, Procaccini and Roy2003). Diatom communities will be scavenged from mid-winter to late spring, where the ice sheet has become thicker, and will thus contribute to the basal sea ice community (Günther & Dieckmann Reference Günther and Dieckmann1999). The fact that the upper dinoflagellate community is less important in our second year could be explained by natural lysis linked with temporally limited encystement, by downward drainage occurring when the thickening of the ice sheet leads to increasing freeboard, or by meltwater flushing during the twice repeated warmer summer period.
Biomass values of heterotrophic protozoa at a coastal Antarctic site, where land-fast sea ice was the dominant ice type, were reported by Archer et al. (Reference Archer, Leakey, Burkill, Sleigh and Appleby1996) to approach 300 µg C l-1 in the bottom part of the ice sheet during December. The values found in this study, especially for second year ice station 2, are much lower. However, considering the amount of available autotrophic organisms, on which heterotrophic protozoa depend, and the period of sampling (January), these results are not unrealistic.
Sullivan & Palmisano (Reference Sullivan and Palmisano1984) found that more than 90% of the bacterial biomass is localized in the last 20 cm of the ice sheet in McMurdo Sound, which is corroborated by our findings. The higher amount of available organic matter (which comes from the lysis of organisms) and inorganic nutrients, and a temperature close to that of the ocean are favourable parameters that can explain this distribution. Furthermore, a close coupling of bacteria and certain species of ice diatoms (especially the genus Amphiprora), which are almost always localised at the base of the ice sheet, have been described (Sullivan & Palmisano Reference Sullivan and Palmisano1984). The decrease of bacterial biomass values at the ice-ocean interface of stations 2 & 3 could be explained by the higher amount of attached bacteria, i.e. which live in settlements on organic particles and aggregates. Indeed, the organic aggregates to which bacteria are attached are more likely to settle towards the bottom of the ocean because of i) ice melting, if it is shown that basal melting occurred (see further), or ii) facilitated grazing (Leventer Reference Leventer, Thomas and Dieckmann2003). Brine loss during core extraction could be another reason. It is interesting to note that station 1, which is the only second year station to have a low attached-bacteria proportion, only shows a basal decrease for chl a and not for bacterial biomass. The higher amounts of attached bacteria at stations 2 and 3 are corroborated by the much higher phaeopigments/ chl a ratios (from 0.81–1.10 in second year versus less than 0.30 in first year ice), suggesting the presence of degraded matter on which bacteria could settle.
A loss of biomass close to the ice-water interface
The important loss of chl a and algal and bacterial biomasses at the ice-water interface for the second year sea ice stations (especially for stations 2 & 3) is a characteristic feature of our dataset that could have multiple causes. A first obvious reason would be the loss of brine during ice core sampling, as recently highlighted by Notz et al. (Reference Notz, Wettlaufer and Worster2005), especially for ice with high permeability, which would be the case for the lower part of the ice sheet, the more so if it consisted of platelet ice. Note, indeed, that the profiles at station 4 (Scott's Hut), which did not have a basal platelet layer, did not show any decrease at the base of the ice sheet, although it was sampled during the same period as the other stations.
Preferential grazing in the bottom platelet layer of second year ice stations is another alternative. The irregular crystal structure and brine inclusion morphology characterizing the platelet ice layer (Backstrom & Eicken Reference Backstrom and & Eicken2006), has been shown to clearly influence the colonization of the ice by different organisms (Krembs et al. Reference Krembs, Gradinger and Spindler2000) as well as by predators.
Finally, basal melting from a positive oceanic heat flux during the summer should also be considered. Although platelet ice forms for half of the year (Jeffries et al. Reference Jeffries, Weeks, Shaw and Morris1993), supercooled water is not always present in McMurdo Sound. Summer satellite images from the iceberg period (http://www.usap.gov) show partially open water indicating at least some penetration of surface waters in McMurdo Sound. Even during the winter, precise T°C/salinity measurements from Leonard et al. (Reference Leonard, Purdie, Langhorne, Haskell, Williams and Frew2006) indicate significant positive departure from in situ freezing point temperature. Summer temperature profiles from Mitchell & Bye (Reference Mitchell and Bye1985) and Littlepage (Reference Littlepage1965) show temperatures up to 0.3°C above freezing temperature indicating surface waters entering the Sound in the summer. Melting at the base of sea ice has been reported by several authors in the summer (e.g. Leventer et al. Reference Leventer, Dunbar, Allen and Wayper1987). Jeffries et al. (Reference Jeffries, Weeks, Shaw and Morris1993) also underline that melting at the base of the sea ice cover occurred prior to sampling in January. However, sea water profiles under the eastern ice shelf margin (Robinson Reference Robinson2006) clearly indicate the absence of summer fresher and warmer surface waters during the iceberg period, in contrast to normal years. This emphasises the partial blocking effect of the surface water circulation by iceberg B-15. Nevertheless, the ice edge had clearly retreated to the station 4 position in 2002 (see Fig. 2b) suggesting partial invasion of surface water in the Sound and potential basal melting, at least in the outer part of McMurdo.
Whatever the reasons for these basal perturbations, they clearly affect trophic relationships as indicated by the correlation coefficient between bacterial biomass and the chl a concentration, or the autotrophic to heterotrophic ratios. In the first case, the correlation coefficients were ranging between 0.7 and 0.8 for first year ice stations and between 0.1 and 0.2 for second year ice stations, showing a direct response of bacteria to the increase in chl a only for the first year ice station. Stewart & Fritsen (Reference Stewart and Fritsen2004) have shown that bacteria-algae uncoupling, such as the one observed in this study for the second year ice stations, is probably facilitated by low algae production and residual biomass, which is also the case in the basal part of our second year ice stations. Indeed, recent work in first year pack ice (Krembs et al. Reference Krembs, Gradinger and Spindler2000) showed that up to 41% of the internal surface area of ice could be covered by organisms as biofilms. In the case of potential basal melting, these intercrystaline biofilms are likely to settle towards the bottom of the ocean, thus leading to the observed basal decrease trend of second year stations. This intercrystalline melting is also favoured by the higher concentrations of impurities, including freezing point depressants such as organic solvents.
Trophic ratios showed an increase in the proportion of heterotrophy versus autotrophy in second year ice station. Indeed, the autotrophic/heterotrophic ratio, for the basal part of the sea ice cover, shows values between 1.12 and 12.97 for first year ice station 4 and between 0.27 and 1.83 for second year ice station 2. This must be interpreted as a decrease of the autotrophic community for the reasons mentioned above.
Conclusion
The calving of the B-15 iceberg from the Ross Ice Shelf has been extensively discussed and its position closely surveyed, partly because of its amazing size. The stranding event that occurred at the entrance of McMurdo Sound, in the beginning of year 2000, prevented the usual oceanic circulation from removing the major part of the annual sea ice cover from this area. Implications for animals (seals, penguins) living on the sea ice cover have already been highlighted (Arrigo et al. Reference Arrigo, van Dijken, Ainley, Fahnestock and Markus2002). The present study shows that there were consequences too for the sea ice microbial community, in part because of the modification of their physical environment. Indeed, three out of the four stations studied here became second year ice stations: thickness increased to about 3 m, and structure became typical of second year sea ice with repeated alternation of columnar/congelation and platelet ice. Temperature profiles have overall been influenced by changes in air temperature during the sampling periods, but remnants of the winter temperatures have nevertheless been “recorded” in the lower part of the second year ice core. Bulk salinity profiles showed common C-shaped patterns before the stranding of B-15, but desalination processes which occurred during the summer led to decreasing bulk salinity in second year ice stations, principally in their upper half. Calculated relative brine volumes, which depend on temperature and salinity profiles, also showed a decrease at second year sea ice stations, especially for bulk salinity, in the upper part of the sea ice cover, where it thus became impermeable with higher potential mechanical strength. Both chl a and carbon biomass reconstructed from taxonomic counting clearly showed lower concentrations in the second year sea ice. Limited light penetration due to increased thickness and summer desalinization process were responsible for this situation. In all cases the chl a concentrations and the bacterial biomass were higher in the basal part of the sea ice cover, especially when composed of platelet ice. Nevertheless, the second year sea ice stations showed lower maximum values than the first year sea ice station and these were found just above the ice-ocean interface, with a decrease toward it for the majority of stations. Several reasons could explain this basal decrease of the biological material in second year ice stations: a) loss of brine during core sampling, especially from the platelet ice layer, b) facilitated grazing of the warm basal platelet ice layer, and c) partial basal melting due to positive oceanic heat flux. Taxonomic counting has shown that i) dinoflagellates, especially Polarella glacialis, are the dominant group in the surface communities, and ii) diatoms are dominant in the basal communities, especially Amphiprora sp. and Nitzschia stellata. Finally, some relationships between organisms have also been clearly modified: firstly the bacterial biomass/ chl a concentration correlation was not significant anymore for second year sea ice stations, and, secondly the autotrophic/heterotrophic ratios were shifted towards heterotrophy in second year sea ice.
Acknowledgements
The authors wish to sincerely thank Saïda El Amri, Véronique Schoemann, Véronique Verbeke and Isabelle Dumont for their help and collaboration. Jean-Philippe Remy is funded by a research grant from the Fund for Industrial and Agricultural Research - FRIA (Belgian National Science Foundation). This research was supported by the Belgian French Community (ARC-contract 02/07-287-SIBCLIM) and the Belgian Science policy (contract no. EV/11/7B-BELCANTO II).