1 Introduction
Opinion surveys often employ a battery of items to measure the respondent’s underlying value, belief, or attitude toward a subject. In the American National Election Studies (ANES), for example, racial resentment (toward blacks) is tapped by attitudes toward four different statements: (1) Generations of slavery and discrimination have created conditions that make it difficult for blacks to work their way out of the lower class; (2) Irish, Italians, Jewish and many other minorities overcame prejudice and worked their way up. Blacks should do the same without any special favors; (3) It’s really a matter of some people not trying hard enough; if blacks would only try harder they could be just as well off as whites; (4) Over the past few years blacks have gotten less than they deserve. For each of these items, the respondent can choose among a number of ordered responses, such as agree strongly, agree somewhat, neither agree or disagree, disagree somewhat, and disagree strongly.
To analyze such types of data, researchers have often followed a two-step approach—by first combining the multiple ordinal responses into a composite measure and then using this composite measure as a dependent or independent variable in subsequent analysis. In fact, the rationale of using multiple items to measure a single underlying concept is that, by appropriately pooling multiple responses, a more precise indicator can be obtained of the underlying value, belief, or attitude. A number of dimension reduction techniques can be used for this purpose. First, one could use a simple additive scale, that is, to treat the ordinal responses as integers and take their arithmetic sum (or mean) as a composite measure of the underlying construct (e.g, DiMaggio, Evans, and Bryson Reference DiMaggio, Evans and Bryson1996). The problem with this approach is twofold. First, for each item, it treats the different response categories as evenly spaced on a latent continuum—a highly questionable assumption that, if violated, may lead to erroneous conclusions (Mouw and Sobel Reference Mouw and Sobel2001). Second, the arithmetic mean as a composite measure weighs all items equally, thus assuming away potential heterogeneity across items in their “discriminatory power.” Oftentimes, some items are more effective than others to elicit different responses among people with different views. In this regard, more effective items should be weighted more heavily in deriving the composite measure. To address the second problem, social scientists have increasingly used modern dimension reduction techniques such as principal component analysis (PCA) and confirmatory factor analysis (e.g., Layman and Carsey Reference Layman and Carsey2002, Inglehart and Welzel Reference Inglehart and Welzel2005, Ansolabehere, Rodden, and Snyder Reference Ansolabehere, Rodden and Snyder2008). Although these techniques automatically assign weights to different items—presumably in a way that accounts for their heterogeneity in discriminatory power, they still take the integer scores as input and thus leave the first problem unaddressed.
A more principled approach to scaling categorical data is item response theory (IRT) (see Baker and Kim Reference Baker and Kim2004 for an introduction). Originally developed in educational testing and psychometrics, IRT treats responses to tests and questionnaires—be they binary, ordinal, or nominal—as resulting from explicitly specified statistical models in which both item and person characteristics are represented as unknown parameters. Over the past two decades, IRT models—especially the binary variant—have been widely used by political scientists to estimate the ideological positions or ideal points of legislators, executives, and judges (e.g., Poole and Rosenthal Reference Poole and Rosenthal1991, Londregan Reference Londregan2000, Bailey and Chang Reference Bailey and Chang2001, Lewis Reference Lewis2001, Martin and Quinn Reference Martin and Quinn2002, Clinton, Jackman, and Rivers Reference Clinton, Jackman and Rivers2004, Bailey Reference Bailey2007, Imai, Lo, and Olmsted Reference Imai, Lo and Olmsted2016). After the ideal points are estimated, subsequent statistical analyses are often conducted to explore their spatial and temporal variations. However, until recently, IRT models were seldom used to analyze public opinion data (for recent applications, see Jessee Reference Jessee2009, Treier and Hillygus Reference Treier and Hillygus2009, Bafumi and Herron Reference Bafumi and Herron2010, Tausanovitch and Warshaw Reference Tausanovitch and Warshaw2013, Caughey and Warshaw Reference Caughey and Warshaw2015, Hill and Tausanovitch Reference Hill and Tausanovitch2015, Jessee Reference Jessee2016). This is partly because the mass public, compared with political elites, are perceived to carry limited ideological constraint across issues (Converse Reference Converse and David1964). Thus it would be imprudent to scale public opinion onto a single dimension by pooling survey responses across different issue domains. Yet within each domain, the number of survey items is often not large enough for precise estimation of individual positions. Therefore, a tension seems to exist between the dimension of the ideological space (i.e., the number of issue domains assumed) and the precision with which ideological positions can be estimated. Nonetheless, if we consider that a major goal in most public opinion studies is to identify the individual and contextual predictors—rather than the exact positions—of policy preferences in different domains, the two-step approach discussed above, be the first step a simple additive scale, PCA, or a conventional IRT model, is analytically wasteful. Since individual-level preferences are neither precisely estimated nor necessarily needed, why not directly link the original item responses to observed covariates in an integrated model?
This paper aims to fill this lacuna. Specifically, I present a class of hierarchical IRT models that can be fruitfully applied to analyze public opinion data. Different from conventional ideal point models, this approach accommodates nonbinary or a mixture of binary, ordinal, and nominal response data. More important, the latent preferences (or ideal points) are not treated as fixed parameters, but modeled as following a normal prior where both the mean and variance may depend on a set of observed covariates. Compared with the two-step approach, the hierarchical IRT approach has several distinct advantages. First, statistically, the embedding of a hierarchical structure into IRT allows us to jointly estimate the effects of individual covariates and item parameters. The joint estimation—via maximizing the marginal likelihood—is computationally fast, statistically efficient, and offers valid asymptotic inference for all parameters. By contrast, the two-step approach, as I will show in a Monte Carlo study, can lead to substantial bias, inefficiency, and inadequate coverage of confidence intervals. Second, practically, the hierarchical IRT approach allows us to directly compare public opinion across surveys covering different sets of items. Oftentimes, as is the case with the ANES, the specific questions asked on a given subject vary from year to year, making it difficult for conventional scaling methods to generate comparable scores over time. Yet with the hierarchical IRT approach, even a limited overlap of items across surveys enables us to identify the latent preferences on a common scale. Third, substantively, as I illustrate with the ANES data, simultaneous modeling of the mean and variance of individual preferences allows us to examine not only how preferences differ among groups, vary across regions, or evolve over time, but also levels, patterns, and trends of attitude polarization and ideological constraint, two recurring themes in public opinion research.
The hierarchical approach proposed in this paper advances item response modeling in political science in three ways. First, it generalizes the existing hierarchical ideal point models (Londregan Reference Londregan2000; Bailey Reference Bailey2001; Lewis Reference Lewis2001; Bafumi et al. Reference Bafumi, Gelman, Park and Kaplan2005; Caughey and Warshaw Reference Caughey and Warshaw2015) to settings where we have nonbinary or a mixture of binary, ordinal, and nominal response data, as is the case with most public opinion studies.Footnote 1 In a recent paper, Caughey and Warshaw (Reference Caughey and Warshaw2015) propose a hierarchical binary IRT model for estimating group-level political opinions. The present approach is similar to that model in that it also augments item response data by “borrowing strength” from units with similar characteristics. Yet, departing from Caughey and Warshaw’s framework, the present approach models individual-level preferences directly (rather than preference data aggregated at the group level), thus allowing us to examine temporal and spatial variations more flexibly. Second, in contrast to almost all existing ideal point models, it allows both the mean and variance of latent preferences to vary according to individual characteristics, thus offering a highly flexible tool for investigating patterns of preference heterogeneity and attitude polarization.Footnote 2 Finally, despite this flexibility, the whole class of models are implemented via the expectation–maximization (EM) algorithm, which is orders of magnitude faster than existing Bayesian implementations of even more restrictive models (e.g., Martin, Quinn, and Park Reference Martin, Quinn and Park2011; see Supplementary Materials D). An open-source R package for fitting the proposed models, hIRT (Zhou Reference Zhou2018a), is available from the Comprehensive R Archive Network (CRAN).
In addition, we note that the hierarchical IRT approach has close precursors and parallels in several other strands of literature. In particular, it is closely related to the Multiple Indicators and Multiple Causes (MIMIC) model, a structural equation model that facilitates estimation of a latent variable by leveraging information from both the observed indicators and covariates (Jöreskog and Goldberger Reference Jöreskog and Goldberger1975; Jackson Reference Jackson1983; Muthén Reference Muthén1984; Armstrong et al. Reference Armstrong, Bakker, Carroll, Hare, Poole and Rosenthal2014). The hierarchical IRT approach can be seen as a variant of the MIMIC model with a single latent variable, where the single latent variable is allowed to be heteroscedastic and its variance modeled as a function of manifest predictors. Moreover, the second level of the hierarchical model is akin to a standard heteroscedastic regression (Cook and Weisberg Reference Cook and Weisberg1983; Aitkin Reference Aitkin1987; Verbyla Reference Verbyla1993), which has recently been used to model the unpredictability of policy preferences (Jacoby Reference Jacoby2006; Lauderdale Reference Lauderdale2010) and economic inequality (Western and Bloome Reference Western and Bloome2009; Zhou Reference Zhou2014).
The rest of the paper is organized as follows. The next section provides a brief review of conventional IRT models for binary, ordinal, and nominal response data, all of which, as we will see, can be augmented with a hierarchical structure that depicts both the mean and variance of individual preferences. These hierarchical models can all be fitted with an extension of the EM algorithm originally proposed by Bock and Aitkin (Reference Bock and Aitkin1981) for fitting conventional binary IRT models. Next, I use Monte Carlo simulation to demonstrate the superiority of the hierarchical approach over a number of two-step methods in statistical performance. I then illustrate the utility of the hierarchical IRT approach with three substantive applications: party polarization, mass polarization, and ideological constraint. The final section discusses possible extensions of the proposed models and concludes.
2 A Class of Hierarchical Item Response Models
2.1 Level I: Conventional IRT Models for Binary, Ordinal, and Nominal Data
To explain IRT models in relation to public opinion data, let us consider an attitude survey where
 $N$
individuals respond to
 $J$
items on a given issue, say abortion. For each of these items, the response format can be binary, ordinal, or nominal. Let us denote by
 $H_{j}$
the number of response categories for question
 $j$
. Assuming that the underlying attitude toward abortion runs along a single spatial dimension, say, from conservative to liberal, we can use a scalar
 $\unicode[STIX]{x1D703}_{i}$
to represent the position of individual
 $i$
. Given these notations, IRT posits that for item
 $j$
, the probability that individual
 $i$
chooses response category
 $h$
is a function of her latent position
 $\unicode[STIX]{x1D703}_{i}$
:
 $$\begin{eqnarray}\text{Pr}(Y_{ij}=h)=P_{jh}(\unicode[STIX]{x1D703}_{i}),\quad h=0,1,2,\ldots ,H_{j}-1.\end{eqnarray}$$
In the parlance of IRT,
 $P_{jh}(\cdot )$
is the item characteristic function for response category
 $h$
of item
 $j$
. Depending on the response format, it can be parameterized in different ways. For binary responses, the item characteristic function typically takes a logit (or probit) form (Lord, Novick, and Birnbaum Reference Lord, Novick and Birnbaum1968):
 $$\begin{eqnarray}P_{jh}(\unicode[STIX]{x1D703}_{i})=\frac{\exp [h(\unicode[STIX]{x1D6FC}_{j}+\unicode[STIX]{x1D6FD}_{j}\unicode[STIX]{x1D703}_{i})]}{1+\exp (\unicode[STIX]{x1D6FC}_{j}+\unicode[STIX]{x1D6FD}_{j}\unicode[STIX]{x1D703}_{i})},\quad h=0,1,\end{eqnarray}$$
where
 $\unicode[STIX]{x1D6FC}_{j}$
,
 $\unicode[STIX]{x1D6FD}_{j}$
, and
 $\unicode[STIX]{x1D703}_{i}$
are called item difficulty parameters, item discrimination parameters, and ability parameters, respectively. In the context of ideal point estimation, items correspond to bills and the ability parameters reflect the ideological positions of legislators. When applied to public opinion data, items correspond to survey questions and the ability parameters reflect the policy preferences of respondents. Note that when
 $\unicode[STIX]{x1D6FD}_{j}=1$
for all items, the above model reduces to the Rasch model (Rasch Reference Rasch1960, Reference Rasch1961).
For ordinal responses, we can apply the logit transformation to the cumulative probabilities
 $\text{Pr}(Y_{ij}\geqslant h)$
, resulting in the graded response model (Samejima Reference Samejima1969):
 $$\begin{eqnarray}\displaystyle P_{jh}(\unicode[STIX]{x1D703}_{i}) & = & \displaystyle \text{Pr}(y_{ij}\geqslant h)-\text{Pr}(y_{ij}\geqslant h+1)\nonumber\\ \displaystyle & = & \displaystyle \frac{\exp (\unicode[STIX]{x1D6FC}_{jh}+\unicode[STIX]{x1D6FD}_{j}\unicode[STIX]{x1D703}_{i})}{1+\exp (\unicode[STIX]{x1D6FC}_{jh}+\unicode[STIX]{x1D6FD}_{j}\unicode[STIX]{x1D703}_{i})}-\frac{\exp (\unicode[STIX]{x1D6FC}_{jh+1}+\unicode[STIX]{x1D6FD}_{j}\unicode[STIX]{x1D703}_{i})}{1+\exp (\unicode[STIX]{x1D6FC}_{jh+1}+\unicode[STIX]{x1D6FD}_{j}\unicode[STIX]{x1D703}_{i})},\quad h=0,1,2,\ldots ,H_{j}-1,\end{eqnarray}$$
where
 $\infty =\unicode[STIX]{x1D6FC}_{j0}>\unicode[STIX]{x1D6FC}_{j1}\ldots >\unicode[STIX]{x1D6FC}_{jH_{j}-1}>\unicode[STIX]{x1D6FC}_{jH_{j}}=-\infty$
. If the ability parameters
 $\unicode[STIX]{x1D703}_{i}$
were known, equation (3) would correspond exactly to the proportional odds cumulative logit model. Alternatively, we could apply the logit transformation to the conditional probabilities between adjacent categories
 $\text{Pr}(Y_{ij}=h|Y_{ij}\in \{h-1,h\})$
, resulting in the generalized partial credit model (Masters Reference Masters1982; Muraki Reference Muraki1992):
 $$\begin{eqnarray}P_{jh}(\unicode[STIX]{x1D703}_{i})=\frac{\exp \{\mathop{\sum }_{s=0}^{h}(\unicode[STIX]{x1D6FC}_{js}+\unicode[STIX]{x1D6FD}_{j}\unicode[STIX]{x1D703}_{i})\}}{\mathop{\sum }_{t=0}^{H_{j}-1}\exp \{\mathop{\sum }_{s=0}^{t}(\unicode[STIX]{x1D6FC}_{js}+\unicode[STIX]{x1D6FD}_{j}\unicode[STIX]{x1D703}_{i})\}},\quad h=0,1,2,\ldots ,H_{j}-1,\end{eqnarray}$$
where
 $\unicode[STIX]{x1D6FC}_{j0}=0$
.Footnote
3
If the ability parameters
 $\unicode[STIX]{x1D703}_{i}$
were known, equation (4) would correspond exactly to the adjacent category logit model (see Agresti Reference Agresti2013). In either the graded response model or the generalized partial credit model, there are
 $H_{j}-1$
distinct item difficulty parameters
 $\unicode[STIX]{x1D6FC}_{jh}$
but only one item discrimination parameter
 $\unicode[STIX]{x1D6FD}_{j}$
for item
 $j$
. This latter fact means that both models require a proportional odds assumption, that is, the effects of the ability parameter
 $\unicode[STIX]{x1D703}_{i}$
are assumed to be homogeneous across the
 $H_{j}-1$
cumulative logits or adjacent logits for the same item. When this assumption is questionable, we could allow the item discrimination parameter
 $\unicode[STIX]{x1D6FD}_{j}$
to be heterogeneous (thus written as
 $\unicode[STIX]{x1D6FD}_{jh}$
) across the
 $H_{j}-1$
cumulative logits or adjacent logits. In the case of cumulative logits, we would obtain an item response equivalent of the partial proportional odds model (Peterson and Harrell Reference Peterson and Harrell1990).Footnote
4
In the case of adjacent logits, we would arrive at the full multinomial logit specification, or, in the parlance of IRT, the nominal categories model (Bock Reference Bock1972):
 $$\begin{eqnarray}P_{jh}(\unicode[STIX]{x1D703}_{i})=\frac{\exp (\unicode[STIX]{x1D6FC}_{jh}+\unicode[STIX]{x1D6FD}_{jh}\unicode[STIX]{x1D703}_{i})}{\mathop{\sum }_{h=0}^{H_{j}-1}\exp (\unicode[STIX]{x1D6FC}_{jh}+\unicode[STIX]{x1D6FD}_{jh}\unicode[STIX]{x1D703}_{i})},\quad h=0,1,2,\ldots ,H_{j}-1.\end{eqnarray}$$
To identify this model, we typically select a reference category, say
 $h=0$
, and constrain the corresponding parameters,
 $\unicode[STIX]{x1D6FC}_{j0}$
and
 $\unicode[STIX]{x1D6FD}_{j0}$
, to be zero. In contrast to the graded response model and the generalized partial credit model, the nominal categories model has
 $H_{j}-1$
distinct item discrimination parameters
 $\unicode[STIX]{x1D6FD}_{jh}$
in addition to
 $H_{j}-1$
item difficulty parameters
 $\unicode[STIX]{x1D6FC}_{jh}$
for item
 $j$
.
2.2 Level II: A Heteroscedastic Regression Model
Although the above IRT models were all developed several decades ago, they have seldom been used in public opinion studies. One obstacle to their application is that when the number of items is small, as is often the case with opinion surveys, the latent preferences
 $\unicode[STIX]{x1D703}_{i}$
cannot be precisely estimated at the individual level. However, as noted earlier, a major goal in most public opinion studies is not to pinpoint the latent preferences of all survey respondents, but to investigate the ways in which preferences differ among groups, vary across regions, or evolve over time. To achieve this goal, it is natural to include a hierarchical structure in which the latent preferences
 $\unicode[STIX]{x1D703}_{i}$
depend on a set of individual and contextual characteristics. Specifically, let us assume that
 $\unicode[STIX]{x1D703}_{i}$
follows a normal prior:
 $$\begin{eqnarray}\displaystyle & \displaystyle \unicode[STIX]{x1D703}_{i}\stackrel{\text{indep}}{{\sim}}\text{N}(\unicode[STIX]{x1D707}_{i},\unicode[STIX]{x1D70E}_{i}^{2}), & \displaystyle\end{eqnarray}$$
 $$\begin{eqnarray}\displaystyle & \displaystyle \unicode[STIX]{x1D707}_{i}=\unicode[STIX]{x1D738}^{T}\tilde{\boldsymbol{x}}_{i} & \displaystyle\end{eqnarray}$$
 $$\begin{eqnarray}\displaystyle & \displaystyle \log \unicode[STIX]{x1D70E}_{i}^{2}=\unicode[STIX]{x1D740}^{T}\tilde{\boldsymbol{z}}_{i} & \displaystyle\end{eqnarray}$$
where
 $\tilde{\boldsymbol{x}}_{i}^{T}=(1,\boldsymbol{x}_{i}^{T})$
,
 $\tilde{\boldsymbol{z}}_{i}^{T}=(1,\boldsymbol{z}_{i}^{T})$
, and
 $\boldsymbol{x}_{i}$
and
 $\boldsymbol{z}_{i}$
are two column vectors of covariates predicting the mean and variance of
 $\unicode[STIX]{x1D703}_{i}$
respectively. In the trivial case where both
 $\boldsymbol{x}_{i}$
and
 $\boldsymbol{z}_{i}$
are empty vectors, the model reduces to the standard random effects IRT model (see Baker and Kim Reference Baker and Kim2004). Of course, we can also make the latent preferences homoscedastic by setting only
 $\boldsymbol{z}_{i}$
to be an empty vector (e.g., Mislevy Reference Mislevy1987, Bailey Reference Bailey2001). However, given that the dispersion of policy preferences can vary widely across time, space, and population subgroups, the heteroscedastic model offers a more realistic way to depict the contours of mass opinion. Moreover, as we will see, simultaneous modeling of the mean and variance of individual preferences enables us to accurately estimate levels and trends of attitude polarization among the mass public.
2.3 Identification Constraints
In its current form, the hierarchical model is not identified. To see this, let us consider the binary logit case (2). Plugging level II into level I, we can write the model as
 $$\begin{eqnarray}\text{logit}\,\text{Pr}(Y_{ij}=1)=\unicode[STIX]{x1D6FC}_{j}+\unicode[STIX]{x1D6FD}_{j}\{\unicode[STIX]{x1D738}^{T}\tilde{\boldsymbol{x}}_{i}+\unicode[STIX]{x1D716}_{i}\exp (\unicode[STIX]{x1D740}^{T}\tilde{\boldsymbol{z}}_{i}/2)\},\end{eqnarray}$$
where
 $\unicode[STIX]{x1D716}_{i}$
is a standard normal error. The above equation implies that the model would be invariant under any of the following transformations:
- Translation:
 $\unicode[STIX]{x1D6FE}_{0}$
(the intercept in equation (7)) increases by a constant
$c$
and all
$\unicode[STIX]{x1D6FC}_{j}$
decrease by
$c\unicode[STIX]{x1D6FD}_{j}$
;
- Scaling:
- $\unicode[STIX]{x1D706}_{0}$
(the intercept in equation (8)) increases by a constant
$c$
,
$\unicode[STIX]{x1D738}$
multiplies by a factor of
$\exp (c/2)$
, and all
$\unicode[STIX]{x1D6FD}_{j}$
deflate by a factor of
$\exp (c/2)$
;
- Reflection:
- $\unicode[STIX]{x1D738}$
and all
$\unicode[STIX]{x1D6FD}_{j}$
switch signs.


Therefore, three identification constraints have to be imposed. To address translation invariance, we can set
 $\sum _{i}\unicode[STIX]{x1D738}^{T}\tilde{\boldsymbol{x}}_{i}=0$
so that the arithmetic mean of the prior means of the latent preferences equals zero. To address scale invariance, we can set
 $\sum _{i}\unicode[STIX]{x1D740}^{T}\tilde{\boldsymbol{z}}_{i}=0$
so that the geometric mean of the prior variances of the latent preferences equals one. Alternatively, if we want to make the variance component comparable across models with different items, we can let the discrimination parameters have a geometric mean of one, i.e.,
 $\prod _{j}\unicode[STIX]{x1D6FD}_{j}=1$
. Finally, to address reflection invariance, we can restrict the sign of one discrimination parameter, say
 $\unicode[STIX]{x1D6FD}_{1}$
, to be positive (or negative).
2.4 Estimation and Inference
In an influential paper, Bock and Aitkin (Reference Bock and Aitkin1981) developed an EM algorithm for estimating the item parameters for a conventional IRT model with binary responses (equation (2)). The basic idea is to treat the ability parameters
 $\unicode[STIX]{x1D703}_{i}$
as missing data and maximize the marginal likelihood for the item parameters
 $\unicode[STIX]{x1D6FC}_{j}$
and
 $\unicode[STIX]{x1D6FD}_{j}$
. Mislevy (Reference Mislevy1987) shows that the same procedure can be extended to fit a hierarchical binary response model where the ability parameter follows a normal prior with constant variance (
 $\unicode[STIX]{x1D70E}_{i}^{2}=1$
) (see also Bailey Reference Bailey2001). In fact, hierarchical IRT models in general—be the response format binary, ordinal, or nominal, and be the ability parameter homoscedastic or heteroscedastic—can be fitted in the same framework. In this framework, all of the item parameters
 $\unicode[STIX]{x1D736}_{\boldsymbol{j}}$
and
 $\unicode[STIX]{x1D6FD}_{j}$
and hierarchical parameters
 $\unicode[STIX]{x1D738}$
and
 $\unicode[STIX]{x1D740}$
are estimated via maximizing the marginal likelihood. Their asymptotic standard errors can be derived from either the Hessian matrix or the outer product of gradients of the log marginal likelihood. As a byproduct of the EM algorithm, empirical Bayes estimates of individual-specific latent preferences can be easily constructed. The details of estimation and inference are shown in Supplementary Materials A, B, and C.
The same class of hierarchical IRT models can also be fitted using a full Bayesian approach, in which all of the level I and level II parameters are given priors and estimated as posterior draws via Markov Chain Monte Carlo (MCMC) simulation. In fact, the full Bayesian approach has already been implemented for the simplest case—binary response data with homoscedastic preferences (Martin, Quinn, and Park Reference Martin, Quinn and Park2011). In practice, however, the EM algorithm described in the Supplementary Material is computationally much more efficient. For example, for fairly large data sets (
 $N=20\text{,}000{-}40\text{,}000$
;
 $J=10{-}40$
), the runtime of the EM algorithm on a personal computer rarely exceeds a minute, whereas the full Bayesian implementation can take many hours if not days.Footnote
5
Supplementary Material D provides a systematic comparison in computation time between the EM algorithm and MCMC simulation for relatively small sample sizes (
 $N=500{-}10\text{,}000$
).
3 Comparison with Two-step Methods: Monte Carlo Evidence
As noted earlier, empirical studies of public opinion in recent decades have predominantly relied on a two-step approach, i.e., first combine the multiple ordinal responses into a composite measure and then use that composite measure as a dependent variable in subsequent analysis. In theory, we know that this approach is statistically inefficient as it does not model the data generating process directly. For practitioners, however, the question is whether the cost of the two-step approach is so high as to justify the use of more principled methods. Below I use a Monte Carlo simulation to explore and demonstrate the potential costs of the two-step approach.Footnote 6
First, let us consider a simple data generating process in which the latent preferences
 $\unicode[STIX]{x1D703}_{i}$
follow a normal linear model with a constant variance:
 $$\begin{eqnarray}\unicode[STIX]{x1D703}_{i}\stackrel{\text{indep}}{{\sim}}\text{N}(\unicode[STIX]{x1D6FE}_{0}+\unicode[STIX]{x1D6FE}_{1}x_{i},\unicode[STIX]{x1D70E}^{2}),\end{eqnarray}$$
where
 $\unicode[STIX]{x1D6FE}_{1}=1$
and
 $x_{i}$
is an observed covariate following a standard normal distribution. For this setup, the level II of the hierarchical IRT model is correctly specified. To explore its robustness to potential violations of the normal prior, let us also consider an alternative data generating process where the latent preferences
 $\unicode[STIX]{x1D703}_{i}$
follow a uniform distribution with the same mean
 $\unicode[STIX]{x1D6FE}_{0}+\unicode[STIX]{x1D6FE}_{1}x_{i}$
and variance
 $\unicode[STIX]{x1D70E}^{2}$
:
 $$\begin{eqnarray}\unicode[STIX]{x1D703}_{i}\stackrel{\text{indep}}{{\sim}}\text{Unif}(\unicode[STIX]{x1D6FE}_{0}+\unicode[STIX]{x1D6FE}_{1}x_{i}-\sqrt{3}\unicode[STIX]{x1D70E},\unicode[STIX]{x1D6FE}_{0}+\unicode[STIX]{x1D6FE}_{1}x_{i}+\sqrt{3}\unicode[STIX]{x1D70E}).\end{eqnarray}$$
For identification purposes, I assume
 $\unicode[STIX]{x1D6FE}_{0}=0$
and
 $\unicode[STIX]{x1D70E}^{2}=1$
. Next, I generate
 $J$
items and for each item
 $j$
, the number of response categories
 $H_{j}$
is randomly drawn from the set
 $\{2,3,4,5,6,7\}$
, and the item discrimination parameter follows a log-uniform distribution over the interval
 $(-1,1)$
Footnote
7
:
 $$\begin{eqnarray}\displaystyle & \displaystyle H_{j}\stackrel{\text{indep}}{{\sim}}\text{Unif}\{2,3,4,5,6,7\}, & \displaystyle \nonumber\\ \displaystyle & \displaystyle \log \unicode[STIX]{x1D6FD}_{j}\stackrel{\text{indep}}{{\sim}}\text{Unif}(-1,1). & \displaystyle \nonumber\end{eqnarray}$$
The item difficulty parameters for item
 $j$
,
 $\{\unicode[STIX]{x1D6FC}_{j1},\unicode[STIX]{x1D6FC}_{j2},\ldots ,\unicode[STIX]{x1D6FC}_{jH_{j-1}}\!\}$
, are then generated from the order statistics of
 $(H_{j}-1)$
independent draws from the uniform distribution over the interval
 $(-H_{j}+1,H_{j}-1)$
. Finally, with the item parameters in hand, I simulate the item response data
 $y_{ij}$
according to the graded response model (3).
In this simulation, I fix the sample size
 $N$
at 2500 but let the number of items
 $J$
take one of five values: 5, 10, 20, 40, and 80.Footnote
8
In each of the five settings, I generate 1000 random samples of the latent preferences
 $\unicode[STIX]{x1D703}_{i}$
, item parameters
 $\unicode[STIX]{x1D736}_{\boldsymbol{j}}$
and
 $\unicode[STIX]{x1D6FD}_{j}$
, and response data
 $y_{ij}$
using the procedures described above.Footnote
9
Then, for each sample, I estimate the effect of
 $x_{i}$
on the latent preference
 $\unicode[STIX]{x1D703}_{i}$
using five methods:
(1) For each item
$j$
, rescale the response data
$y_{ij}$
so that they range from 0 to 1, use their simple average across items
$\bar{y_{i}}$
as a composite measure of preference, and run a simple linear regression of
$\bar{y_{i}}$
on
$x_{i}$
. (Simple Average
$+$
Regression)(2) Conduct a PCA of the response data
$y_{ij}$
(using the correlation matrix), extract the first principal component
$PC_{1i}$
as a composite measure of preference, and run a simple linear regression of
$PC_{1i}$
on
$x_{i}$
. (PCA
$+$
Regression)(3) For each item
$j$
, dichotomize the response data using the sample mean of
$y_{ij}$
as the cutoff point, run a conventional binary IRT model on the dichotomized data, extract the latent preference estimates
$\hat{\unicode[STIX]{x1D703}_{i}}$
, and run a simple linear regression of
$\hat{\unicode[STIX]{x1D703}_{i}}$
on
$x_{i}$
. (Binary IRT
$+$
Regression)(4) For each item
$j$
, run a conventional graded response model, extract the latent preference estimates
$\hat{\unicode[STIX]{x1D703}_{i}}$
, and run a simple linear regression of
$\hat{\unicode[STIX]{x1D703}_{i}}$
on
$x_{i}$
. (Grade Response Model
$+$
Regression)(5) Run a hierarchical graded response model. (Hierarchical Grade Response Model).


To make the estimated coefficient of
 $x_{i}$
comparable across the five methods, we need to impose a common scale constraint. As mentioned earlier, we assume the error variance
 $\unicode[STIX]{x1D70E}^{2}=1$
for the purpose of identification. So the variance of the true latent preferences
 $\mathbb{V}[\unicode[STIX]{x1D703}_{i}]=\unicode[STIX]{x1D6FE}_{1}^{2}\mathbb{V}[x_{i}]+1=2$
. Thus, in the four two-step methods, I rescale the latent preference estimates
 $\hat{\unicode[STIX]{x1D703}_{i}}$
such that
 $\mathbb{V}[\hat{\unicode[STIX]{x1D703}_{i}}]=2$
. Then, with the 1000 random samples, I evaluate the performance of the five methods using four criteria: (a) bias:
 $\text{E}(\hat{\unicode[STIX]{x1D6FE}_{1}}-\unicode[STIX]{x1D6FE}_{1})$
; (b) root mean squared error (RMSE):
 $\sqrt{\text{E}(\hat{\unicode[STIX]{x1D6FE}_{1}}-\unicode[STIX]{x1D6FE}_{1})^{2}}$
; (c) coverage of the 95% asymptotic confidence interval of
 $\hat{\unicode[STIX]{x1D6FE}_{1}}$
; and (d) average correlation between the true preferences
 $\unicode[STIX]{x1D703}_{i}$
and the constructed/estimated preferences (
 $\bar{y_{i}}$
for Simple Average,
 $PC_{1i}$
for PCA, or
 $\hat{\unicode[STIX]{x1D703}_{i}}$
for IRT models).
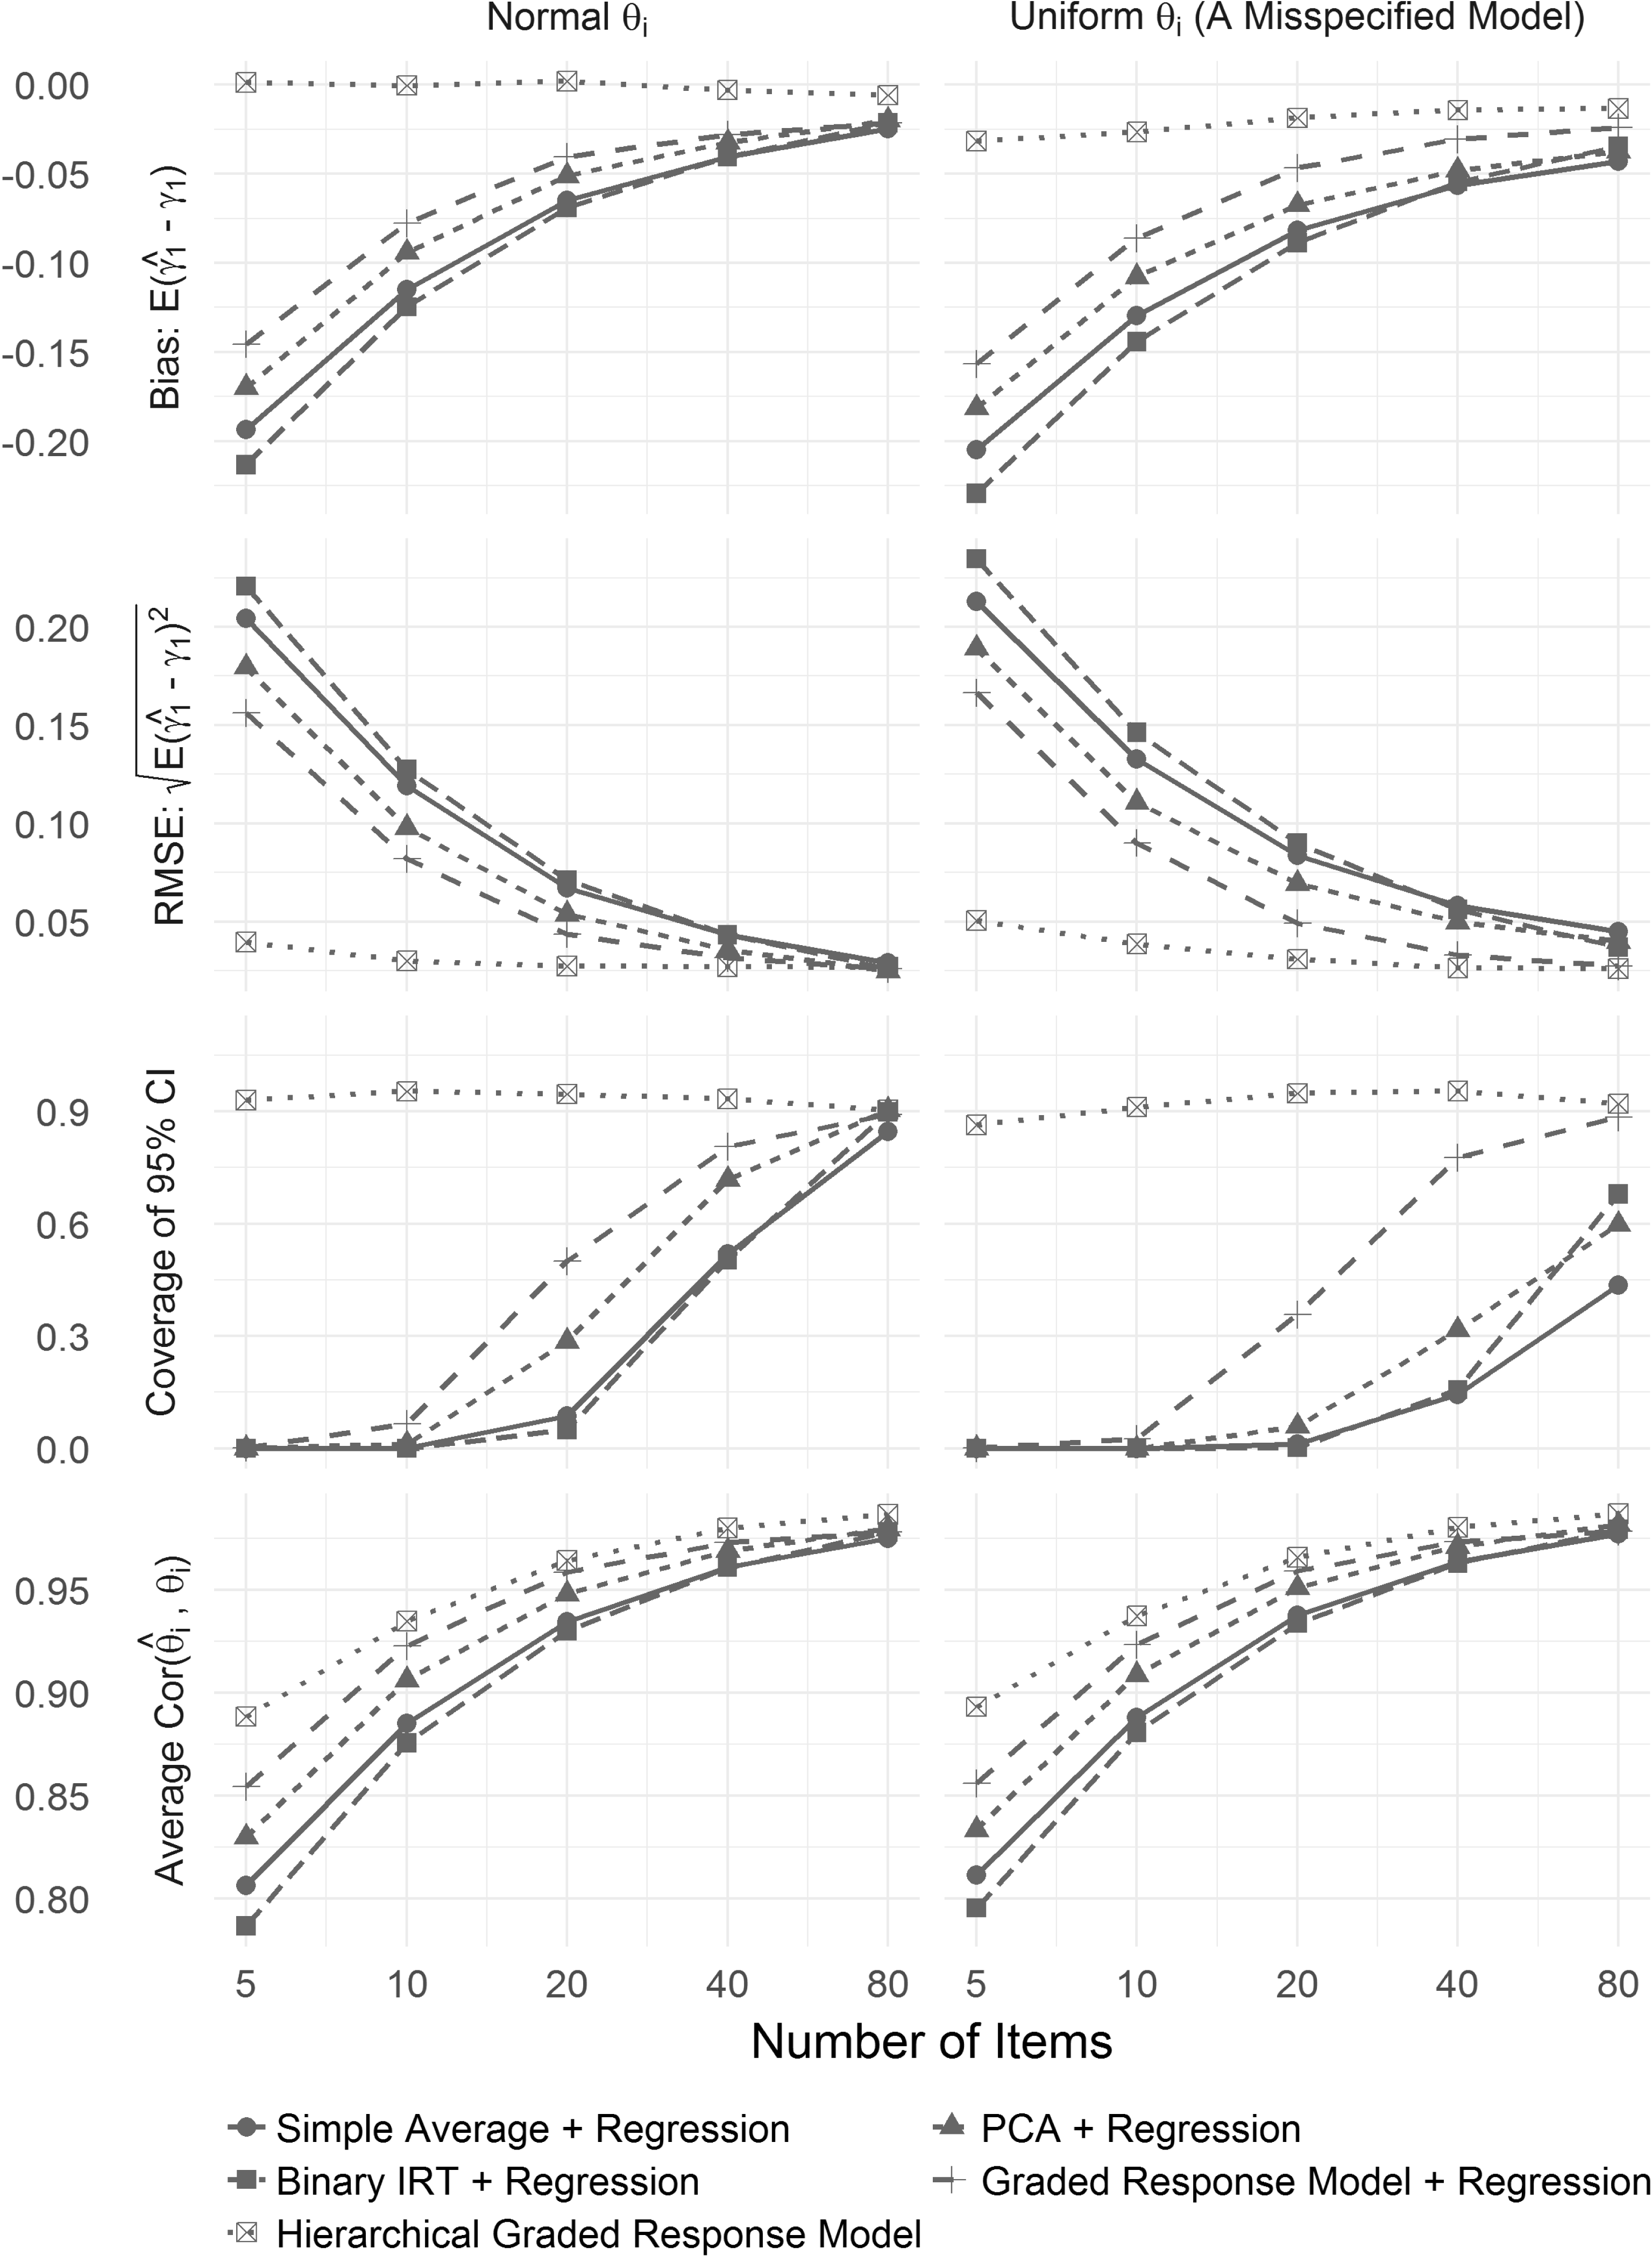
Comparison in statistical performance among five methods: (a) Simple Average
 $+$
Regression, (b) Principal Component Analysis (PCA)
 $+$
Regression, (c) Binary IRT
 $+$
Regression, (d) Graded Response Model
 $+$
Regression, and (e) Hierarchical Graded Response Model. Note: The binary IRT model was fitted by the function binIRT in the R Package emIRT (Imai, Lo, and Olmsted Reference Imai, Lo and Olmsted2016). The graded response model and hierarchical graded response model were both fitted using the function hgrm in the R package hIRT accompanied with this paper.

The results are summarized in Figure 1, where the two columns correspond to the two data generating processes, the four rows correspond to the four indicators of performance, the horizontal axis denotes the number of items, and the five methods are represented by different point shapes and line types. First of all, we can see that by all four criteria and regardless of the number of items, the hierarchical graded response model always outperforms all of the two-step methods. This is true for either the correctly specified model (left panel) or the misspecified model where the latent preferences follow a uniform distribution (right panel). This is not altogether surprising given that the response data
 $y_{ij}$
still follow the graded response model (3) and we have followed the likelihood principle to estimate the effects of
 $x_{i}$
. However, contrary to what one might expect, the cost of the two-step approach can be substantial unless the number of items is very large. For example, in a typical wave of the ANES, about 10–15 items are used to tap the respondent’s economic attitudes (see Section 4). Our results suggest that in this case, all of the two-step methods suffer from a downward bias of about 0.10, or 10% of the true effect size. This downward bias occurs because in the two-step approach, when estimates of the latent preferences
 $\unicode[STIX]{x1D703}_{i}$
are fed into subsequent analyses, estimation uncertainty becomes measurement error. And because estimates of
 $\hat{\unicode[STIX]{x1D703}_{i}}$
are standardized such that
 $\mathbb{V}[\hat{\unicode[STIX]{x1D703}_{i}}]=\mathbb{V}[\unicode[STIX]{x1D703}_{i}]=2$
(to ensure comparability across methods), noisy estimates of
 $\unicode[STIX]{x1D703}_{i}$
tend to depress the regression coefficients of its predictors. This downward bias also means that the proportion of the variation in
 $\unicode[STIX]{x1D703}_{i}$
that can be explained by the covariate
 $x_{i}$
is underestimated. Such a bias leads to an RMSE of similar magnitude (far higher than that from the hierarchical model), and virtually zero coverage of the 95% confidence intervals. When the number of items increases, the amount of bias tends to decrease. This is because a larger number of items enable us to estimate the latent preferences more precisely, and more precise estimates of the latent preferences necessarily allow for more accurate assessments of the effect of the covariate. Yet, even when the number of items reaches an unrealistically high of 40, the two-step methods still suffer a nontrivial amount of bias. This bias in turn translates into relatively large RMSEs and inadequate coverage of the confidence intervals.
The last panel shows the average correlation between the true preferences
 $\unicode[STIX]{x1D703}_{i}$
and the constructed/estimated preferences from the five methods. On the one hand, it is easy to notice that the hierarchical graded response model always yields the best estimates of the latent preferences (in terms of their correlation with the true values). On the other hand, we can see that all of the two-step methods perform reasonably well in constructing/estimating the latent preferences, especially when the number of items is relatively large. For instance, when the number of items reaches 20, the first principal component of the raw responses (treated as interval variables) exhibits an average correlation of 0.95 with the true latent preferences. However, as we can see from the other three panels, when these first principal components are used as dependent variables in the second-step regressions, the estimated effects of the covariate
 $x_{i}$
are substantially biased, highly inefficient, and accompanied with grossly misleading confidence intervals. Thus, even a composite measure that has a correlation of 0.95 with the true values may not salvage the two-step approach from its statistical costs. Paradoxically, accurate estimation of the hierarchical parameter
 $\unicode[STIX]{x1D6FE}_{1}$
does not hinge on precise reconstruction of the latent preferences. For example, when there are only five items, even the correctly specified hierarchical graded response model cannot pinpoint the latent preferences
 $\unicode[STIX]{x1D703}_{i}$
precisely, as the average correlation between the empirical Bayes estimates
 $\hat{\unicode[STIX]{x1D703}_{i}}$
and
 $\unicode[STIX]{x1D703}_{i}$
does not even reach 0.9. Yet this does not prevent the hierarchical parameter
 $\unicode[STIX]{x1D6FE}_{1}$
from being reliably estimated. In sum, good measurements cannot replace hierarchical modeling, but hierarchical modeling can compensate for poor measurements.
4 Applications to ANES Data
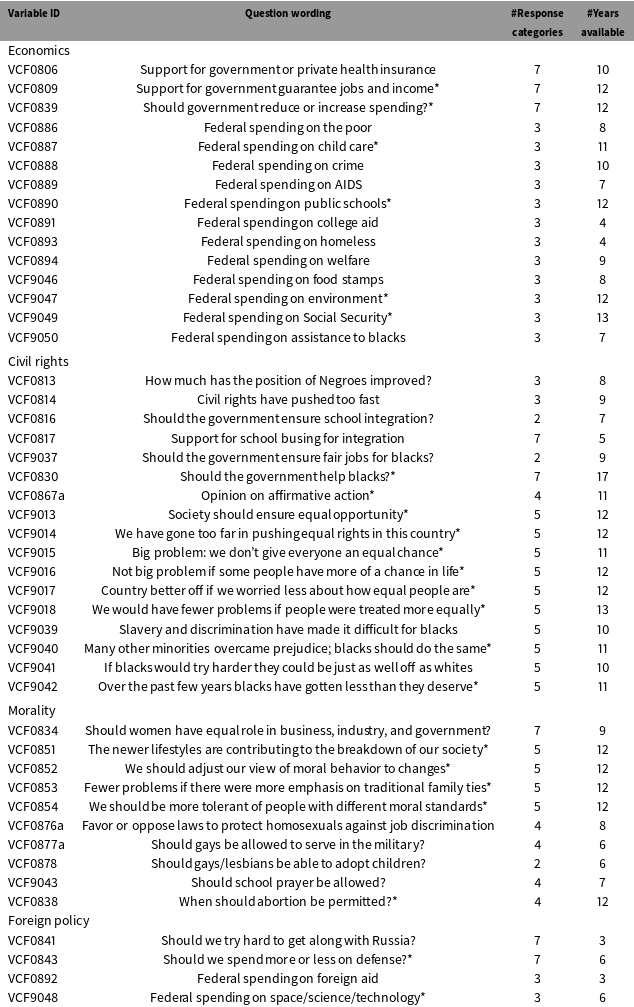
ANES survey items in four issue domains.

Note: Items with an asterisk are used for PCA in the example of party polarization.
In this section, I illustrate the hierarchical IRT approach with the ANES time series cumulative data file, 1948–2016. Following Baldassarri and Gelman (Reference Baldassarri and Gelman2008), I focus on the period from 1972 onward, include attitude questions that were asked at least three times, and classify them into four issue domains: economics, civil rights, morality, and foreign policy. This procedure yields a total of 46 items, 15 on economics, 17 on civil rights, 10 on morality, and 4 on foreign policy. Further, in domain-specific analysis, I include only years in which at least three items were administered in the corresponding domain. As a result, my analyses of the four issue domains span slightly different periods: 1984–2016 for economic issues, 1972–2016 for civil rights issues, 1986–2016 for moral issues, and 1984–2008 for foreign policy issues. The details of the 46 items (variable ID, question wording, number of response categories, number of years available) are shown in Table 1.Footnote 10 It is easy to see that our data are highly unbalanced for all of the four domains, as many (if not most) questions have not been asked consistently over the years. This inconsistency would pose a serious challenge for conventional scaling methods, such as PCA, to produce comparable scores across years. As a result, in many empirical applications, researchers have focused on a set of common items that were asked consistently across years (e.g., Layman and Carsey Reference Layman and Carsey2002). By contrast, the hierarchical IRT approach does not require balanced data for identification. Since item parameters are assumed to be fixed (i.e., no differential item functioning over time), overlapping of items across years allows us to bridge data over time and identify the means and variances of latent preferences on a common scale.Footnote 11 In this application, since all of the attitude questions come with Likert-type responses, I use the graded response specification. Below, I use the hierarchical graded response model to demonstrate patterns and trends in three macro-level outcomes: (a) party polarization, (b) mass polarization, and (c) ideological constraint.
4.1 Party Polarization
A large body of research has reported a surge of party polarization in the US over recent decades. Democratic and Republican party elites, as suggested by Congressional roll call votes, have grown increasingly separated along a single ideological dimension (e.g., McCarty, Poole, and Rosenthal Reference McCarty, Poole and Rosenthal2016). Elite polarization has also generated a mass response. In the electorate, self-identified Democrats and Republicans have diverged in all of the three domestic issue domains: economics, civil rights, and morality (Layman and Carsey Reference Layman and Carsey2002; Layman, Carsey, and Horowitz Reference Layman, Carsey and Horowitz2006; Baldassarri and Gelman Reference Baldassarri and Gelman2008). Moreover, Layman and Carsey (Reference Layman and Carsey2002) report that party polarization in the electorate has been confined to “party identifiers who are aware of party polarization,” a finding that comports with Zaller’s (Reference Zaller1992) argument that only politically aware citizens pay attention to elite discourse, receive political cues, and selectively internalize political messages. Given that political awareness correlates strongly with education (Delli Carpini and Keeter Reference Delli Carpini and Keeter1996), we should also expect party polarization to be more salient among highly educated citizens than others.
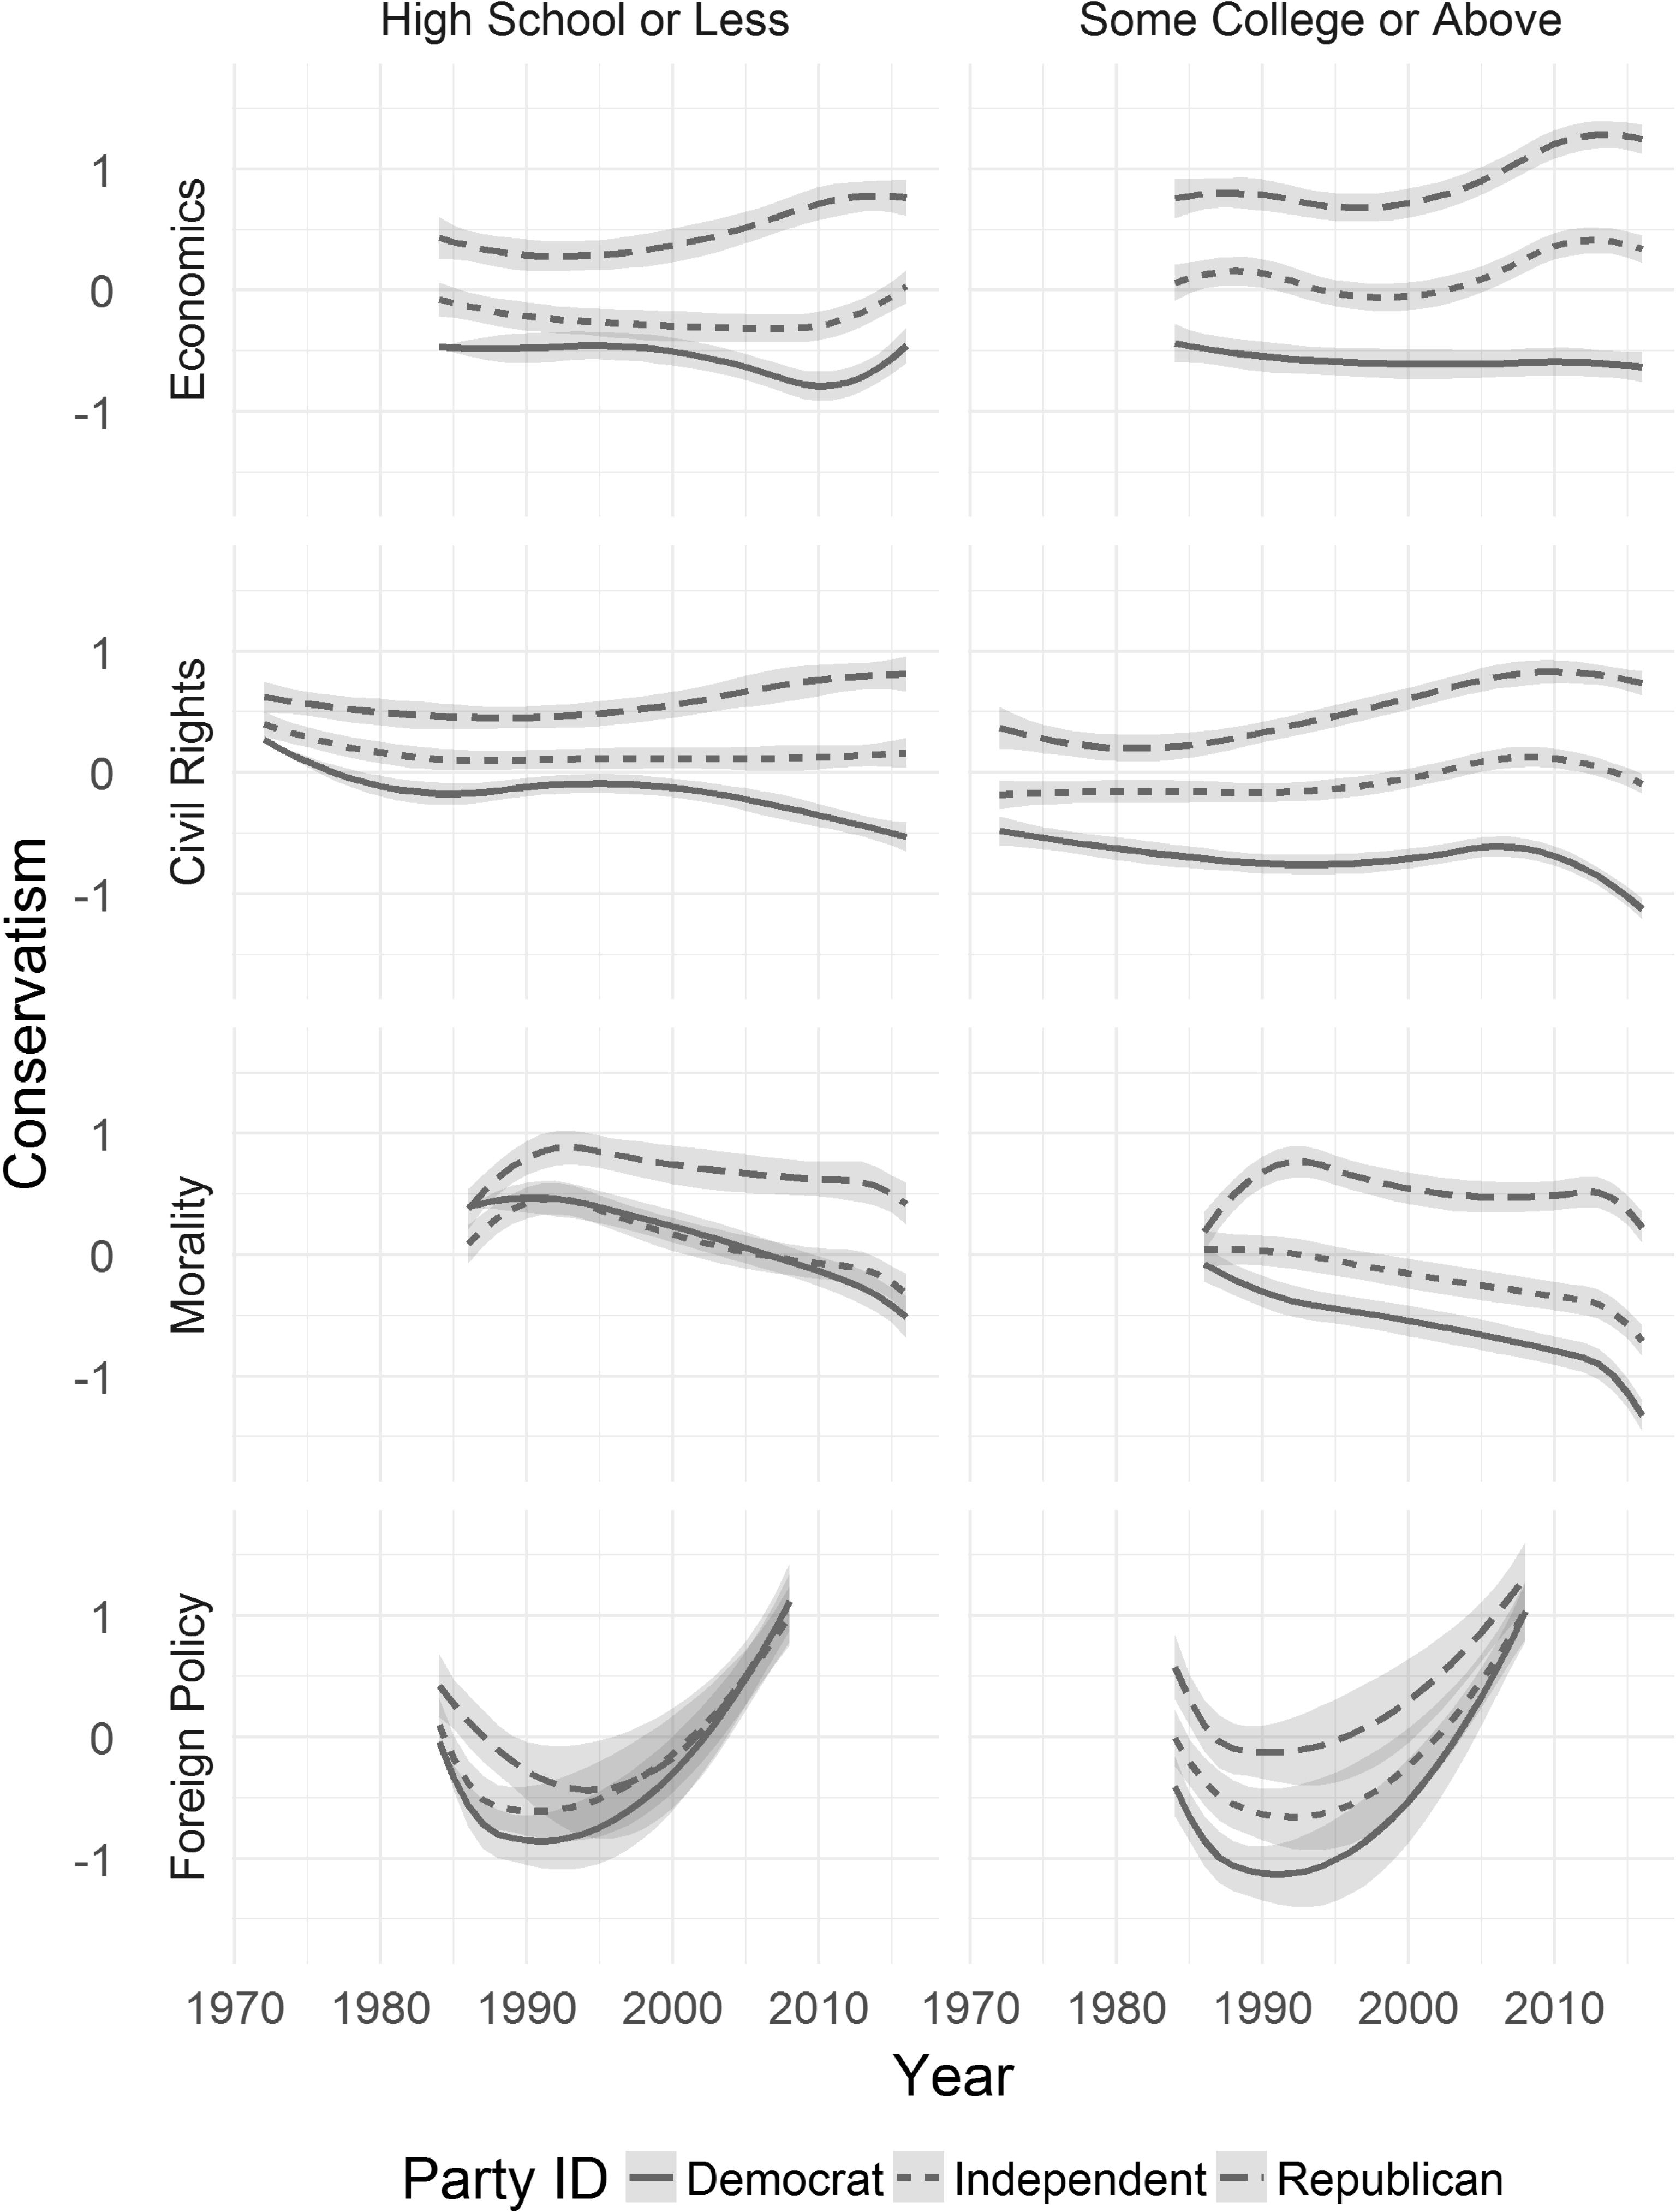
Trends in policy conservatism in four issue domains, by education and party identification. Note: Ribbons represent 95% asymptotic confidence intervals.

Given these considerations, let us now examine trends in mass opinion in each of the four issue domains, with party identification (Democrat, Republican, independent), education (high school or less, some college or above), year spline terms, and their full interactions as predictors in the mean equation (7). To obtain smooth estimates of temporal trends, we use quadratic splines of survey year with four degrees of freedom.Footnote
12
Alternatively, if we are interested more in year-to-year fluctuations of public opinion than in medium- and long-term trends, we could use year dummies instead of splines. Since our primary interest here is in the mean structure, we assume a constant variance by setting
 $\tilde{\boldsymbol{z}}_{i}=1$
.Footnote
13
Fitted values of policy conservatism (
 $\hat{\unicode[STIX]{x1D738}}^{T}\tilde{\boldsymbol{x}}_{i}$
), along with their 95% confidence intervals, are shown in Figure 2.Footnote
14
We can draw several observations from them. First, in all four issue domains and throughout the entire period, partisan differences are more pronounced among college-educated individuals than among individuals with only a high school diploma or less, reflecting a significant role of education in strengthening issue partisanship. Second, echoing previous studies, we find a marked growth of partisan differences in all of the three domestic issue domains. The divergence is especially salient for moral issues, on which Democrats and Republicans barely disagreed back in the mid 1980s but have become increasingly divided over the past three decades. Moreover, contrary to what one might expect, party polarization has not been confined to the college-educated group. Even among individuals with no more than a high school diploma, self-identified Democrats and Republicans have decidedly diverged in their attitudes toward economic, civil rights, and moral issues.
Figure 2 also indicates the timing and sources of party polarization for different issue domains. Specifically, party divergence in economic issues results primarily from Republicans and independents moving to the right since the early 2000s, whereas party divergence in moral issues reflects more of Democrats and independents moving to the left starting from the late 1980s. The phrase “party polarization” is particularly apt for trends in civil rights issues, as they are characterized simultaneously by Democrats drifting to the left and Republicans drifting to the right. Finally, trends in foreign policy preferences are highly bipartisan, as Democrats, Republicans, and independents have moved in tandem, apparently toward a consensus, over the entire period (becoming more dovish in the late 1980s and more hawkish thereafter). In sum, our results are largely consistent with previous findings on party polarization in the American electorate. However, as we have seen, the hierarchical model has enabled us to see a more nuanced picture of the patterns, sources, and timing of party polarization in different issue domains.
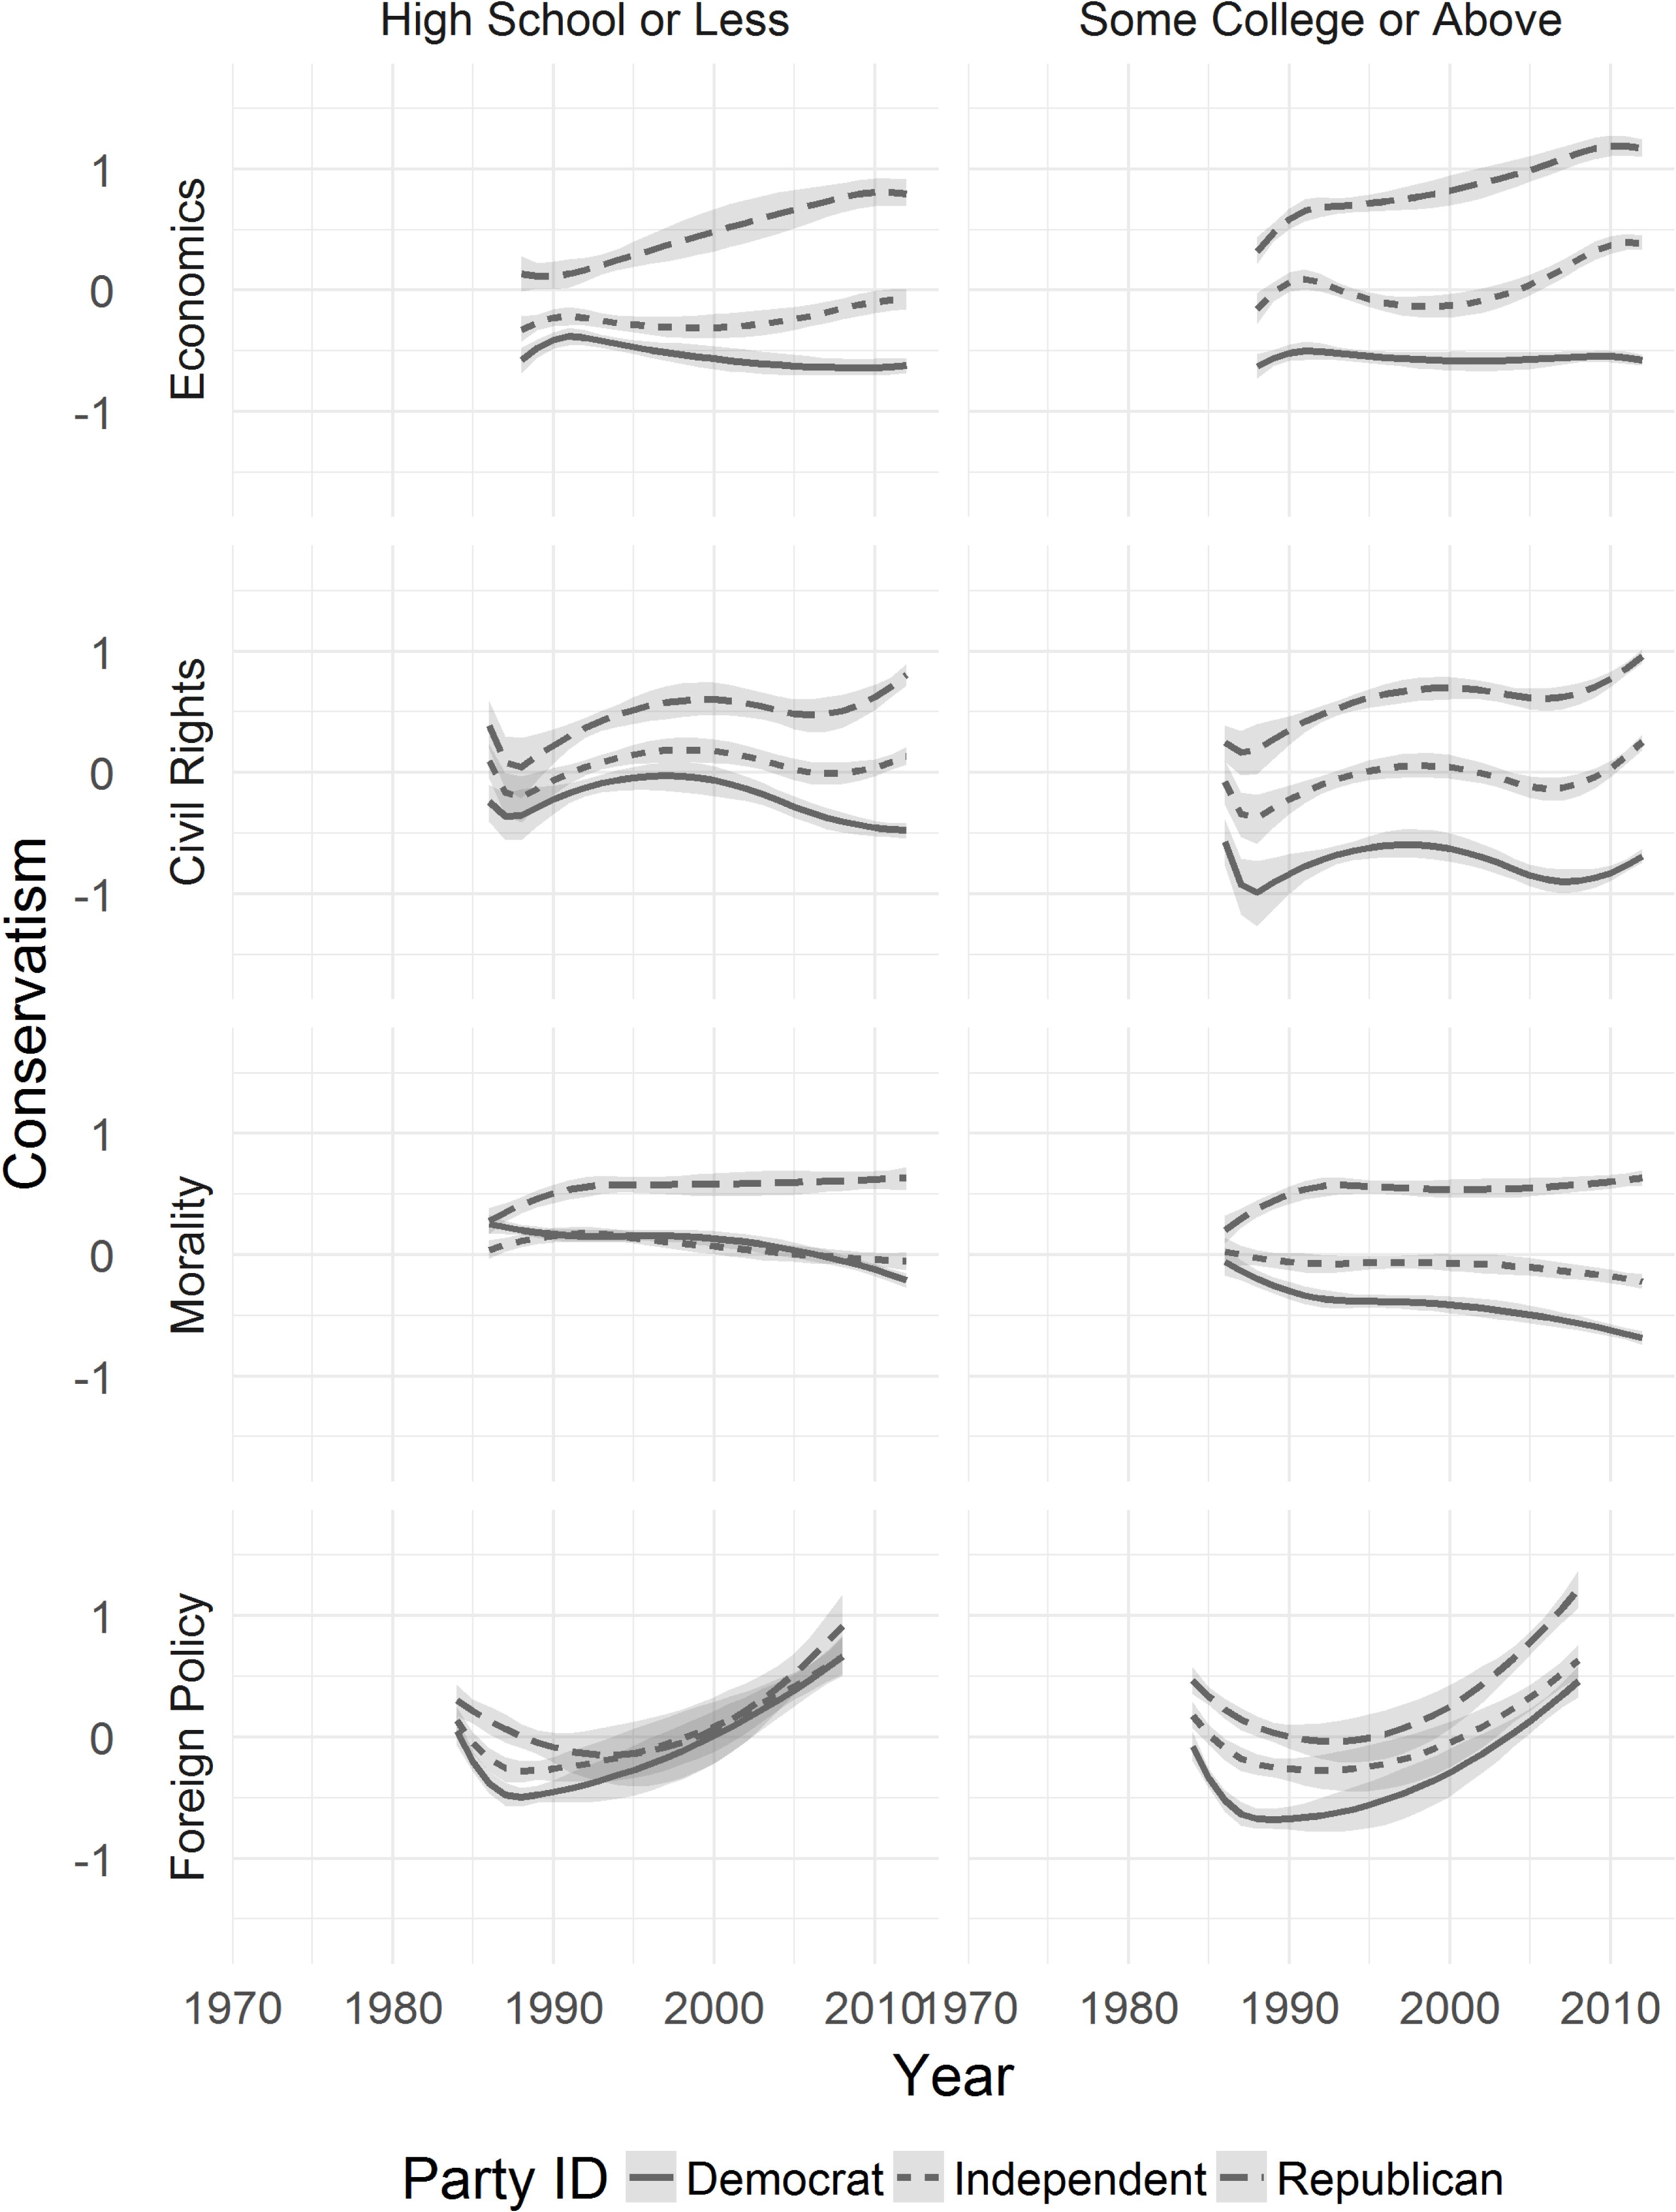
Trends in policy conservatism in four issue domains, by education and party identification, with policy preferences measured using PCA. Note: Ribbons represent 95% bootstrapped confidence intervals.

Let us now compare the above results with those from a two-step method. As mentioned earlier, since the ANES did not ask the same set of questions in each year (for any of the four domains), it would be hard for conventional scaling methods to generate comparable scores across all survey years. Fortunately, in the ANES, there are some questions that have been asked relatively consistently over time. Thus, for each issue domain, I conduct a PCA on a set of common items, as marked with an asterisk in Table 1, and accordingly restrict my analysis to those years in which these items appeared. Then, I treat the first principal component as a measure of latent preference and regress it on party identification, education, year spline terms, and their full interactions. As in the Monte Carlo simulation, to make results comparable, the dependent variable in this regression is rescaled such that its total variance equals that of
 $\unicode[STIX]{x1D703}_{i}$
in the fitted hierarchical IRT model. The results are shown in Figure 3. In general, this two-step method produces quite similar patterns of party polarization in the economic, civil rights, and moral domains. Nonetheless, a few differences are noteworthy. First, in the civil rights domain, the hierarchical IRT model offers comparable estimates of preferences all the way back to 1972, whereas the two-step method only allows us to track trends from 1984 onward due to a lack of common items. Second, in a few instances, the estimated variation in preference appears to be smaller under the two-step method than under the hierarchical model. For example, in the moral domain, the hierarchical IRT model suggests that independents have shifted decidedly to the left, but the two-step method suggests that they have barely moved. This difference echoes our simulation result that the estimated effects of covariates tend to be downwardly biased in two-step methods. Finally, in the foreign policy domain, the hierarchical IRT model suggests a growing bipartisan consensus for both educational groups, whereas the two-step method suggests a persistent ideological gap between Democrats and Republicans in the college-educated group.
4.2 Mass Polarization
It might be supposed that the rise of party polarization reflects growing polarization in the broader society. This is not necessarily true, however, as the divergence in issue attitudes between Democrats and Republicans may have resulted simply from a realignment of party labels in the electorate (e.g., Fiorina, Abrams, and Pope Reference Fiorina, Abrams and Pope2006, Baldassarri and Gelman Reference Baldassarri and Gelman2008, Hill and Tausanovitch Reference Hill and Tausanovitch2015). As party elites have moved increasingly toward the ideological poles, voters may have become simply better at sorting themselves into different camps. In this case, the rise of party polarization would be no more than a tightened alignment of party affiliation with policy preferences. On the other hand, increased polarization among party elites may have caused real changes in issue attitudes, especially among voters who are deeply attached to one of the major parties (Carsey and Layman Reference Carsey and Layman2006). If Democrats and Republicans in the electorate have indeed followed their elite cues and adjusted their policy preferences, the rise of party polarization should have translated into growing levels of mass polarization.
Several previous studies have examined long-term trends in mass polarization, especially in moral issues. Using social attitude items from the ANES and the General Social Survey (GSS), DiMaggio, Evans, and Bryson (Reference DiMaggio, Evans and Bryson1996) find little evidence of increased polarization from the early 1970s to the early 1990s, with the issue of abortion being an exception (see Evans Reference Evans2003 for an update). A similar conclusion has been reached by Fiorina, Abrams, and Pope (Reference Fiorina, Abrams and Pope2006, Reference Fiorina, Abrams and Pope2008), who contend that the narrative of “culture war” (i.e., mass polarization in moral issues) is largely a myth, even for such hot-button issues as abortion and homosexuality. However, in gauging polarization, these studies either analyzed different items separately or constructed composite scores by treating ordinal or nominal scales as interval data. Given substantial measurement error associated with single items (e.g., Ansolabehere, Rodden, and Snyder Reference Ansolabehere, Rodden and Snyder2008), the former approach is obviously statistically inefficient. The latter approach, as mentioned at the beginning, hinges on two highly questionable assumptions, which could have easily contaminated previous findings (see Mouw and Sobel’s (Reference Mouw and Sobel2001) critique on DiMaggio, Evans, and Bryson (Reference DiMaggio, Evans and Bryson1996)). As a result of these methodological issues, the existence and extent of public polarization continues to be debated (e.g., Abramowitz and Saunders Reference Abramowitz and Saunders2008; Abramowitz Reference Abramowitz2010; Fiorina and Abrams Reference Fiorina and Abrams2012; Hill and Tausanovitch Reference Hill and Tausanovitch2015).
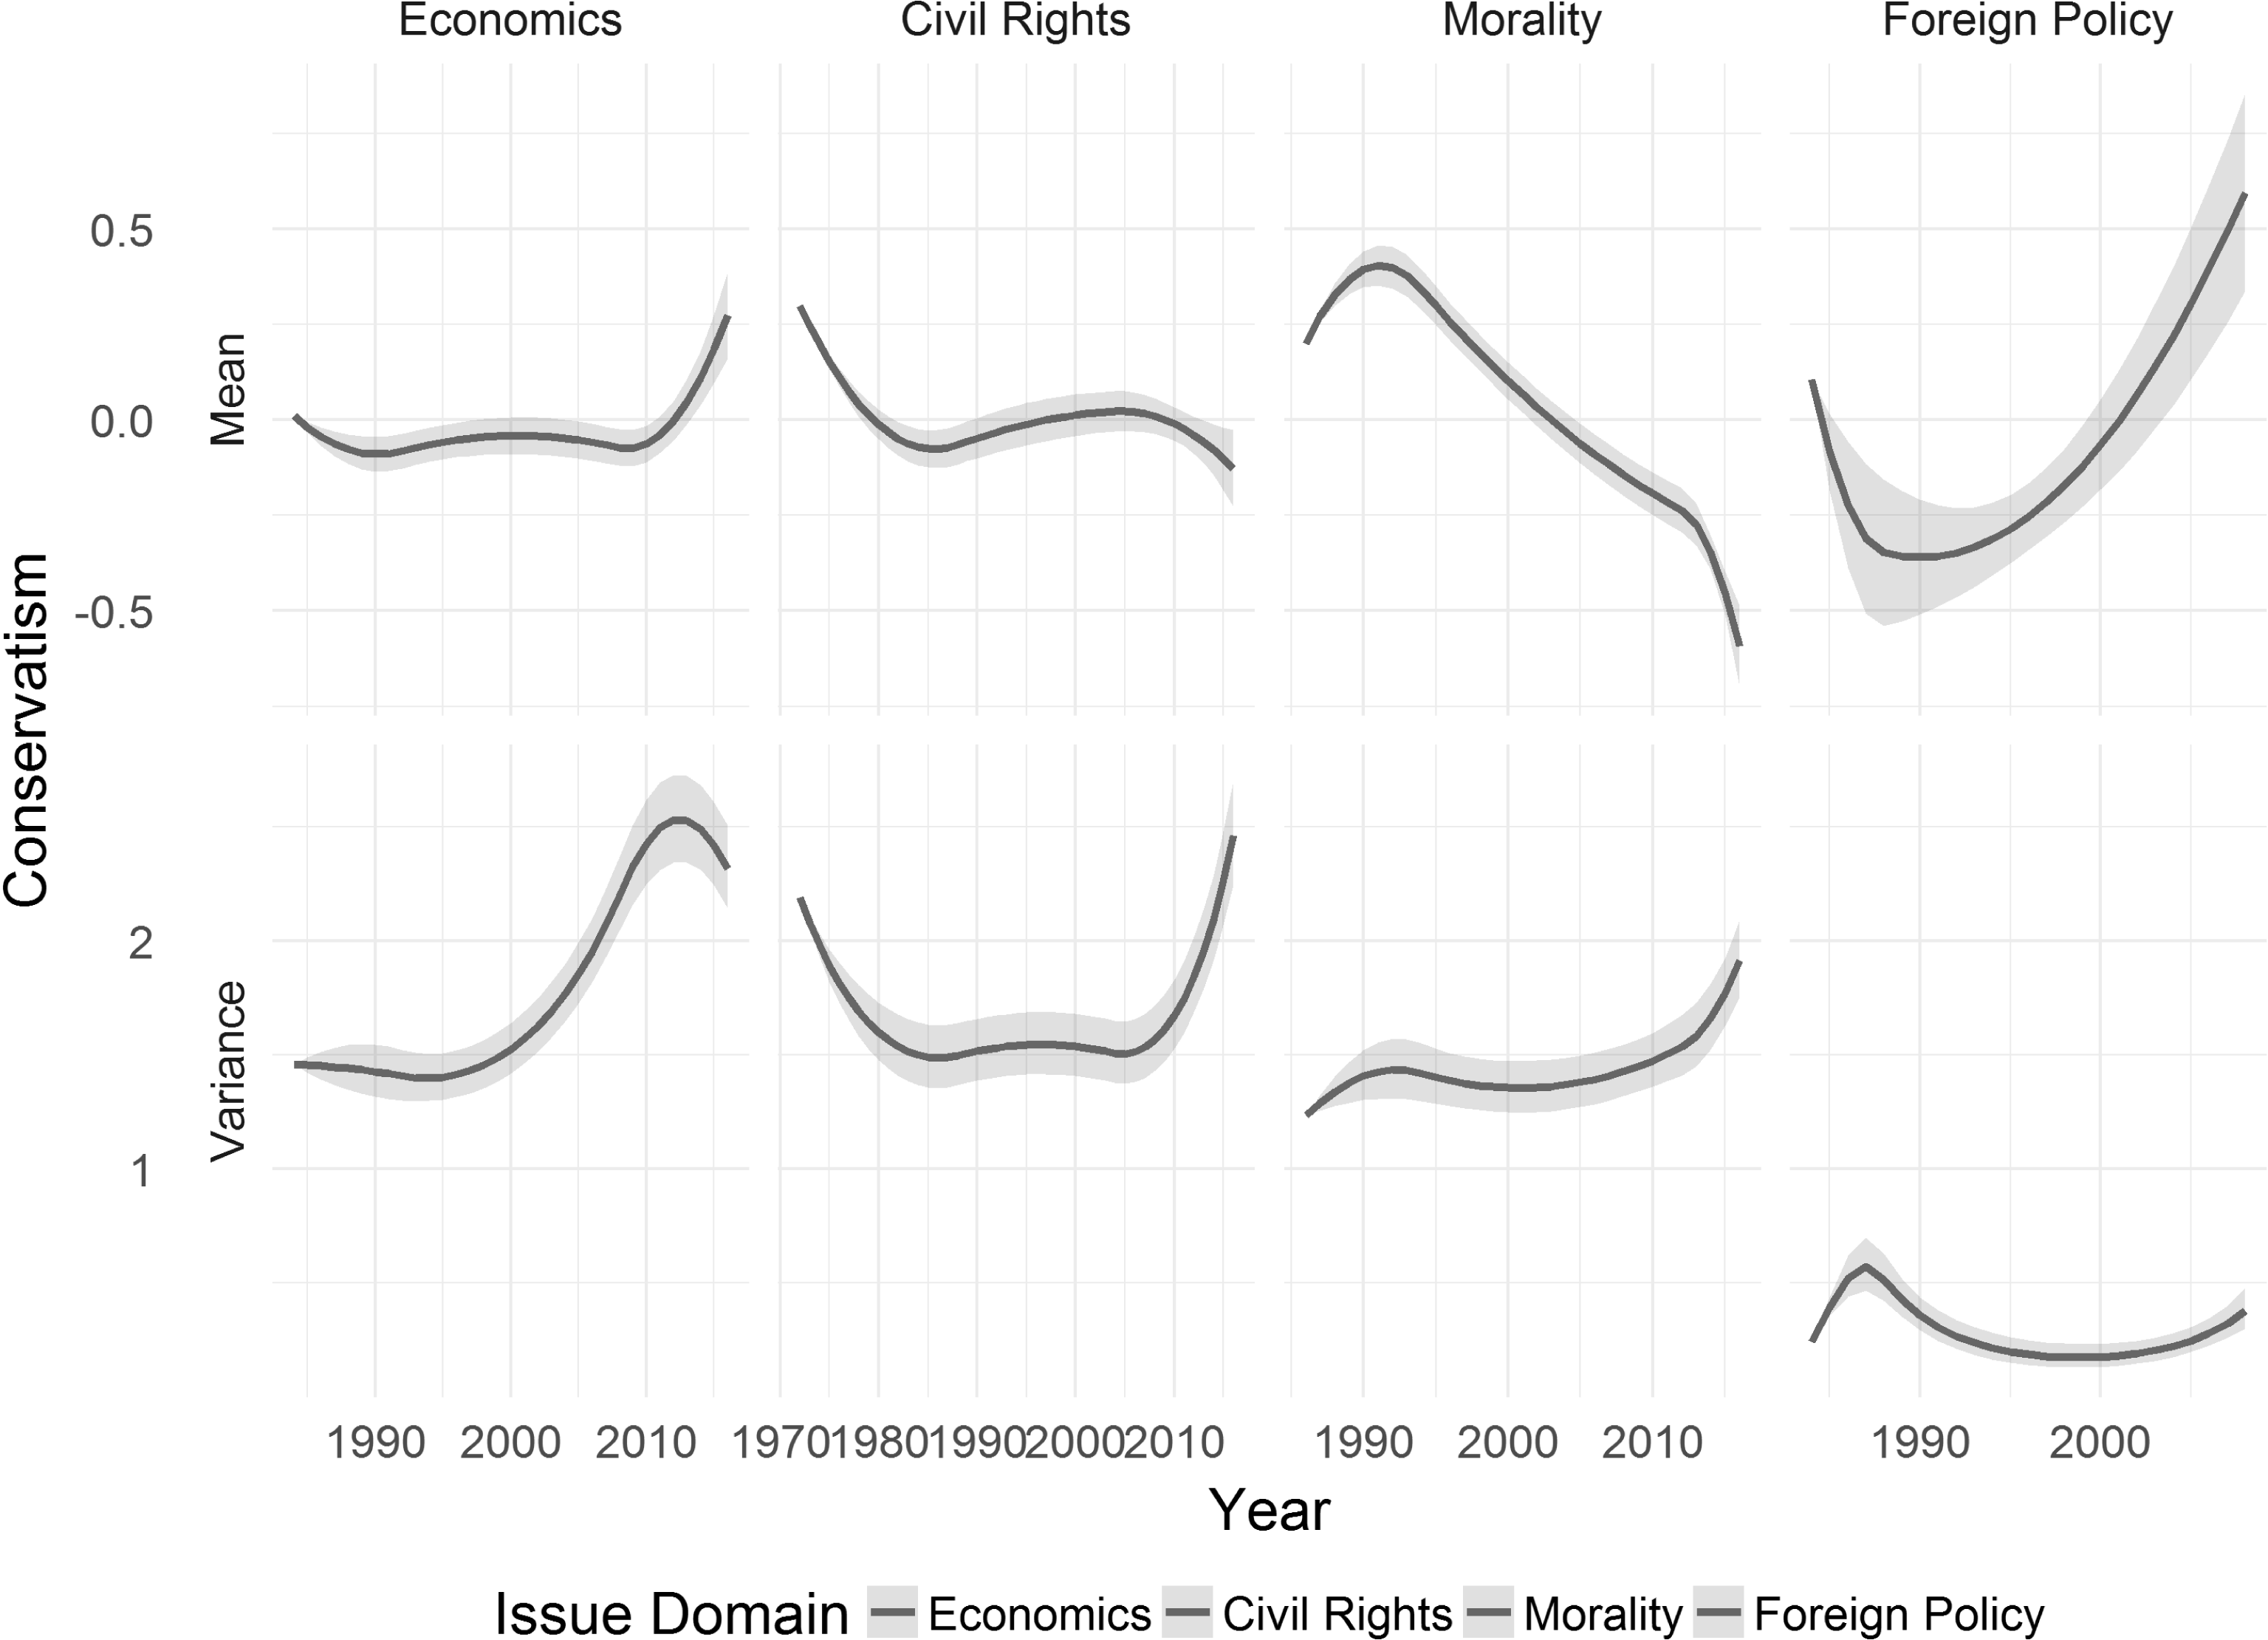
Trends in means and variances of policy conservatism by issue domain. Note: Ribbons represent 95% asymptotic confidence intervals.

The hierarchical IRT approach offers an ideal tool for us to revisit trends in mass polarization, not only because it scales ordinal response data in a principled way, but also because it allows simultaneous modeling of the mean and variance of latent preferences. Because variance is the simplest and perhaps the most commonly used measure of mass polarization (e.g., DiMaggio, Evans, and Bryson Reference DiMaggio, Evans and Bryson1996, Mouw and Sobel Reference Mouw and Sobel2001, Evans Reference Evans2003, Hill and Tausanovitch Reference Hill and Tausanovitch2015), we can interpret an increase in variance as evidence of growing polarization. Specifically, we now model both the mean and variance of latent preferences as a year spline (with no other predictors), and, as above, examine the four issue domains separately. In addition, in each of the four issue domains, we address scale invariance by setting the geometric mean of the item discrimination parameters (
 $\unicode[STIX]{x1D6FD}_{j}$
) at one. This procedure ensures that the estimates of the variance component are relatively comparable across domains. The results are shown in Figure 4, in which the upper and lower panels present the means and variances of policy conservatism respectively (along with 95% confidence intervals). Several findings have emerged. First, we can see that in the economic domain, the average opinion stayed stable for most of the period and but has moved decidedly to the right since around 2010. In the meanwhile, the variance component has increased dramatically since the early 2000s, indicating a growing level of mass polarization over economic issues. Second, on civil rights issues, the average opinion grew more liberal up to the early 1980s but stayed highly stable over the past three decades. Trends in the variance component are nonmonotone, suggesting that civil rights attitudes became less polarized during the 1970s and 1980s but, throughout the 2010s, has reverted to, or even exceeded, the level of polarization in the early 1970s. Third, on moral issues, the average opinion has become increasingly more liberal since the early 1990s. And, contrary to popular accounts of escalating “culture war,” the variance of moral attitudes was remarkably stable until around 2010, after which it slightly increased. Finally, on foreign policy issues, the average opinion has changed rapidly over time—becoming considerably more dovish in the late 1980s but far more hawkish in the 1990s and 2000s. The variance component, by contrast, has been exceptionally low throughout the period, suggesting that at a given point in time, foreign policy issues are not only highly bipartisan, but also relatively consensual in the broader society. Overall, our findings suggest that mass opinion has indeed polarized in recent years, especially on economic and civil right issues.
4.3 Ideological Constraint
In assessing trends in opinion polarization, we have employed the fitted means and variances of the hierarchical IRT model. As noted earlier, the EM algorithm also allows us to construct empirical Bayes estimates of the latent preferences at the individual level. These individual-level preference estimates, which can be interpreted as ideological positions in the corresponding issue domain, in turn enable us to gauge the levels and trends in ideological constraint across domains. In his landmark study, Converse (Reference Converse and David1964) contends that the vast majority of the electorate are politically innocent and do not hold stable and coherent policy preferences. Although this perspective has been highly influential in public opinion scholarship over the past half century, a number of studies have challenged Converse’s conclusions by pointing out that the apparent instability and incoherence in issue attitudes are largely driven by measurement error associated with survey responses (Judd and Milburn Reference Judd and Milburn1980; Jackson Reference Jackson1983; Norpoth and Lodge Reference Norpoth and Lodge1985; Hurwitz and Peffley Reference Hurwitz and Peffley1987; Ansolabehere, Rodden, and Snyder Reference Ansolabehere, Rodden and Snyder2008). In particular, Ansolabehere, Rodden, and Snyder (Reference Ansolabehere, Rodden and Snyder2008) show that once measurement error is accounted for by averaging across multiple items, voter preferences exhibit not only temporal stability, but also a high degree of constraint between issues in the same domain. Relatively underexplored, however, is ideological constraint across issue domains. A notable exception is Layman and Carsey (Reference Layman and Carsey2002), who used confirmatory factor analysis to construct latent attitudes in the three domestic issue domains (for a limited number of items that were asked consistently in ANES 1992, 1996, and 2000), assessed correlation coefficients between these latent attitudes among different groups, and found that only politically aware party identifiers exhibited statistically significant constraint across domains, i.e., aligned their social welfare, racial, and cultural attitudes with one another. More recently, Baldassarri and Gelman (Reference Baldassarri and Gelman2008) examined long-term trends in pairwise correlations of issue attitudes and found that the average correlation between issues from different domains was very weak (around 0.12) and barely increased over time. Their analysis, however, was based on correlation coefficients between single items, and, therefore, could have easily been contaminated by measurement error. In what follows, we use the hierarchical IRT approach to reassess the levels and trends of ideological constraint in the American electorate.
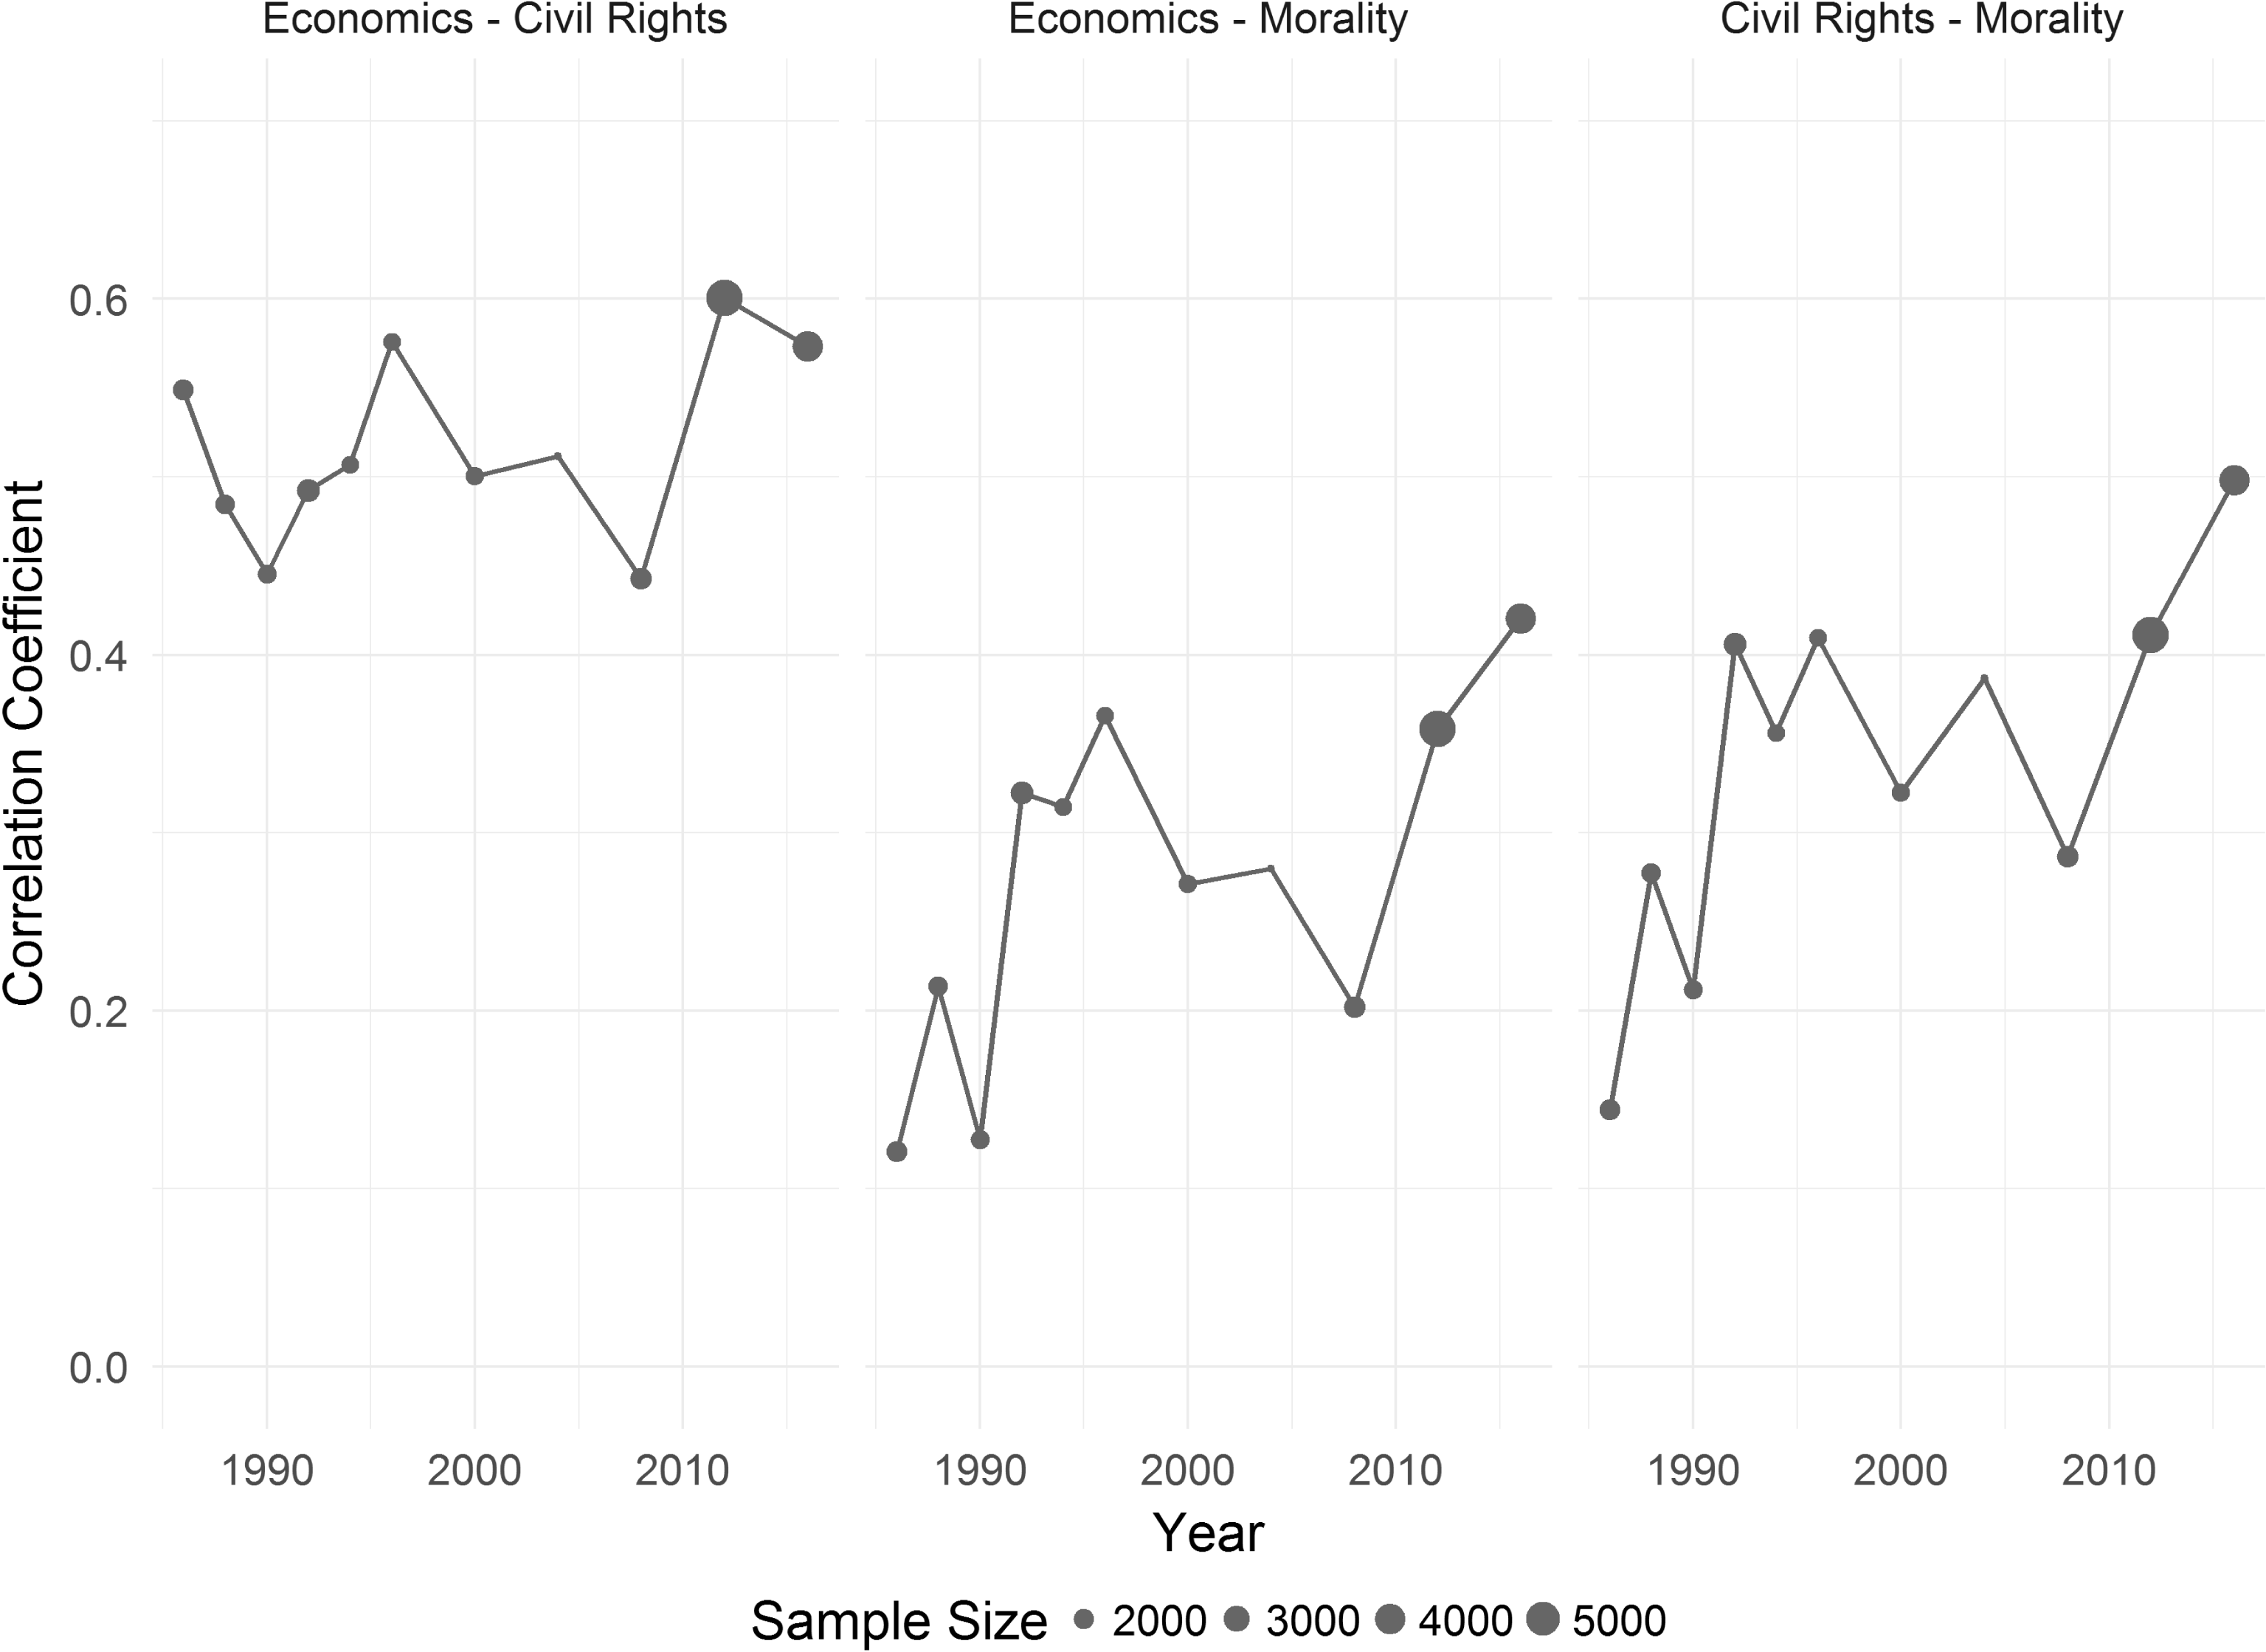
Specifically, we fit the same hierarchical graded response model as in the previous example (with both the prior mean and the prior variance modeled as a year spline) and extract empirical Bayes estimates of the latent preferences at the individual level (equation (3) in Supplementary Material A).Footnote 15 Then, for each survey year, we calculate Pearson’s correlation coefficients between these latent preference estimates for economic, civil rights, and moral issues. The results are shown in Figure 5. Two patterns are worth noting. First, ideological constraint seems to be stronger between economic and civil rights issues (left panel) than between economic/civil rights issues and moral issues (middle/right panel). The correlation coefficient between economic and civil rights attitudes has been hovering around 0.5–0.6 for most of the study period. Such strong correlations, as noted in Layman and Carsey (Reference Layman and Carsey2002), may reflect a common philosophical concern underlying economic and civil rights issues, as both speak to the role of government in promoting economic and social equality. Second, ideological constraint between moral issues and the other two domains, although relatively moderate, has greatly strengthened over the past three decades. For instance, the correlation coefficient between civil rights attitudes and moral attitudes increased from less than 0.2 in 1986 to about 0.5 in 2016. Thus, with a longer time series and a more principled approach to gauging policy preferences, we have reached a finding that runs counter to Baldassarri and Gelman (Reference Baldassarri and Gelman2008), that American public opinion has not only aligned more closely with party identification, but also grown considerably more coherent across different issue domains. This finding echoes a recent study by Caughey, Dunham, and Warshaw (Reference Caughey, Dunham and Warshaw2018), who find that at the level of state-party publics, economic, racial, and social attitudes have also become increasingly aligned.Footnote 16
Trends in ideological constraints between issue domains.

5 Concluding Remarks
In this paper, I have shown that a class of hierarchical item response models, in which both the mean and variance of the ability parameters (i.e., latent policy preferences) may depend on observed covariates, can be fruitfully applied to analyze public opinion data. The hierarchical IRT models—be the responses in binary, ordinal, or nominal format—can be fitted via an extension of the EM algorithm proposed in Bock and Aitkin (Reference Bock and Aitkin1981). In practice, the hierarchical approach can serve two distinct purposes. First, given that a major goal of public opinion research is to examine how policy preferences differ among groups, vary across regions, or evolve over time, the hierarchical approach helps integrate measurement and analysis, as it pools information from multiple items and estimates the effects of observed covariates simultaneously. The joint estimation—via maximizing the marginal likelihood—is computationally fast, statistically efficient, and offers valid asymptotic inference for all parameters. By contrast, the widely adopted two-step approach, be the first step simple average, PCA, or a conventional IRT model, can lead to substantial bias, inefficiency, and inadequate coverage of confidence intervals. As we have seen, with party ID, education, and year spline terms specified as the inputs of the mean equation, the hierarchical model offers a comprehensive picture of how party polarization in the American electorate has varied by issue domain, differed across educational groups, and evolved over time. Moreover, with survey year being the sole input of both the mean and variance equations, the hierarchical model enables us to examine patterns and trends of opinion polarization in the broader society.
Second, the hierarchical IRT models also permit us to construct empirical Bayes estimates of latent policy preferences at the individual level. Akin to ideal points now routinely estimated for legislators, judges, and executives (from conventional binary IRT models), these latent preferences can be interpreted as ideological positions of ordinary citizens in specific issue domains. Because the model pools information across multiple items, estimates of these latent preferences are relatively precise indicators of these ideological positions (as shown in the last row of Figure 1), and, therefore, can be used to examine a variety of outcomes, such as ideological constraint, voting behavior, and representation. For example, we have used empirical Bayes estimates of the latent preferences to assess how ideological constraints between different issue domains have evolved over time.
As mentioned at the beginning, compared with political elites, the belief system among the mass public tends to be relatively amorphous and multidimensional. Thus it would be inappropriate to scale public opinion onto a single dimension using the whole panoply of attitude questions in an opinion survey. The position taken in this article, as illustrated with the ANES data, is to classify survey items into different domains and conduct dimension-specific analysis. Occasionally, however, we may encounter survey items that could reflect more than one latent dimension of preference. For example, the ANES question on federal spending on assistance to blacks may tap a combination of economic attitudes and racial attitudes. In such cases, it would be useful to consider a multidimensional hierarchical IRT model in which the latent preference vector
 $\unicode[STIX]{x1D73D}_{\boldsymbol{i}}$
follows a multivariate normal prior:
 $$\begin{eqnarray}\unicode[STIX]{x1D73D}_{\boldsymbol{i}}\stackrel{\text{indep}}{{\sim}}\text{N}(\unicode[STIX]{x1D741}_{\boldsymbol{i}},\unicode[STIX]{x1D72E}_{\boldsymbol{i}}).\end{eqnarray}$$
Depending on the research question, the prior means (reflecting average opinion), prior variances (reflecting opinion heterogeneity or polarization), and prior correlation coefficients (reflecting ideological constraint) may all be parameterized as functions of observed covariates. As noted in Clinton, Jackman, and Rivers (Reference Clinton, Jackman and Rivers2004), for a
 $d$
-dimensional conventional IRT model, a minimum of
 $d^{2}+d$
identification constraints are needed. This is because the model is invariant under any affine transformation of the latent preference vector
 $\unicode[STIX]{x1D73D}_{i}^{\ast }=\boldsymbol{A}\unicode[STIX]{x1D73D}_{i}+\boldsymbol{b}$
, where
 $\boldsymbol{A}$
is a
 $d\times d$
invertible matrix and
 $\boldsymbol{b}$
is a
 $d\times 1$
vector. For a hierarchical IRT model characterized by equation (10), where both
 $\unicode[STIX]{x1D741}_{i}$
and
 $\unicode[STIX]{x1D72E}_{\boldsymbol{i}}$
are modeled as functions of observed covariates,
 $d$
constraints are needed for the model of
 $\unicode[STIX]{x1D741}_{i}$
and
 $d^{2}$
constraints for the model of
 $\unicode[STIX]{x1D72E}_{\boldsymbol{i}}$
. It should be noted, however, that constraints on the model of
 $\unicode[STIX]{x1D72E}_{\boldsymbol{i}}$
may imply unintended restrictions on the relative degree of polarization in different domains as well as the levels of ideological constraint between domains. To avoid such restrictions, we could impose alternative constraints on the item parameters. For example, with prior knowledge about the nature of different items, we could restrict some item discrimination parameters to be zero. Given the identification constraints, the EM algorithm presented in Supplementary Material A can be directly extended to estimate the hierarchical parameters, except that the second component of the M-step is now analogous to a covariance regression model (e.g., Hoff and Niu Reference Hoff and Niu2012) rather than a univariate heteroscedastic regression. Undoubtedly, future work is needed to explore and implement such extensions.
Apart from generalization to multiple dimensions, the hierarchical IRT approach presented in this paper can also be extended to accommodate multiple levels of variation. The level II model, for example, can itself be specified as a hierarchical linear model with individuals nested in geographic areas such as US states and regions. Such a model would be useful if we are interested in how contextual-level variables shape and predict individual preferences. When combined with poststratification, it could also be used to estimate public opinion at the level of geographic units that are not self-representative in national surveys (Park, Gelman, and Bafumi Reference Park, Gelman and Bafumi2004). To implement this extension, the EM algorithm needs to be adapted as the M-step now involves fitting a hierarchical linear model. I leave this extension for future work.
Despite its advantages over conventional scaling methods, the hierarchical IRT approach is not without limitations. In fact, by pooling information from multiple items, it runs the risk of masking potentially unique patterns of attitudinal variation for highly specific issues. In my analysis of the ANES data, for example, the moral domain includes ten questions covering a wide range of issues such as gender equality, gay rights, school prayer, and abortion (see Table 1). While it is reasonable to assume a common moral dimension underlying attitudes toward these issues, there may still be idiosyncratic variations in attitude toward particular issues. For instance, while Democrats and Republicans have likely polarized on hot-button issues such as gay rights and abortion, they may have moved toward a consensus on gender equality. Thus, when the researcher is concerned with a particular issue, it might be more fruitful to focus on variations and trends in the original responses to the corresponding question(s). However, even for specific issues, multiple items are often used to gauge the respondent’s underlying preference. For example, in ANES, three questions have been asked to tap attitudes toward gay rights, and in GSS, six questions have been asked to tap attitudes toward abortion. In those cases, hierarchical item response models can and should still be exploited to streamline analysis, reduce bias, and increase efficiency.
Finally, it is worth noting that although our applications to the ANES data are descriptive in nature, the models presented in this paper can be readily applied to study the causal effects of various “treatments”—such as elite position-taking (e.g., Broockman and Butler Reference Broockman and Butler2017), political socialization (e.g., Mendelberg, McCabe, and Thal Reference Mendelberg, McCabe and Thal2017), and economic inequality (e.g., Rueda and Stegmueller Reference Rueda and Stegmueller2016)—on public opinion.Footnote 17 For example, in a survey experiment where policy attitudes are tapped by a battery of items, the hierarchical IRT approach would be a natural tool to estimate the causal effect of the treatment on the underlying preference of interest. Similarly, the level II model can be easily adapted to accommodate matched data, time series cross-sectional data, and regression discontinuity designs. Given its statistical validity, computational efficiency, and analytical flexibility, we see no reason why future research on public opinion should shy away from the hierarchical approach.
Supplementary materials
For supplementary materials accompanying this paper, please visit https://doi.org/10.1017/pan.2018.63.