
Introduction
Toxocara canis is a widespread parasite of canids and many paratenic hosts including humans (Holland, Reference Holland2017; Ma et al., Reference Ma, Holland, Wang, Hofmann, Fan, Maizels, Hotez and Gasser2018, Reference Ma, Rostami, Wang, Hofmann, Hotez, Gasser and Bowman2020). These paratenic hosts become infected by accidental ingestion of embryonated eggs containing infective third-stage larvae (L3) or by ingestion of raw meat from infected hosts (Strube et al., Reference Strube, Heuer and Janecek2013). After infection of a paratenic host, L3 larvae penetrate the small intestine mucosa and migrate through various tissues to the central nervous system (CNS). Depending on the immune status of the paratenic host and the infection dose, L3 larvae can damage the affected tissue, persist in them as arrested dormant stages (Glickman and Schantz, Reference Glickman and Schantz1981; Rubinsky-Elefant et al., Reference Rubinsky-Elefant, Hirata, Yamamoto and Ferreira2010) and elicit host immune response. In a mouse model of neural larva migrans (NLM, neurotoxocarosis) (Fan et al., Reference Fan, Holland, Loxton and Barghouth2015), somatic migration of T. canis L3 larvae can be divided into 3 phases (Strube et al., Reference Strube, Waindok, Raulf, Springer and Bowman2020a) – acute, subacute and chronic – and occurs in a biphasic pattern, with the first peak of brain migration described at day 7 post infection (p.i.) and the second peak beginning at day 35 p.i. (Janecek et al., Reference Janecek, Beineke, Schnieder and Strube2014). The general trend is a continuous accumulation of L3 larvae in the brain during infection (Strube et al., Reference Strube, Waindok, Raulf, Springer and Bowman2020a).
As with many other helminths, T. canis L3 larval infection has been associated with immunomodulatory effects (Maizels and McSorley, Reference Maizels and McSorley2016; Waindok and Strube, Reference Waindok and Strube2019; Loukas et al., Reference Loukas, Maizels and Hotez2021), which could possibly influence a number of inflammatory conditions, including autoimmune and allergic diseases (Maizels, Reference Maizels2020; Loukas et al., Reference Loukas, Maizels and Hotez2021).
The immunomodulation induced by helminth antigens is often associated with Th2 polarization, differentiation of macrophages towards the M2 phenotype or induction of regulatory T cells (Tregs). All these pathways result in downregulation of Th1 and Th17 response and decreased production of pro-inflammatory cytokines, establishing an anti-inflammatory/regulatory milieu. This state minimizes pathological sequelae and allows long-term survival of helminths in the host (Maizels and McSorley, Reference Maizels and McSorley2016; Smallwood et al., Reference Smallwood, Giacomin, Loukas, Mulvenna, Clark and Miles2017; Maizels, Reference Maizels2020).
Due to their immunomodulatory potential, a number of helminths or their products have been studied as a possible alternative to ameliorate the course of experimental autoimmune encephalomyelitis (EAE), the rodent model of multiple sclerosis (MS) (Charabati et al., Reference Charabati, Donkers, Kirkland and Osborne2020). Such helminth immunotherapy (HIT) could represent an experimental approach to current immunomodulatory and immunosuppressive treatments (Dargahi et al., Reference Dargahi, Katsara, Tselios, Androutsou, de Courten, Matsoukas and Apostolopoulos2017; Hauser et al., Reference Hauser, Kappos, Montalban, Craveiro, Chognot, Hughes, Koendgen, Pasquarelli, Pradhan, Prajapati and Wolinsky2021) of human MS. Indeed, a wide variety of helminths and their products have been tested (Charabati et al., Reference Charabati, Donkers, Kirkland and Osborne2020). The vast majority of studies reported a positive effect of HIT (remission of EAE), especially when infection or administration of the products was prophylactic (i.e. preceding EAE induction). There is a wide range of the helminths and their products with positive effects, e.g. Heligmosomoides polygyrus (Wilson et al., Reference Wilson, Taylor, O'Gorman, Balic, Barr, Filbey, Anderton and Maizels2010; Donskow-Lysoniewska et al., Reference Donskow-Lysoniewska, Krawczak and Doligalska2012, Reference Donskow-Lysoniewska, Krawczak, Bocian and Doligalska2018; White et al., Reference White, Johnston, Grainger, Konkel, O'connor, Anderton and Maizels2020), Trichinella spiralis (Gruden-Movsesijan et al., Reference Gruden-Movsesijan, Ilic, Mostarica-Stojkovic, Stosic-Grujicic, Milic and Sofronic-Milosavljevic2010; Kuijk et al., Reference Kuijk, Klaver, Kooij, van der Pol, Heijnen, Bruijns, Kringel, Pinelli, Kraal, de Vries, Dijkstra, Bouma and van Die2012; Sofronic-Milosavljevic et al., Reference Sofronic-Milosavljevic, Radovic, Ilic, Majstorovic, Cvetkovic and Gruden-Movsesijan2013; Radovic et al., Reference Radovic, Gruden-Movsesijan, Ilic, Cvetkovic, Mojsilovic, Devic and Sofronic-Milosavljevic2015), Trichinella pseudospiralis (Wu et al., Reference Wu, Nagano, Asano and Takahashi2010), Trichuris suis (Kuijk et al., Reference Kuijk, Klaver, Kooij, van der Pol, Heijnen, Bruijns, Kringel, Pinelli, Kraal, de Vries, Dijkstra, Bouma and van Die2012), Schistosoma mansoni (La Flamme et al., Reference La Flamme, Ruddenklau and Backstrom2003; Sewell et al., Reference Sewell, Qing, Reinke, Elliot, Weinstock, Sandor and Fabry2003; Zhu et al., Reference Zhu, Trikudanathan, Zozulya, Sandoval-Garcia, Kennedy, Atochina, Norberg, Castagner, Seeberger, Fabry, Harn, Khoury and Guleria2012), Schistosoma japonicum (Zheng et al., Reference Zheng, Hu, Zhou, Lu, Qiu, Bao and Dai2008), Taenia crassiceps (Reyes et al., Reference Reyes, Espinoza-Jimenez, Gonzalez, Verdin and Terrazas2011; Peon et al., Reference Peon, Ledesma-Soto, Olguin, Bautista-Donis, Sciutto and Terrazas2017; Terrazas et al., Reference Terrazas, Ruiz-Rosado, Amici, Jablonski, Martinez-Saucedo, Webb, Cortado, Robledo-Avila, Oghumu, Satoskar, Rodriguez-Sosa, Terrazas, Guerau-de-Arellano and Partida-Sanchez2017), Fasciola hepatica (Walsh et al., Reference Walsh, Brady, Finlay, Boon and Mills2009; Finlay et al., Reference Finlay, Stefanska, Walsh, Kelly, Boon, Lavelle, Walsh and Mills2016; Lund et al., Reference Lund, Greer, Dixit, Alvarado, McCauley-Winter, To, Tanaka, Hutchinson, Robinson, Simpson, O'Brien, Dalton and Donnelly2016), Nippostrongylus brasiliensis (Tran et al., Reference Tran, Wilcox, Dent, Robinson, Carter, Verma, Hall and Hodgkinson2017). However, there are also studies that show zero effect of HIT on the treatment of EAE, e.g. the infection with the larvae of Strongyloides venezuelensis (Chiuso-Minicucci et al., Reference Chiuso-Minicucci, Van, Zorzella-Pezavento, Peres, Ishikawa, Rosa, Franca, Turato, Amarante and Sartori2011) or administration of Acanthocheilonema viteae-derived excretory–secretory protein 62 (Doonan et al., Reference Doonan, Thomas, Wong, Ramage, Al-Riyami, Lumb, Bell, Fairlie-Clarke, Suckling, Michelsen, Jiang, Cooke, Harnett and Harnett2018). The only exception with a negative effect on the course of EAE was the administration of recombinant galectin 9 (rTl-gal) derived from Toxascaris leonina, which after administration inhibits EAE remission (Bing et al., Reference Bing, Ha, Ahn, Cho, Kim, Park, Yu and Jee2015).
Although it has been shown that the larvae of the worldwide distributed T. canis can exhibit neurotropic activity in an abnormal host, the significance of such parasite behaviour for the development of various neuropathologies has not yet been elucidated in detail. Therefore, we took the opportunity to study the issue in a laboratory-standardized animal model of MS – in mice with EAE – to investigate the effect of parasitic infection on the development of neuropathological changes. This is of particular interest as T. canis is a worldwide distributed neurotropic roundworm affecting millions of people, but its impact on MS is unknown.
Materials and methods
Animals
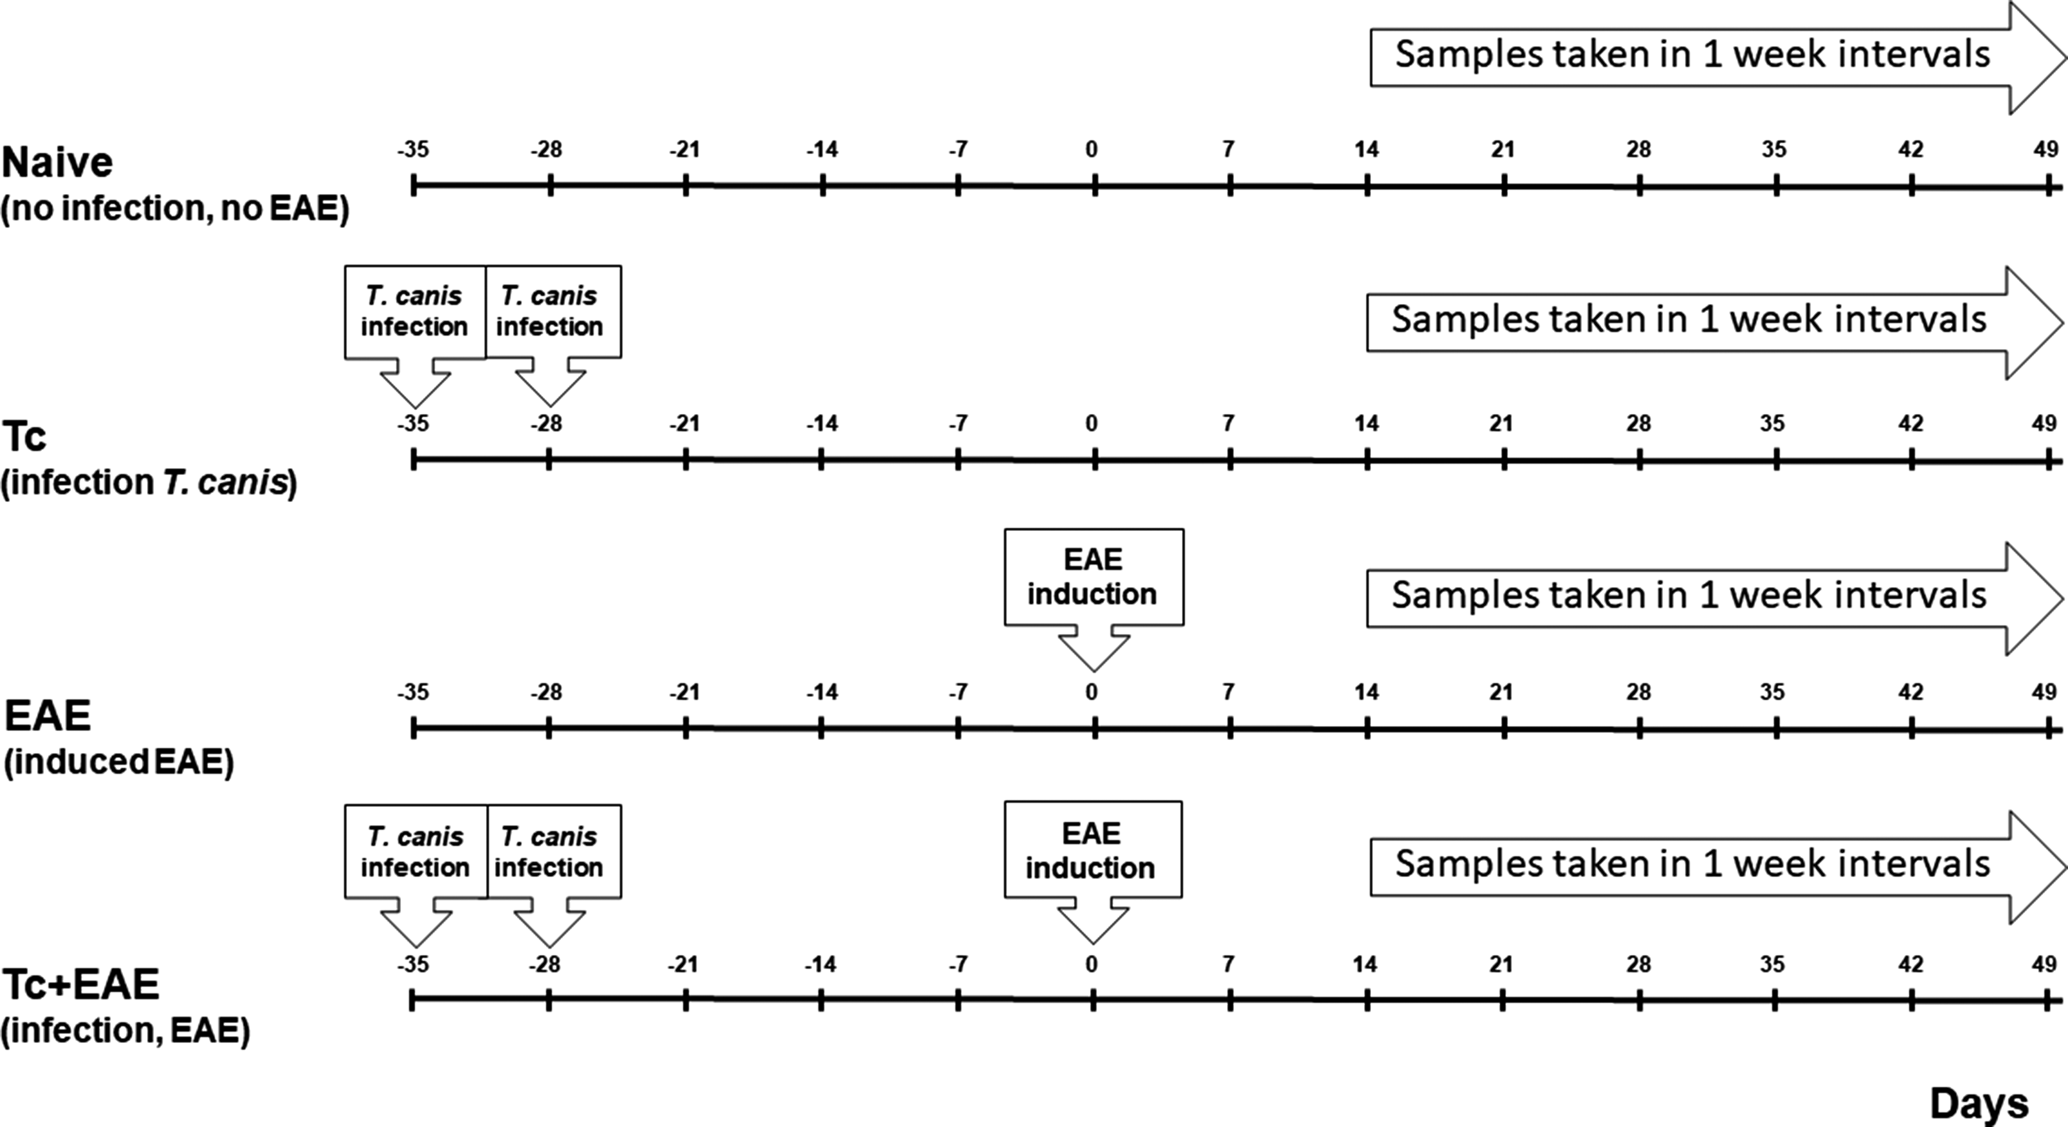
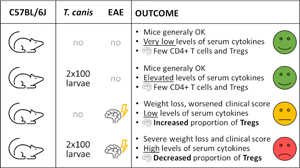
Female C57BL/6J (Charles River) mice, 5 weeks old, were housed in a 12 hours light/dark cycle in the animal facility of the First Faculty of Medicine, Charles University (Prague, Czechia). Prior to the experiment, mice were left to acclimate for 2 weeks. Mice were divided into 4 groups, each consisting of 12 animals (4 mice per cage). The first group consisted of control non-infected mice (naive), the second group (Tc) consisted of animals that were orally infected with 2×100 T. canis L3 larvae on days 0 and 7 post the first infection, in the third group (EAE) only EAE was induced, and in the fourth group (Tc+EAE), mice were infected similarly as the group Tc and EAE was induced in the same way as in the group EAE (Fig. 1). The experimental design and procedures were approved by the Ethical Committee of the First Faculty of Medicine, Charles University and the Ministry of Education, Youth and Sports (ID: MSMT-21527/2017-10, 10 August 2017). The experiments were performed in strict accordance with institutional guidelines and national/EU animal welfare laws and directives.
Experimental design: 48 mice were divided into 4 separate groups of 12: (i) Naive – control non-infected mice; (ii) Tc – animals that were infected with 100 T. canis L3 larvae on day 0 and reinfected on day 7; (iii) EAE – experimental autoimmune encephalomyelitis (EAE) was induced on day 35 post the first infection; (iv) Tc+EAE – mice were infected in the same way as in group Tc and EAE was induced in the same way as in group EAE. Time data (days) showing when infections and reinfections, EAE inductions and sampling were performed. EAE was induced by subcutaneous injection MOG peptide in phosphate-buffered saline (PBS) and complete Freund's adjuvant, followed by 2 intraperitoneal injections of pertussis toxin (PT). After EAE induction, clinical symptom scores were monitored and mice were weighed. From day 14 after EAE induction, mice were sacrificed at weekly intervals and serum, spleen, mesenteric nodes, brain and spinal cord were collected and used to (1) determine TES IgG-specific antibodies, (2) determine serum cytokine concentrations and (3) determine Tregs populations.

Toxocara canis infections
Adult females of T. canis were isolated from the feces of naturally infected dogs in the dog shelters after antihelminthic treatment. Egg isolation, embryonation, hatching and isolation of L3 larvae were performed according to established protocols (Bowman et al., Reference Bowman, Mikagrieve and Grieve1987; Desavigny et al., Reference Desavigny, Voller and Woodruff1979). Isolated L3 larvae were cultivated in vitro in RPMI 1640 medium (Biosera, NUAILLE, France, cat. no. LM-R1639) containing 100 IU mL−1 penicillin and 100 ng mL−1 streptomycin (Sigma-Aldrich, Darmstadt, Germany, cat. no. P4333) at 37°C and 5% CO2. Prior to infections, L3 larvae were centrifuged in 50 mL tubes at 600 g at 20°C for 5 min, washed 3 times with sterile phosphate-buffered saline (PBS) and counted in 10 aliquots of 50 μL. The L3 larval suspension was then diluted with PBS to a concentration of 200 L3 larvae per mL and mice were infected orally by drinking 100 L3 larvae resuspended in 0.5 mL PBS; the reinfection was performed after 7 days. The viability of L3 larvae was controlled visually under the microscope. The success of the infection was confirmed by the determination of specific serum IgG antibodies against T. canis excretory–secretory antigens (TES) by ELISA according to Novák et al. (Reference Novák, Panská, Macháček, Kolářová and Horák2017).
EAE induction
EAE was induced according to Bittner et al. (Reference Bittner, Afzali, Wiendl and Meuth2014) on day 35 post the first T. canis infection. Briefly, 200 μg myelin oligodendrocyte glycoprotein-derived 35–55 amino acid peptide (MOG) in 200 μL in PBS and complete Freund's adjuvant containing 1 mg mL−1 Mycobacterium tuberculosis (Sigma-Aldrich, Darmstadt, Germany, cat. no. F5881) were injected subcutaneously into 2 different sites on each hind flank, being followed by intraperitoneal injection of 500 ng pertussis toxin (PT) in 200 μL PBS. After 48 hours, intraperitoneal injection of the same amount of PT was repeated. The MOG was synthesized by solid-phase synthesis (purity >96%) and was kindly donated by Dr. Ladislav Drož and Dr. Věra Černá (APIGENEX). The PT was kindly donated by Professor Peter Šebo (Institute of Microbiology, Czech Academy of Sciences).
Measurement of clinical symptom scores and weight loss
Starting on the day of EAE induction (d.e.i.), mice were weighed daily and scored for clinical signs (CS) of EAE according to Radovic et al. (Reference Radovic, Gruden-Movsesijan, Ilic, Cvetkovic, Mojsilovic, Devic and Sofronic-Milosavljevic2015): 0 = no CS; 1 = flaccid tail; 2 = hind limb paresis; 3 = complete bilateral hind limb paralysis often associated with incontinence; and 4 = moribund state or death. Clinical scores and normalized percentage weight changes were compared for all groups. These data were pooled from 2 independent experiments. Mice were observed 50 days after induction of EAE.
Serum sampling and leucocyte isolation from spleen, mesenteric lymph nodes, brain and spinal cord
Serum and leucocytes from spleen, mesenteric lymph nodes (MLN), brain and spinal cord (CNS) were taken from 14 to 50 d.e.i. in weekly intervals from 2 animals of each group. Because all mice were already in the chronic phase of infection (i.e. a large proportion of larvae was already in the CNS), and because no large differences or patterns were observed in the quantification of individual cytokines, antibodies and cell populations, all these data were treated as a single set for statistical processing regardless of the date of collection.
Mice were narcotized, blood samples were taken by puncture of the facial vein and serum was collected and kept frozen at −80°C. The mice were perfused through the left heart ventricle with sterile ice-cold PBS, and the spleen, MLN, brain and spinal cord were extracted. The spleen was homogenized and strained through a 70 μm cell strainer (Sigma, Corning Cell Strainer 70 μm Nylon, cat. no. 431751), erythrocytes were lysed with lysis buffer (BD Pharm Lyse, cat. no. 555899) and the samples were washed twice with PBS followed by centrifugation at 200 g at 4°C for 10 min, and finally washed using the staining buffer (eBioscience Flow Cytometry Staining Buffer, Massachusetts, USA, cat. no. 00-4222-26). MLN lymphocytes were treated in the same manner with the exception of erythrocyte lysis.
Brain and spinal cord were washed with sterile PBS and further processed according to Pino and Cardona (Reference Pino and Cardona2011). Briefly, the brain and spinal cord were washed in PBS, homogenized, strained, centrifuged and then mixed with isotonic Percoll solution (Percoll Plus, Sigma Aldrich, cat. no. E0414) in Hank's balanced salt solution (HBSS) (HBSS 10×, Biosera, NUAILLE, France, cat. no. XC-S2064/500) to give a Percoll concentration of 30%. This material was carefully layered on top of Percoll 70% in HBSS in the 50 mL Falcon tube and centrifuged at 500 g at 18°C for 30 min. After centrifugation, the myelin floating on the top was removed, and the cells of interest floating in 30/70 interphase were collected, washed twice with HBSS and finally in the staining buffer. Identification of the Tregs population was performed using eBioscience™ Mouse Regulatory T Cell Staining Kit #2 (eBioscience, Massachusetts, USA, cat. no. 88-8118-40) and Helios staining using a PE-Cy7 labelled monoclonal antibody [Exbio, Czech Republic, Mab to Helios (22F6) PE-Cy7, Cat. No. T7-771-T100] according to the manufacturer's instructions. The labelled antibodies were used at the following quantities per 1 million cells: CD4-FITC 0.25 μL per test, CD25-PE 0.3 μL per test, FoxP3-APC 2.5 μL per test and Helios-PE-Cy7 2 μL per test. The final volume during staining was less than 50 μL. The samples were acquired by BD FACS Canto II and analysed in FlowJo (v. 10.7.1). A representative gating strategy is shown in Supplementary Fig. 1.
Cytokine cytometric bead array
Serum concentrations of interleukin (IL)-4, IL-10, IL-6, tumour necrosis factor (TNF)-α, interferon (IFN)-γ, IL-2 and IL-17A were measured using the BD Cytometric Bead Array (CBA) Mouse Th1/Th2/Th17 Cytokine Kit (BD, New Jersey, USA, cat. no. 560485) and IL-1α using the CBA Mouse IL-1α Flex Set (BD, New Jersey, USA, cat. no. 560157) with slight modification. The lower CBA detection limits for the cytokines are as follows: IL-2: 0.1 pg mL−1, IL-4: 0.03 pg mL−1, IL-6: 1.4 pg mL−1, IFN-γ: 0.5 pg mL−1, TNF-α: 0.9 pg mL−1, IL-17A: 0.8 pg mL−1, IL-10: 16.8 pg mL−1, IL-1α: 1 pg mL−1. The upper limit of the calibration curve is 5000 pg mL−1 for all cytokines mentioned, except IL-1α, where the upper limit is 2500 pg mL−1. Prior to measurement, the beads for IL-1α detection were tested along with those for other cytokines in the Th1/Th2/Th17 kit and the optimal serum dilution was determined based on the manufacturer's protocol, previous experiments and consultation with a BD application specialist. Briefly, the bead mixture from both kits was prepared and distributed into tubes, then diluted (1 : 9) serum samples were added and vortexed. The detection reagent was then added, samples were vortexed and incubated for 2 h at room temperature, protected from light. After incubation, 1 mL wash buffer was added and tubes were centrifuged at 200 g for 5 min. The supernatants were discarded and the pellets were resuspended in 300 μL of wash buffer. A calibration curve was generated for each cytokine using the kit standards. Fluorescence was measured using BD FACS Canto II (BD) and cytokine concentrations were determined by comparison with the calibration curve for each cytokine using the BD CBA software package.
Statistical analysis
Clinical scores and normalized body weights were examined by 2-way analysis of variance (ANOVA) for repeated measures (mixed-effects model analysis) followed by Šidák's test. Antibody and cytokine levels were assessed by the Kruskal–Wallis test followed by Dunn's test. Flow cytometry data were evaluated by ordinary 1-way ANOVA followed by Šídák's test. The normality of the residuals was checked by inspection of Q-Q plots. Multiple comparison tests (Šidák's or Dunn's test) were used to analyse the following group pairs: naive vs Tc, naive vs EAE, Tc vs EAE, Tc vs Tc+EAE and EAE vs Tc+EAE. All tests were performed by GraphPad Prism version 9.3.1 (GraphPad Software, San Diego, California, USA).
Results
Toxocara canis infection was confirmed by the presence of TES-specific IgG by ELISA
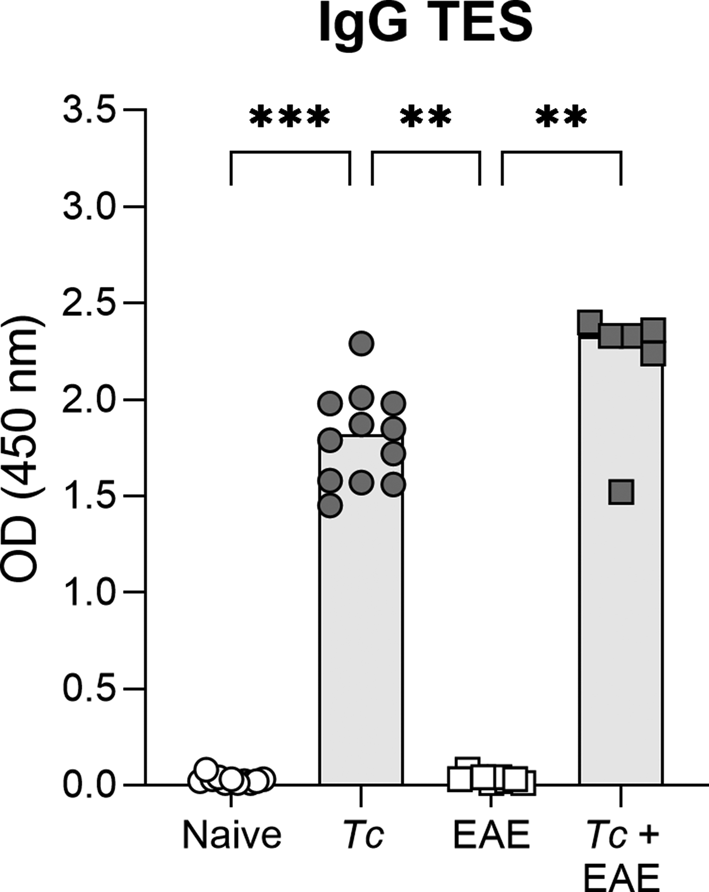
In both infected groups (Tc and Tc+EAE), infection with T. canis L3 larvae elicited a significant TES-specific IgG antibody response (Fig. 2) compared to both non-infected groups (naive and EAE). Although there were small differences between group Tc and group Tc+EAE, these differences were not statistically significant.
Specific IgG antibodies against T. canis excretory–secretory antigen (IgG TES) in mouse sera were measured by ELISA at optical density 450 nm. Individual data are shown along with the group median, Kruskal–Wallis test followed by Dunn's test were used to evaluate the differences between pre-selected groups (naive vs Tc, naive vs EAE, Tc vs EAE, Tc vs Tc+EAE and EAE vs Tc+EAE) (n = 12 mice in naive and Tc groups, n = 10 mice in EAE group and n = 8 mice in Tc+EAE group: 2 and 4 mice died during the experiment in EAE and Tc+EAE groups, respectively). Significant differences are indicated by asterisks (**P < 0.01, ***P < 0.001). Tc, Toxocara canis, EAE, experimental autoimmune encephalomyelitis.

Toxocara canis infection worsened clinical symptoms of EAE mice and exacerbated their weight loss
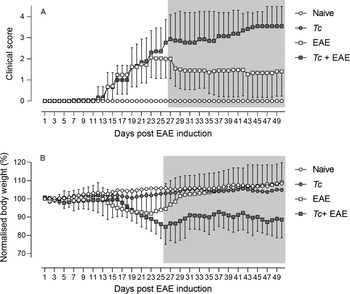
Occurrence of EAE symptoms was detected from 7 d.e.i. in Tc+EAE and also in EAE; however, the main increase in scores was observed from 14 d.e.i. From 27 d.e.i. until the end of the experiment, Tc+EAE mice exhibited a significantly higher (worse) clinical score compared to EAE mice (Fig. 3A). Of note, 4 Tc+EAE and 2 EAE mice died during the experiment (Tc+EAE 20, 23, 24, 27 d.e.i., EAE 29, 36 d.e.i). No symptoms or mortality were recorded in naive and Tc mice.
Infection with T. canis L3 larvae worsened the clinical score of EAE (A) and led to a reduction in the body weight (B) of infected mice with EAE (Tc+EAE) compared to the group with only induced EAE (group EAE). The differences between these groups were significant from day 27 (clinical score) and from day 26 (normalized body weight %) post the EAE induction (indicated by the grey area). Data are presented as means ± standard deviations (omitted in naive and EAE for clarity) from 2 independent experiments (n = 12 mice per group in each experiment, i.e. data for 24 animals entering the experiment per group in total are shown). Data for the clinical score of EAE (A) of Tc mice are not visible, this group had no symptoms, overlaid on the naive group in the figure.

Considerable weight loss was noticed in Tc+EAE and EAE mice starting 15 d.e.i. While the weight loss ceased in EAE mice within 2 weeks, in Tc+EAE mice it remained decreased until the end of the experiment, being significantly different from EAE mice from 26 d.e.i. (Fig. 3B). No weight loss was found in both control groups (naive and Tc).
Increased concentrations of all measured serum cytokines were found in Tc+EAE mice
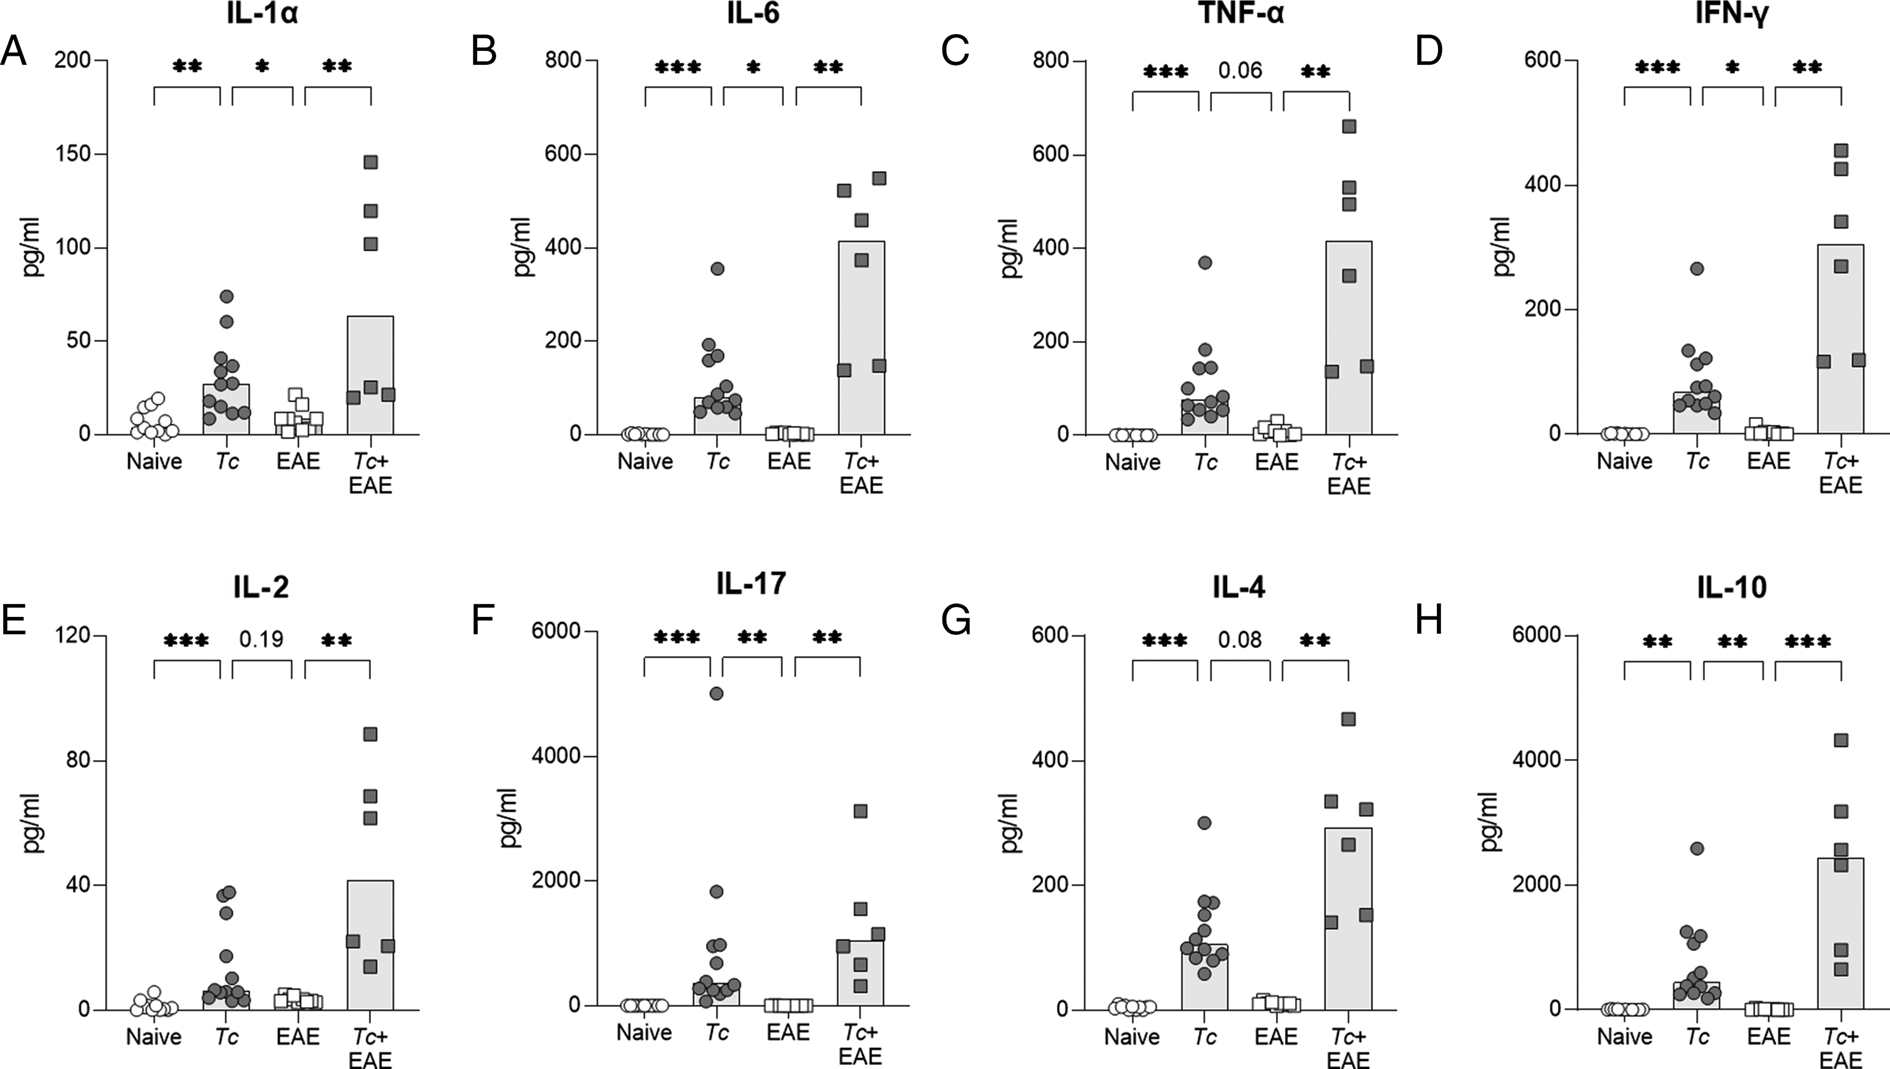
To determine the concentration of cytokines in serum, the CBA method was used, which allows determining the concentration of all cytokines in 1 sample at the same time. The concentrations of all measured cytokines (IL-4, IL-10, IL-1α, IL-6, TNF-α, IFN-γ, IL-2 and IL-17A) were significantly elevated in Tc+EAE mice compared to EAE mice (Fig. 4). Tc mice had higher concentrations of all measured cytokines than naive mice, but when compared to EAE mice, a significant increase was found only for IL-10, IL-1α, IL-6, IFN-γ and IL-17A. Moreover, except for IL-17A, Tc+EAE mice tended to show higher levels of all cytokines compared with Tc mice (Fig. 4).
Serum concentrations of IL-1α (A), IL-6 (B), TNF-α (C), IFN-γ (D), IL-2 (E), IL-17A (F), IL-4 (G) and IL-10 (H) as measured using the BD cytometric bead array (CBA). Individual data are shown along with the group median, Kruskal–Wallis test followed by Dunn's test were used to evaluate the differences between pre-selected groups (naive vs Tc, naive vs EAE, Tc vs EAE, Tc vs Tc+EAE and EAE vs Tc+EAE). Group naive and Tc: n = 12, group EAE: n = 9, group Tc+EAE: n = 6. Significant differences are indicated by asterisks (*P < 0.05, **P < 0.01, ***P < 0.001) or P values are shown. Tc, Toxocara canis, EAE, experimental autoimmune encephalomyelitis.

Tc+EAE mice exhibited increased infiltration of the CNS by CD4+ T cells along with the reduced frequency of Tregs
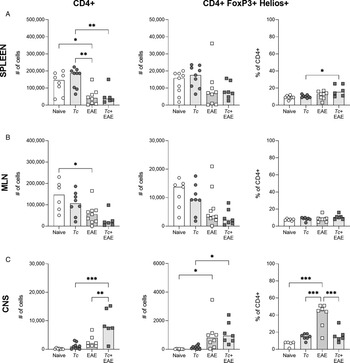
The flow cytometry analysis revealed a decrease in the amount of CD4+ T cells and CD4+FoxP3+Helios+ Tregs in the spleen and MLN of EAE and Tc+EAE mice, but the frequency of Tregs was not strikingly affected in the organs (Fig. 5A and B). On the contrary, significantly more CD4+ T cells were recruited into the CNS of Tc+EAE mice. While the amount of Tregs was similar to EAE mice, their frequency was significantly lower (Fig. 5C) suggesting that other CD4+ T cell subpopulations were enriched in the CNS.
CD4+ T cells and Treg cells (CD4+FoxP3+Helios+) were analysed by flow cytometry in spleen (A), mesenteric lymph node (MLN; B) and central nervous system (CNS; C). Individual data are shown along with the group median, Kruskal–Wallis test followed by Dunn's test were used to evaluate the differences between pre-selected groups (naive vs Tc, naive vs EAE, Tc vs EAE, Tc vs Tc+EAE and EAE vs Tc+EAE). Group naive: n = 6, group Tc: n = 7, group EAE: n = 8, group Tc+EAE: n = 7. Significant differences are indicated by asterisks (*P < 0.05, **P < 0.01, ***P < 0.001). Tc, Toxocara canis, EAE, experimental autoimmune encephalomyelitis.

Discussion
Toxocara canis is a socioeconomically important zoonotic human pathogen. A large percentage of the population has been infected with T. canis (Strube et al., Reference Strube, Raulf, Springer, Waindok, Auer and Bowman2020b), which can have in some cases serious health consequences. These include, e.g. granulomatous hepatitis, myocarditis, nephritis, asthma, retinitis and vitritis, which can result in blindness and other pathologies. Neurodegenerative disorders associated with neurotoxocarosis are also studied (e.g. seizure, schizophrenia, dementia and cognitive deficits) (Ma et al., Reference Ma, Holland, Wang, Hofmann, Fan, Maizels, Hotez and Gasser2018). However, T. canis, like other helminths, also possesses mechanisms that allow long-term survival in the host, preventing pathological manifestations by altering the immune reaction. This could result in concomitant recovery from other pathologies associated with inflammation (Ditgen et al., Reference Ditgen, Anandarajah, Meissner, Brattig, Wrenger and Liebau2014; Maizels and McSorley, Reference Maizels and McSorley2016; Loukas et al., Reference Loukas, Maizels and Hotez2021). This study focused on the impact of a low T. canis larvae infection dose on the course of EAE, and, in the discussion, on the possible (positive) immunomodulatory potential of other helminths.
Our results showed that T. canis infection 5 weeks before EAE induction led to worsening of the clinical symptom score compared to EAE mice without infection. Two doses of 100 L3 larvae each were used for infection to minimize behavioural changes that may be observed when infection with a high dose of larvae or eggs is used (Holland and Cox, Reference Holland and Cox2001; Hamilton et al., Reference Hamilton, Stafford, Pinelli and Holland2006; Janecek et al., Reference Janecek, Waindok, Bankstahl and Strube2017; Strube et al., Reference Strube, Waindok, Raulf, Springer and Bowman2020a). The immune response to infection with 100 larvae was confirmed by detection of TES-specific IgG according to a previous study (Novák et al., Reference Novák, Panská, Macháček, Kolářová and Horák2017). Even with the infection by 2 small doses of 100 larvae each, we can assume that in the chronic phase of the infection a part of the larvae is already located in the CNS (Ollero et al., Reference Ollero, Fenoy, Cuellar, Guillen and del Aguila2008; Fonseca et al., Reference Fonseca, dos Santos, Chieffi, de Paula, Gryschek and Lescano2017). Our data showed that the first symptoms of the disease appeared from day 7 after EAE induction, however, the onset of the majority of symptoms was observed in EAE and Tc+EAE mice from day 14. This is consistent with the previous studies (Wu et al., Reference Wu, Nagano, Asano and Takahashi2010; Bittner et al., Reference Bittner, Afzali, Wiendl and Meuth2014; Bing et al., Reference Bing, Ha, Ahn, Cho, Kim, Park, Yu and Jee2015; Donskow-Lysoniewska et al., Reference Donskow-Lysoniewska, Krawczak, Bocian and Doligalska2018). Similarly, the first weight reduction was noticed in Tc+EAE and EAE mice from day 17. Higher clinical symptom scores and greater weight losses in Tc+EAE compared to EAE mice were visible from day 23 after induction of EAE, and from day 27 (symptom scores) and 26 (weight losses) were statistically significant until the end of the experiment. Our data show that a negative effect of previous infection on the course of EAE was recorded for both parameters studied. This observation markedly contradicts most studies conducted with various helminths or their products (reviewed by Charabati et al., Reference Charabati, Donkers, Kirkland and Osborne2020). In this respect, our data are similar to the results with rTl-gal derived from Toxascaris leonina (Bing et al., Reference Bing, Ha, Ahn, Cho, Kim, Park, Yu and Jee2015). Administration of the galectin resulted in worsening of EAE symptoms, greater demyelination and increased inflammatory infiltration. Surprisingly, the same galectin attenuated clinical symptoms of inflammatory bowel disease in mice (Kim et al., Reference Kim, Cho, Choi, Lee, Ahn, Kim and Yu2010). The mechanism by which rTl-gal exacerbates EAE has not yet been explained in detail. A possible explanation is that treatment with rTl-gal leads to a strong, combined (Th1, Th17, Th2, inflammatory and humoral) immune response to MOG peptide, which may exacerbate the autoimmunity by increasing the production of potentially pathogenic autoantibodies against myelin (Genain et al., Reference Genain, Abel, Belmar, Villinger, Rosenberg, Linington, Raine and Hauser1996; Ohtani et al., Reference Ohtani, Kohyama and Matsumoto2011; Bing et al., Reference Bing, Ha, Ahn, Cho, Kim, Park, Yu and Jee2015).
To better understand the mechanisms of worsening symptoms and weight losses, we measured serum cytokine concentrations using the CBA method. For all cytokines determined, significantly increased levels were measured in Tc+EAE mice compared to EAE mice. For Th2-associated (IL-4) and Treg-associated (IL-10) cytokines, we measured significantly increased serum concentrations in Tc+EAE mice compared to the EAE mice, which is consistent with previous studies (Sewell et al., Reference Sewell, Qing, Reinke, Elliot, Weinstock, Sandor and Fabry2003; Gruden-Movsesijan et al., Reference Gruden-Movsesijan, Ilic, Mostarica-Stojkovic, Stosic-Grujicic, Milic and Sofronic-Milosavljevic2010; Wu et al., Reference Wu, Nagano, Asano and Takahashi2010; Donskow-Lysoniewska et al., Reference Donskow-Lysoniewska, Krawczak and Doligalska2012; Zhu et al., Reference Zhu, Trikudanathan, Zozulya, Sandoval-Garcia, Kennedy, Atochina, Norberg, Castagner, Seeberger, Fabry, Harn, Khoury and Guleria2012; Sofronic-Milosavljevic et al., Reference Sofronic-Milosavljevic, Radovic, Ilic, Majstorovic, Cvetkovic and Gruden-Movsesijan2013; Peon et al., Reference Peon, Ledesma-Soto, Olguin, Bautista-Donis, Sciutto and Terrazas2017). However, the positive immunomodulatory effect of IL-4 and IL-10 in T. canis infections in our study is likely to be suppressed by the action of Th1 (TNF-α, IFN-γ) and Th17 (IL-17, IL-6) cytokines produced at elevated amounts as well. Our data showed that the levels of all these cytokines were also significantly increased in Tc+EAE mice compared to the EAE mice. Increased concentrations of Th17-associated cytokines were similarly described in EAE with subsequent infection with T. crassiceps (IL-17) (Reyes et al., Reference Reyes, Espinoza-Jimenez, Gonzalez, Verdin and Terrazas2011) and H. polygyrus (IL-17, IL-6) (Donskow-Lysoniewska et al., Reference Donskow-Lysoniewska, Krawczak and Doligalska2012). In contrast, infection or administration of products of T. spiralis and T. crassiceps resulted in decreased levels of IL-17 (Sofronic-Milosavljevic et al., Reference Sofronic-Milosavljevic, Radovic, Ilic, Majstorovic, Cvetkovic and Gruden-Movsesijan2013; Radovic et al., Reference Radovic, Gruden-Movsesijan, Ilic, Cvetkovic, Mojsilovic, Devic and Sofronic-Milosavljevic2015; Peon et al., Reference Peon, Ledesma-Soto, Olguin, Bautista-Donis, Sciutto and Terrazas2017) and IL-6 (Gruden-Movsesijan et al., Reference Gruden-Movsesijan, Ilic, Mostarica-Stojkovic, Stosic-Grujicic, Milic and Sofronic-Milosavljevic2010). Our measurements of increased concentrations of Th1-associated cytokines (TNF-α and IFN-γ) also contrast with the decreased concentrations of these cytokines after administration of T. crassiceps products (Reyes et al., Reference Reyes, Espinoza-Jimenez, Gonzalez, Verdin and Terrazas2011; Peon et al., Reference Peon, Ledesma-Soto, Olguin, Bautista-Donis, Sciutto and Terrazas2017) or infection with S. mansoni (La Flamme et al., Reference La Flamme, Ruddenklau and Backstrom2003). Thus, the worsening of clinical symptoms and weight losses may be the result of T. canis infection and its neuroinvasion, together with the presence of anti-myelin pathogenic autoantibodies, and increased concentrations of Th1- and Th17-associated cytokines.
Not surprisingly, we found low levels of serum cytokines in naive mice and EAE mice. Some studies that have measured serum cytokine levels have also measured low levels of cytokines in the uninfected group with EAE (Donskow-Lysoniewska et al., Reference Donskow-Lysoniewska, Krawczak and Doligalska2012) and low level of IL-4 and IFN-γ (Zheng et al., Reference Zheng, Hu, Zhou, Lu, Qiu, Bao and Dai2008). On the other hand, there are studies showing significantly increased levels of all cytokines in EAE mice compared to the control naive mice (Jahan-Abad et al., Reference Jahan-Abad, Karima, Shateri, Baram, Rajaei, Morteza-Zadeh, Borhani-Haghighi, Salari, Nikzamir and Gorji2020). It was also not surprising that we found higher levels of all cytokines in Tc mice compared to naive and EAE mice. The detected cytokine concentrations in Tc mice were lower than in Tc+EAE mice; however, these differences were not statistically significant. This may suggest that the infection with subsequent EAE leads to a further increase in cytokine levels, corresponding to worsening of symptoms and weight losses in Tc+EAE mice.
To further elucidate what is behind the worsening symptomatology in Tc+EAE mice, we focused on the population of CD4+ and Treg cells in the spleen, MLN and CNS, and their role in disease development. In the CNS, a significantly higher number of CD4+ cells was found in Tc+EAE mice compared to the EAE mice, and also compared to Tc mice. This would suggest that the ‘double hit’ caused by T. canis neuroinvasion and subsequent EAE led to infiltration of CD4+ cells into the CNS. However, a surprise was the lower percentage of Tregs in the CD4+ cell population in Tc+EAE mice, suggesting the presence of non-Treg CD4+ cell populations, such as Th1 and Th17, whose pro-inflammatory effects may contribute to CNS damage and subsequent worsening of the EAE course, consistent with the described symptomatology in this group. Similarly, the milder symptomatology in EAE mice may be due to a significantly higher proportion of Tregs in the CD4+ cell population in the CNS, which may be explained by proliferation of Tregs in response to the presence of autoantigen (MOG peptide), which may subsequently reduce the ongoing autoimmune processes. Higher quantity of CD4+ cells (and Tregs) found in the spleen and MLN samples in naive and Tc mice compared to both EAE and Tc+EAE mice could be explained by downregulation of CD4+ T cells and Tregs due to administration of PT during EAE induction. These results suggest that the potential immunomodulatory capacity of T. canis in Tc+EAE mice is likely reduced and overwhelmed by the consequences of neuroinvasion of L3 larvae, and during subsequent induction of EAE, this combination causes worsening of symptomatology with increased cytokine levels and infiltration of pro-inflammatory CD4+ cells. However, this hypothesis needs to be experimentally tested.
Conclusion
The data presented here show a negative effect of T. canis infection on the course of EAE, the mouse model of MS. Specifically, we observed exacerbation of the clinical scores, prolonged weight losses and strikingly elevated serum levels of multiple cytokines, suggesting dysfunction of the immune regulation in Tc+EAE mice. Additionally, these mice harboured significantly more CD4+ T cells of non-Treg phenotype within the affected CNS. Altogether, our results demonstrate that the infection of mice with T. canis worsens the course of subsequently induced EAE. Further studies are urgently needed to reveal the underlying pathological mechanisms and to investigate possible risks for the human population, in which the exposure to T. canis is frequent.
Supplementary material
The supplementary material for this article can be found at https://doi.org/10.1017/S0031182022001238
Data availability
All data are presented within the article or Supplementary materials.
Acknowledgements
We thank Ladislav Drož, Ph.D. and Věra Černá, Ph.D., both from APIGENEX, for providing the MOG peptide and Professor Peter Šebo, Ph.D., Institute of Microbiology, The Czech Academy of Sciences, for providing the pertussis toxin. We thank Jiří Šinkora, Ph.D., BD Czech Republic, for the analysis of the CBA data.
Author's contributions
J. N.: experiment design, execution of experiments, data interpretation, writing article. T. M.: design consultation, statistical analysis, data visualization and interpretation, writing and reviewing article. M. M.: FlowJo analysis. M. K. and K. S.: execution of experiments. V. C.: flow cytometry consultation and data interpretation. L. K.: experiment design, reviewing article. J. H.: experiment design, flow cytometry consultation, reviewing article. P. H.: experiment design, reviewing article.
Financial support
As for Jan Novák, Marie Kostelanská, Kateřina Skulinová, Viktor Černý, Jiří Hrdý and Libuše Kolářová, the study was financially supported by Charles University (GAUK 32915, SVV 360520, SVV 260369, PROGRES Q25, COOPERATIO IMMU 207032). As for Tomáš Macháček, Martin Majer and Petr Horák, the study was financially supported by Charles University (COOPERATIO BIOLOGY, UNCE/SCI/012-204072/2018, SVV 260563/2020).
Conflict of interest
None.
Ethical standards
The experimental design and procedures were approved by the Ethical Committee of the First Faculty of Medicine, Charles University and the Ministry of Education, Youth and Sports (ID: MSMT-21527/2017-10, 10 August 2017). The experiments were performed in strict accordance with institutional guidelines and national/EU animal welfare laws and directives.