EXPERIMENTS, RISK, AND ETHICS
In the years after 9/11, in the wake of the wars in Iraq and Afghanistan, and since the Arab Spring, social scientists have been interested in running experiments in the Middle East and North Africa (MENA) region, and with good reason. Insurgency, refugees, and religious extremism have all been studied before (Fearon and Laitin, Reference Fearon and Laitin2003; Salehyan, Reference Salehyan2008; Iannaccone and Berman, Reference Iannaccone and Berman2006), but experiments on these are a relatively new development (Blair et al., Reference Blair, Fair, Malhotra and Shapiro2013). With governments and non-profit organizations interested in better understanding the needs and preferences of those they wish to serve, social scientists are eager to form mutually beneficial partnerships. Organizations gain practical advice on (for example) how to provide services more effectively, and researchers gather data that will hopefully lead to publications. While experiments are increasingly popular in political science (Morton and Williams, Reference Morton and Williams2010), most are conducted on campus with undergraduate student subjects.
A difficulty arises in that some experimental designs that are standard in U.S. or European laboratories may be culturally unacceptable or even illegal in the places that researchers want to study. For instance, the Public Goods Game and Trust Game have been used to examine willingness to cooperate with those who may or may not reciprocate. In both cases, a subject contributes an amount of money, the experimenter multiplies that amount by some factor, and then subjects receive payoffs. This can be interpreted as the experimenter paying interest, which is prohibited in Islam.Footnote 1
The same can be true of behavioral measures of risk preferences. There are two classes of methods that are employed in experiments: survey responses and incentivized tasks. Surveys have subjects self-report preferences, typically by asking whether the individual considers herself to be more risk seeking or risk averse (Barsky et al., Reference Barsky, Juster, Kimball and Shapiro1997; Wagner et al., Reference Wagner, Frick and Schupp2007). Alternatively, they may ask whether the subject engages in any number of risky activities, like substance use or various sexual behaviors (Weber et al., Reference Weber, Blais and Betz2002). In many instances though, the researcher may require a behavioral measure of risk preferences (Charness et al., Reference Charness, Gneezy and Imas2013). Given the lack of incentives, survey responses to risk questions may differ from how the subject would act in a risky situation. Similarly, survey questions generally lack a frame of reference. A gambler and a miser could each believe themselves to be no more risk seeking or risk averse than would be prudent. Instead, a method is needed that forces the subject to behave in a risky or cautious manner and thus reveals their underlying preferences. In economics, this is typically done with a financially incentivized elicitation task (Holt and Laury, Reference Holt and Laury2002; Lejuez et al., Reference Lejuez, Read, Kahler, Richards, Ramsey, Stuart, Strong and Brown2002; Crosetto and Filippin, Reference Crosetto and Filippin2013, Reference Crosetto and Filippin2015). There are many such possible tasks, but all have a common feature: subjects are given the opportunity to earn a larger amount at the risk of a financial penalty.
However, such methods may be culturally unacceptable or even illegal in MENA countries. Gambling is frowned upon by many religions, if not expressly banned. In Islam, gambling is deemed haram (forbidden). Omitting discussion of the nuance of the actual wording, muslims are not permitted to wager money in the hopes of winning a larger amount.Footnote 2 In some countries, there are formal bans and gamblers can be fined or imprisoned. Even where it is not explicitly illegal, asking subjects to participate in a lottery may be construed as challenging the subject’s faith. That may itself be illegal or otherwise lead to a confrontation with local groups.Footnote 3 Placing subjects and enumerators in legal or even physical jeopardy would constitute more than the minimal risk required by most Institutional Review Board (IRB) standards. Even in Western countries, the occasional IRB is hesitant to approve studies that permit students to gamble, as a matter of student codes of conduct.
Assuming that the incentivized task is not illegal, it may still be unethical. Because of the novelty of the task to subjects in the field, it may not occur to them during the session that the task was against their beliefs. In particular, subjects with little education and low numeracy may not understand that the game is a gamble. They will have engaged in a forbidden activity by accident and may suffer negative psychological and/or social repercussions. In obtaining informed consent, it is the researcher’s responsibility to ensure that subjects fully understand the risks and benefits of participation. It would be unethical and possibly illegal to induce subjects to engage in behavior that would violate their religion, at least in populations that are not accustomed to having their religion challenged or openly discussed (Morton and Rogers, Reference Morton, Rogers and Desposato2016).
Finally, objections to gambling could create a methodological problem. Subjects may refuse to participate on religious grounds. This is a problem, as refusal in this case would be a non-random process. Random selection and assignment are key advantages of experiments, in terms of statistical analysis. If religious beliefs prompt refusal to participate, then the sample would be non-random due to self selection. But worse, if religious beliefs relate to behavior in the experiment or to the treatment, then the results will be biased. For instance, risk preferences are known to correlate with other variables of interest like gender (Croson and Gneezy, Reference Croson and Gneezy2009) and age (Mather et al., Reference Mather, Mazar, Gorlick, Lighthall, Burgeno, Schoeke and Ariely2012). The experiment will suffer threats to internal validity, as well as fail to capture the advantage of running the experiment in the field.
Thus, there is something of a dilemma. Survey methods may not suffice and lottery-based methods may not be permissible. This paper proposes an alternative behavioral measure that uses financial incentives, but meets restrictions on gambling. Specifically, lottery-based methods may be adjusted so that the subject never pays any money and so that the outcomes of risky choices are only how much money will be donated to charity. This keeps choices in the positive domain and the charity always wins. In the pages that follow, I will make the argument that risk preferences extend beyond private consumption in the utility function to include other-regarding behavior. I will discuss two incentivized measures of risk preference and use a laboratory experiment to demonstrate how charitable versions correlate with the traditional tasks and with survey-based methods. Subject to replication with other subject pools, this could provide a tool for researchers to use in the field or where gambling is prohibited.Footnote 4
RISK PREFERENCES AND THIRD PARTIES
Researchers often, explicitly or implicitly, model individuals as holding preferences over risk. When facing a choice between relatively risky and safe options, subjects are assumed to calculate expected utility and then decide based on the degree of risk they are willing to tolerate. However, there is nothing that requires these risk preferences to only pertain to private consumption. In a Constant Relative Risk Aversion (CRRA) utility function, for example, the risk parameter is independent of private consumption levels.
People are generally aware that the choices they make can affect possible outcomes for others. This can be seen in the willingness of some to take costly actions to avoid imposing externalities on peers. Indeed, Montinari and Rancan (Reference Montinari and Rancan2013) find evidence that when individuals make choices that affect both themselves and another, they take fewer risks than they would for just themselves. In particular, subjects are less likely to make investments that have a negative expected payoff.
There is however, conflicting evidence on behavior when subjects make choices on behalf of a third party. Chakravarty et al. (Reference Chakravarty, Harrison, Haruvy and Rutström2011), for instance, present evidence that subjects are less risk averse when acting on behalf of others. In a dictator game environment, Brock et al. (Reference Brock, Lange and Ozbay2013) find that those dictators who sent more to receivers also gave receivers a higher chance to win a lottery (while simultaneously decreasing her own chances). Harrison et al. (Reference Harrison, Lau, Rutström and Tarazona-Gomez2012) find no difference between a subject’s individual risk choice and her decision on behalf of a group, when she does not know the preferences of other group members. When she does know the preferences of others though, she exhibits much more risk aversion. In contrast, MacCrimmon and Wehrung (Reference MacCrimmon and Wehrung1990) find that executives make different choices with company money than they would make for themselves. Vieider et al. (Reference Vieider, Villegas-Palacio, Martinsson and Mejia2016) find that utility curvature is unaffected, when subjects make choices both for themselves and a third party, but that perceptions of large and small probabilities become distorted.
More specific to charity, Null (Reference Null2011) find that subjects spread donations across several similar charities out of risk aversion over the social benefit. Exley (Reference Exley2016) finds that when subjects face a tradeoff between their own payoffs and those going to a charity, they are more averse to charity risk. But when there is no tradeoff, subjects act identically, whether they are choosing for the charity or for themselves. Finally, if Islamic values are primed, muslims donate more to charity (Lambarraa and Riener, Reference Lambarraa and Riener2015).
INCENTIVIZED ELICITATION TECHNIQUES
Within incentivized elicitation techniques, researchers have developed a number of mechanisms, the most common of which are multiple price list (MPL) methods (Binswanger, Reference Binswanger1981). Here, subjects are tasked with choosing between lotteries or sets of lotteries. Subjects reveal preferences by choosing relatively safe or risky options. One such example is the Holt and Laury (Reference Holt and Laury2002) method. Subjects are given 10 decisions to make. In each decision, they must choose between two pairs of lotteries, labeled A and B. For each pair, there are two possible outcomes: a high payoff or a low payoff. Lottery B is a gamble between a very high and very low payoff. Lottery A is a gamble between two outcomes less extreme than those in lottery B. The difference between each decision is the relative likelihood of the high and low payoff.
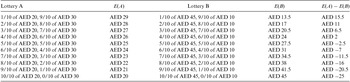
This is the first of the two incentivized tools that I will use, the complete parameterization of which is given in Table 1. This table also presents the expected value of each lottery and the difference in expected values between the two. Lottery A is a gamble between different likelihoods of winning AED 20 or 30, while Lottery B is a gamble between AED 45 and 10.Footnote 5
Multiple Price List Method
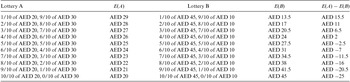
Adapted from Holt and Laury (Reference Holt and Laury2002). AED 1 = $0.27.
Risk preferences can be measured either by the point at which the subject switches from lottery A to lottery B, as a risk neutral subject would always choose the lottery with the higher expected value, or by the total number of safe choices they made. In this experiment, a risk neutral subject would choose Lottery A for the first four decisions and Lottery B thereafter. A risk loving subject would switch sooner than this in hopes of winning the highest payoff, while a risk averse subject would wait longer, as there is less variance between the high and low payoff in lottery A.
An empirical regularity and problem with Holt and Laury (Reference Holt and Laury2002) are that subjects often switch back and forth between the two sets of lotteries. This behavior is difficult to interpret. To circumvent this problem, Bruner (Reference Bruner2011) randomly selects one decision to be paid and emphasizes the incentive compatibility of this in the instructions. Alternatively, Tanaka et al. (Reference Tanaka, Camerer and Nguyen2010) ask subjects at what point they would like to switch between A and B. Another solution that has gained popularity is the method presented in Eckel and Grossman (Reference Eckel and Grossman2008), where subjects make only a single choice between several pairs of lotteries. In each lottery there is a 50–50 chance of either a high payoff or low, but the expected value of each lottery is different. This method is popular for its simplicity, but does not allow us to observe choices over relatively (un)likely options. I will address this issue with MPL methods by analyzing subject choices with two variables: Safe and First. Safe is the number of times the subject selected Lottery A, the lottery with the least variance between the payoffs. First records the first time that the subject switched from choosing Lottery A to Lottery B.
Another criticism of MPL methods of risk elicitation is that they can be difficult for subjects to understand. For instance, in decision 10, some subjects will choose to receive AED 20 for certain, rather than AED 45 for certain. This is of particular concern in low numeracy populations. Dave et al. (Reference Dave, Eckel, Johnson and Rojas2010) argue that in such situations, coarser, but simpler methods are preferable. Even implementations of the simpler (Eckel and Grossman, Reference Eckel and Grossman2008) task can involve more calculations than the subject is comfortable making. For this reason, the second incentivized measure I use is that introduced by Crosetto and Filippin (Reference Crosetto and Filippin2013), namely the Bomb Risk Elicitation Task (BRET).Footnote 6 In this mechanism, subjects are presented with a 10 ×10 grid of boxes. Of these 100 boxes, 99 are empty and one randomly selected box contains a mine. Every second, one box is collected and removed from the screen. The subject may choose to stop at any time. For each box she collects, the subject is paid 0.5 dirham (AED). But if one of the boxes she collects contains the mine, then all of her earnings are erased and she receives nothing.
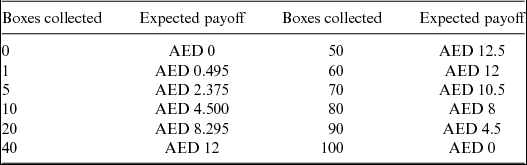
Each box collected represents an additional one percentage point risk of collecting the mine. A subject who stops after 5 seconds has a 5% chance of collecting the mine and receives AED 2.5. A subject who collects 99 boxes has a 99% chance of collecting the mine, but could receive AED 45.5, if all of the boxes are empty. In the analysis, the variable Boxes is the number of seconds the subject waited and thus the number of boxes collected and level of risk tolerance. Table 2 presents the expected payoffs to a subject, if she collects a given number of boxes.
BRET Expected Payoffs
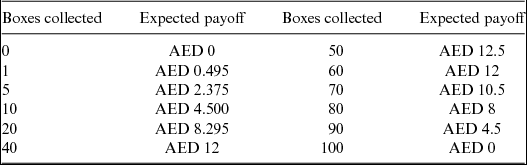
Adapted from Crosetto and Filippin (Reference Crosetto and Filippin2013). AED 1 = $0.27.
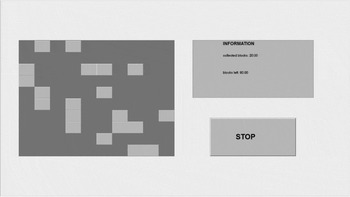
Note that while potential payoffs are linearly increasing, as is risk, expected payoffs reach their maximum at 50 boxes. A risk neutral subject would choose this middle value. Selecting fewer than 50 boxes indicates risk aversion, while choosing more than 50 reflects risk-loving behavior. Further advantages of the BRET over MPL methods beyond its simplicity include the 0–100 risk-seeking scale that it yields, and the unambiguous choices subjects make. More importantly for field researchers, Crosetto and Filippin (Reference Crosetto and Filippin2013) present a version that can be run with just a pencil and paper. A screenshot of the task can be found in the appendix.
METHODS
A total of 109 (muslim and non-muslim) student subjects from a private university in the United Arab Emirates participated in the study over the course of 12 sessions. A detailed description of the subjects can be found in the appendix. All subjects received an AED 30 show up fee and an additional AED 10 for participating in the survey question treatments. In all, subjects earned an average of AED 57.08 (USD 15.47) for sessions that typically lasted less than 30 minutes. On top of this, subjects also donated an average of AED 15.80 (USD 4.30).
In the experimental sessions, 69 subjects participate in one iteration each of the BRET and MPL mechanisms, while the remaining 40 complete the BRET twice. Each time, only one of the two incentivized tasks results in personal earnings.Footnote 7 The results of the other are paid to charity. The subjects know which is for charity and which will be paid in cash. Which is paid and which is for charity is altered between sessions, as is the order and whether they participate in the charity or paid round first. This yields four incentivized treatment conditions: MPL-PAY, MPL-CHARITY, BRET-PAY, and BRET-CHARITY.
Anything a subject earns in a charity round is given to Operation Smile, an organization that provides free surgeries to children around the world who suffer from facial deformities. Subjects are provided with a packet of information about the organization, drawn from the group’s website (attached in the appendix).Footnote 8 To ensure that subjects trust that the experimenter would genuinely make the donation, any interested subject is permitted to observe the experimenter collecting the anonymous data from the computer and paying the amount to the charity online. Subjects are also given a receipt and confirmation number so that they could independently confirm the donation with the organization.
After completing these two incentivized tasks, subjects then take a survey including questions from the Domain Specific Risk Taking (DOSPERT) (Weber et al., Reference Weber, Blais and Betz2002) task and the Health and Retirement Study (HRS). The reduced DOSPERT utilized here contains a series of survey questions on several aspects of risky behavior: financial (6), health/safety (6), and social/recreational (5). Responses are on a seven-point scale and are used to build indices for the three categories. These give us the variables Finance, Health, and Social.
From the HRS, four measures are of interest. Gen Risk asks the subject if they consider themselves to be willing to take risks. A total of 33%, 50%, and 20% are subject responses to questions about a job opportunity. Specifically, how willing would they be to take a new job, if there was a 50–50 chance that it would double their family income or reduce it by 33%/50%/20%, respectively. Full question wording for the DOSPERT and HRS measures can be found in the appendix.
HYPOTHESES
For a charity-based method of incentivized risk preference elicitation to be a suitable substitute for a directly paid method, we must understand how responses to each relate to one another. Previous research suggests that when individuals make risk choices that affect another, as well as themselves, they exhibit greater risk aversion (Montinari and Rancan, Reference Montinari and Rancan2013). In the current setting, the choice being made will only directly affect a charitable organization of high salience to the subjects. This yields the first hypothesis:
-
Hypothesis 1 In MPL rounds, subjects will choose the safe option (A) more often when the results are paid to charity than when they are paid to the subject. In BRET rounds, the charity condition will induce subjects to collect fewer boxes than they otherwise would.
Because of concerns related to repeated measures influencing subjects’ choices, some subjects only complete the BRET and MPL once. As such, we do not observe an individual’s different choices in the same task under the different incentives for these individuals. Even for those who complete the BRET twice analysis, any similarity could be the result of subjects attempting to appear consistent. Instead, evidence in favor of the first hypothesis will come in the distribution of choices. Both paid and charitable measures will have a distribution of subjects exhibiting various degrees of risk tolerance, but in charitable rounds, the distribution will be shifted in the direction of greater risk aversion.
Given the Weber et al. (Reference Weber, Blais and Betz2002) finding that lottery choices tend not to correlate well with risk attitudes in other domains, there is little reason to expect that lotteries with charitable payments will correlate any better or worse. From this:
-
Hypothesis 2 The correlation between any one incentivized measure and any one survey measure will not depend on whether the incentive was cash or charity-based.
It should be noted that this is not simply the null hypothesis, but rather a prediction of no difference.
RESULTS
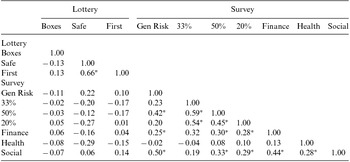
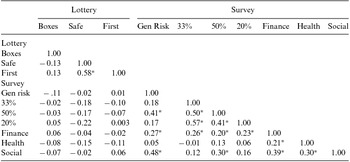
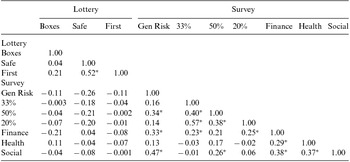
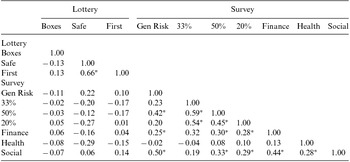
To begin, consistent with Charness et al. (Reference Charness, Gneezy and Imas2013) and Crosetto and Filippin (Reference Crosetto and Filippin2015), none of the survey measures correlate well with the incentivized tasks. As in Weber et al. (Reference Weber, Blais and Betz2002), correlations are weak between types of measures, however they tend to be fairly strong within types. Neither the BRET nor MPL correlate with any of the survey measures, but there is some correlation between the types of survey items. Tables of these correlations are included in the appendix. In support of Exley (Reference Exley2016), they suggest that subjects are not treating the charity rounds as unincentivized survey questions. This is further supported by the level of interest expressed by subjects in receiving confirmation of the donation. Fifty of the 109 subjects requested to witness the donation and/or receive a copy of the organization’s donation receipt. A handful of subjects were so motivated that when chance dictated that they made little or no contribution, they requested after the experiment that their additional earnings go to the charity.
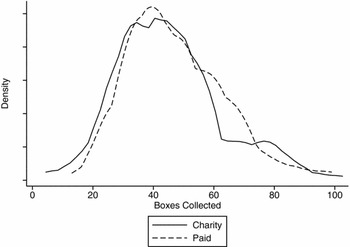
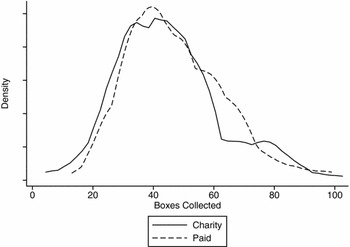
Now consider the incentivized measures and in particular on the effect of paying results to charity rather than directly to the subject. Figure 1 presents the distribution of boxes collected by subjects in the BRET measure. Subject behavior under the two conditions is almost identical. Subjects collected, on average, 47.5 boxes when paid, and 45.1 boxes when choosing on behalf of the organization. This difference is not statistically significant (p < 0.191) and is counter to the expectation that subjects would be more risk averse, when choosing for charity. There is also no significant difference between the distributions (Kolmogorov–Smirnov test, p < 0.682). Among the 40 subjects who completed the BRET both for charity and cash, the difference is even less: 46.8 boxes when paid, 46.3 when for charity (p < 0.446).
Boxes Collected in BRET
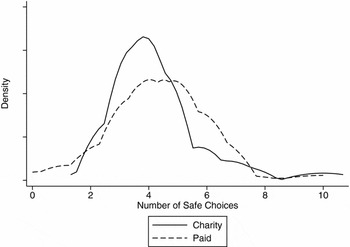
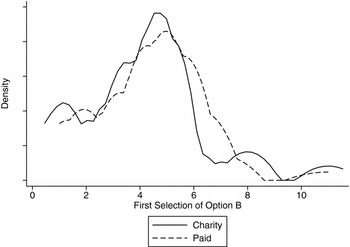
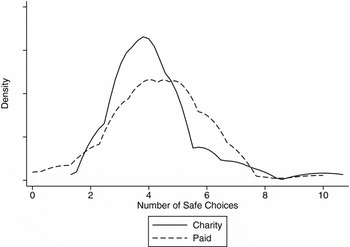
For the multiple price list treatments, Figure 2 shows that paid and charity results are almost identical, as well. When paid, subjects chose the safe option an average of 4.38 times, compared to 4.27 times when donating to charity. The first point at which subjects switched from A to B is also very close, at 4.33 for paid subjects and 4.2 under the charitable condition.Footnote 9 In fact, both differences in means are negligible (p < 0.387 and p < 0.330), as are differences in the distributions (Kolmogorov–Smirnov tests, p < 0.630 and p < 0.760).
Number of Safe Choices in MPL
First Switch From A to B in MPL
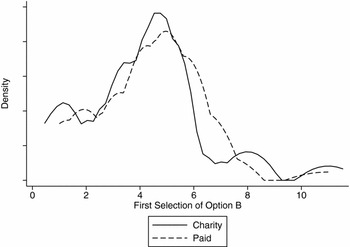
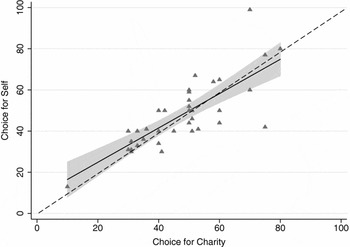
For each task, the charitable and paid tasks generated results with similar means and distributions. This is consistent with Exley (Reference Exley2016) and evidence that charitable measures may be suitable alternatives if the paid measures are not permitted. As further support, Figure 4 presents boxes collected for those subjects who participated in both versions of BRET.
Boxes Collected in BRET Under Both Mechanisms

Choices made under the paid and charitable versions are highly correlated. This again suggests that subjects are treating the two equally, with the caveat that these choices were made within minutes of each other.Footnote 10
DISCUSSION
This study has sought to demonstrate that when subjects make risk choices on behalf of a charity, their choices are comparable to what subjects would choose for themselves. Consistent with Exley (Reference Exley2016), not only are the distributions nearly identical, but so are the mean choices made by subjects. As such, charitable incentives could potentially substitute for direct payments. The standard paid tasks would still be preferred, but the results suggest that the charitable tasks could provide an option where there are legal, cultural, or institutional prohibitions against gambling.
An important caveat is that this is one study, conducted in a lab, with a cosmopolitan subject pool, with one charity. Replication with other subject pools is needed. For research conducted in the field, whether or not an instrument is accepted by subjects/officials can be a function of who the researcher approaches and how they present the request. Some subjects and officials will have no problem with the paid task.Footnote 11 The point being made here is that if some do refuse, it may be possible to offer the charitable task as an alternative. This could save researchers from having the most conservative subjects self-select out of the sample. Further research is needed to examine the relationship between charitable and paid incentives in other domains. This method could prove fruitful for those who want to conduct research in the region, but who have encountered cultural or legal obstacles.
APPENDIX A: DESCRIPTION OF SUBJECTS
The experiment was carried out at a U.S. affiliated university located in the United Arab Emirates. Students at the university come from all over the world and comprise a very diverse campus. Fifty three percent of subjects in the experiment are female with ages ranging from 18 to 24. A total of 43% come from Europe, 29% from Asia, 18% from North America, and 10% from Africa. In all, subjects come from 22 different countries. A total of 12% of subjects self-identify as being Muslim. Based on the nationalities of subjects, the actual proportion is likely higher, as not all subjects answered the question about religion. Though I do not have deeper data on religiosity, muslim students at the university tend to be less conservative, but still obey prayer times, fast during Ramadan, wear traditional (sometimes paired with western) dress, and observe other customs. The proportion of muslim subjects in the experiment is lower than the proportion of muslim students in the school. This is likely because students who are citizens of GCC countries (and therefore all muslim) are more likely to come from very wealthy families and are difficult to incentivize with cash payments.
BRET Treatment Screen Shot

Students at the university tend to be quite familiar with the lab and comfortable with participating in economic experiments. As of when this paper was written, roughly two-thirds of university students had registered with the experimental recruiting system (Hroot), and two-thirds of those had participated in at least one experiment. Since completion of these sessions, the lab has become even more active. The median subject has now participated in four experiments and a handful have participated in as many as 17. The point being made here is that this is not so novel a task for the students that they would fail to recognize the treatments as being lotteries.
APPENDIX B: EXPERIMENTAL INSTRUCTIONS
BRET Instructions
All earnings in this round bill be paid in cash (treatment: donated to the charity Operation Smile. For information about the organization, you have been given a paper handout).
In a moment, you will see a square composed of 100 boxes in a 10 × 10 grid. In one randomly chosen box, there is a mine. All 99 other boxes are free from mines. You do not know where the mine is located, only that the mine could be in any of the 100 boxes, with equal probability.
To assure you that the mine placement is random, if you would like to stay after the experiment, the experimenter will show you the program used to determine the location.
Your task is to choose how many boxes to collect. Once per second, a random box will disappear. This represents a box that you have collected. For each box you collect, AED 0.50 will be added to your earnings (treatment: donated to charity).
If however, you collect the mine, all of your accumulated earnings (from this round only) will be destroyed.
You may halt the collection of boxes at any time, by clicking the “stop” button.
As an example, if you wait 2 seconds and collect two boxes, then you have a 2% chance of collecting the mine. If you wait 100 seconds and collect 100 boxes, you will collect the mine 100% of the time.
In a moment, you will see a countdown on your screen. When the count reaches 0, the task will begin. The first time you complete this task, it will be for practice only. It will not affect your earnings. You will see the number of boxes you collected, but not if whether or not you collected the mine. You will then be brought back to this instruction screen.
The second time you complete this task, the results will be paid in cash (treatment: donated to charity)! If you have any questions, please raise your hand now.
Multiple Price List Instructions
Your earnings from this part of the experiment will be paid to you in cash at the end of the experiment (TREATMENT: donated to charity).
In a moment, you will see a screen with 10 decisions for you to make. Each decision is a paired choice between Option A and Option B. You will record these choices by clicking either Option A or Option B on the computer. One of these decisions will be randomly selected and enforced.
After you have made all of your choices, the computer program will provide two randomly selected numbers between 1 and 10. The first number will determine which of the 10 decisions will be used for payment, and the second number will determine your payoff for the option you chose, A or B, for the particular decision selected. Even though you will make 10 decisions, only one of these will be enforced, but you will not know in advance which decision will be used. Each decision has an equal chance of being used in the end.
(To prove to you that the numbers are indeed random, if you are interested, you may stay after the experiment and I will show you the program used to draw the random numbers.)
For example, consider Decision 1. Here, option A pays AED 30 if the random number is 1, and it pays AED 20 if the random number is 2–10. Option B yields AED 45 if the random number is 1, and it pays AED 10 if the random number is 2–10. The other Decisions are similar, except that as you move down the table, the chances of the higher payoff for each option increase. In fact, for Decision 10 in the bottom row, the random number will not be needed since each option pays the highest payoff for sure, so your choice here is between AED 30 or AED 45.
To summarize, you will make 10 choices: for each decision row, you will have to choose between Option A and Option B. You may choose A for some decision rows and B for other rows, and you may change your decisions and make them in any order. When you are finished, click the “Continue” button on the bottom of the computer screen. You will then receive the first number (which determines which Decision will be enforced) and the second number (which will determine the result).
Are there any questions? Now you may click continue and begin making your choices. Please do not talk with anyone while we are doing this; raise your hand if you have a question.
Charity Information
Below (starting with the picture), you will find a copy of all information that was provided to subjects regarding the charity chosen to receive subjects’ donations. The charity was selected for its global scope, wide appeal, and visibility among those in the subject pool. This was provided as a paper handout to subjects. Subjects were given the ability to verify with the charity that the donation was made. Donations were made in the name of the experimenter, to prevent the organization from soliciting subjects for further contributions.
The following information is taken directly from the Operation Smile website, with minor editing for length only (accessed 30 March 2014). For more information about their organization, activities, and finances, you may visit www.operationsmile.org. For information about the local chapter, visit arabemirates.operationsmile.org.
What is Operation Smile?
Operation Smile is an international children’s medical charity that heals children’s smiles, forever changing their lives. At Operation Smile, we are more than a charity. We are a mobilized force of medical professionals and caring hearts who provide safe, effective reconstructive surgery, and related medical care for children born with cleft lip, cleft palate, and other facial deformities.
Every 3 minutes a child is born with a cleft lip and/or cleft palate. A baby born with a cleft has twice the odds of dying before celebrating their first birthday. The children who survive are often unable to eat, speak, socialize, or smile. In some places, they are shunned and rejected. And in too many cases, their parents cannot afford the surgeries they need to live a productive life. Every child deserves access to safe, quality surgical care. Every child deserves a future filled with hope.

That is where we come in as the largest volunteer-based children’s medical charity providing free cleft surgeries. Since 1982, Operation Smile through the help of dedicated medical volunteers has provided 200,000 free surgeries for children and young adults born with facial deformities. Our work creates a lasting global impact. We train local doctors in developing countries and strengthen healthcare systems so more children in some of the poorest areas in the world can be treated.
As one of the most prominent charities for children in the world, we work in over 60 countries to heal children’s smiles and bring hope for a better future. Together, we are saving children’s lives. Thanks to the generosity and spirit of volunteerism shown by our supporters, we heal thousands of children per year. With your help, how many lives can we change tomorrow?
How Your Support Helps
Every dollar counts. Every gift helps change the life of a child who is suffering from a cleft lip or cleft palate.
Your Gifts Transform Lives
$240 can help provide a cleft lip or cleft palate surgery. This surgery can change a child’s life forever and can take as few as 45 minutes.
Contributions in excess of surgical costs are invested into our sustainability programs, which empower our partner countries to treat more children on their own.
Operation Smile has more than 5,400 credentialed medical volunteers in over 80 countries who are ready to donate their time and talent. Your gifts help send them to countries where desperate children are waiting to be healed.
Your Gifts Help us Teach and Train Healthcare Professionals
We have a worldwide network of teaching hospitals and university partners, including Duke University, The Children’s Hospital of Philadelphia, Penn State Hershey Medical Center, and many others.
Your gifts help support our life-support training programs worldwide. Today, Operation Smile is authorized by the American Heart Association to function as a global and mobile International Training Organization.
Our Physicians’ Training Program (PTP) brings doctors and nurses from around the world to the United States for advanced training in their specialized fields.
Your Gifts Build Awareness and Leadership
Our International Foundations and U.S. Chapters raise funds, recruit volunteers and raise awareness on a grassroots level.
With your support, Operation Smile continues to lead the way in providing free, safe surgeries worldwide, as well as related medical care.
A total of 900 Operation Smile Student Clubs and associations in the United States and around the world build awareness, conduct grassroots fund-raising and educate students about values of commitment, leadership, and volunteerism.
The World Care Program brings children and young adults to the United States and other countries for surgeries that are too complicated to be performed during in-country surgical missions.
APPENDIX C: SURVEY METHOD I
The first of the survey-based measures of risk preferences is adapted from the DOSPERT scale presented by Weber et al. (Reference Weber, Blais and Betz2002). The changes are made to shorten the task, but also to avoid asking about activities that are illegal and/or with which the subjects would not have enough familiarity to make a judgment. For example, subjects from countries that do not collect an income tax would be unequipped to answer a question about cheating on tax returns.
For each of the following statements, please indicate the likelihood that you would engage in the activity. Provide a rating from 1 to 7, 1 meaning “extremely unlikely,” 7 meaning extremely likely.
-
1. ____ Betting a day’s income at the horse races. (F)
-
2. ____ Investing 10% of your annual income in a blue chip (well established and financially sound) stock. (F)
-
3. ____ Investing 10% of your annual income in a very speculative stock. (F)
-
4. ____ Lending a friend an amount of money equivalent to one month’s income. (F)
-
5. ____ Spending money impulsively. (F)
-
6. ____ Taking a job, where you get paid exclusively on a commission basis. (F)
-
7. ____ Not having a smoke alarm in or outside of your bedroom. (H)
-
8. ____ Not wearing a seatbelt in a taxi. (H)
-
9. ____ Not wearing sunscreen, when you sunbathe. (H)
-
10. ____ Ignoring some persistent physical pain by not going to the doctor. (H)
-
11. ____ Eating expired food products that still look and smell okay. (H)
-
12. ____ Walking across the street at a busy intersection, when the crossing light has already turned red. (H)
-
13. ____ Exploring an unknown city or section of town alone. (R)
-
14. ____ Going camping in the wild. (R)
-
15. ____ Taking up mountain climbing or sky diving as a hobby. (R)
-
16. ____ Showing up to a major event (like a concert or game) without a ticket. (R)
-
17. ____ Waiting until the last minute to catch the shuttle between Sama Tower and DTC. (R)
-
18. ____ Openly disagreeing with your boss in front of your coworkers (or with your professor in front of the class). (R).
Note: F = financial, H = health/safety, R = recreational/social.
APPENDIX D: SURVEY METHOD II
The second of the two survey measures begins with a general risk question and then continues with items taken from the HRS, as reported in Barsky et al. (Reference Barsky, Juster, Kimball and Shapiro1997).
-
1. How do you see yourself: are you generally a person who is fully prepared to take risks or do you try to avoid taking risks? (1 means not at all willing, 7 means very willing to take risks)
-
2. Suppose that you are the only income earner in the family, and you have a good job guaranteed to give you your current (family) income every year for life. You are given the opportunity to take a new and equally good job, with a 50–50 chance it will double your (family) income and a 50–50 chance that it will cut your (family) income by a third. Would you take the new job? (1 means most likely not, 7 means most likely would take the job)
-
3. Suppose the chances were 50–50 that it would double your (family) income, and 50–50 that it would cut it in half. Would you take the new job? (1 means most likely not, 7 means most likely would take the job)
-
4. Suppose the chances were 50–50 that it would double your family income and 50–50 that it would cut it by 20% . Would you take the new job? (1 means most likely not, 7 means most likely would take the job)
APPENDIX E: TABLES OF CORRELATIONS
Tables E1 through E3 presents the correlation matrices for the measures. Table E1 presents all of the sessions together, while Tables E2 and E3 include only those subjects who participated in the BRET or MPL for charity, respectively. We also see significant correlation within the types of survey questions. The HRS items correlate well with one another, as do the DOSPERT scale indices, though to a lesser extent. The lack of a relationship between the incentivized and unincentivized measures is not affected by whether the payment was made to charity or the individual. To see this, compare the lower left quadrants in Tables E1 through E3. The patterns are largely the same. All of this is consistent with Charness et al. (Reference Charness, Gneezy and Imas2013), Crosetto and Filippin (Reference Crosetto and Filippin2015), and Weber et al. (Reference Weber, Blais and Betz2002).
Correlation of Risk Measures
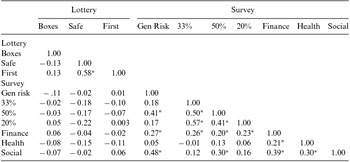
Correlation of Risk Measures (BRET-CHARITY, MPL-PAY)
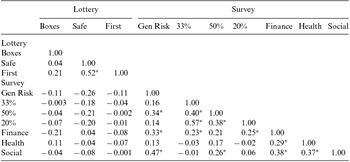
Correlation of Risk Measures (MPL-CHARITY, BRET-PAY)