1. Introduction
This JFM Perspectives article proposes a guided tour through the recent achievements and open prospects of the functional renormalisation group (FRG) formalism applied to the problem of turbulence. Why should the renormalisation group (RG) be useful at all to study turbulence? The very essence of the renormalisation group is to eliminate degrees of freedom in a systematic way, by averaging over fluctuations at all scales, starting from the fundamental description of a system. It thereby provides an effective model ‘from first principles.’ This is precisely what is needed, and often lacking, in many turbulence problems. Indeed, the fundamental equations for fluid dynamics are the Navier–Stokes (NS) equations, but the number of degrees of freedom necessary to describe turbulence grows as Re  $^{9/4}$, where Re is the Reynolds number. Conceiving an appropriate modelling, e.g. devising some reliable effective equations to simplify the problem, is a major goal in many applications. This is of course a very difficult task in general, and the RG certainly offers a valuable tool, at least for idealised situations. The program of applying RG to turbulence started in the early eighties, but it was bound to rely on the tools available at that time, which were based on perturbative expansions. However, there is no small parameter for turbulence, and this program was largely thwarted. The only way out was to introduce in the theoretical description a forcing of the turbulence with a power-law spectrum, i.e. acting at all scales, which is unphysical (Eyink Reference Eyink1994). Results for a physical large-scale forcing are then extrapolated from a certain limit which cannot be justified. This is explained in more detail in § 2.
In the meantime, functional and non-perturbative ways of realising the RG procedure were developed (Wetterich Reference Wetterich1993; Morris Reference Morris1994). They allow one in particular to incorporate from the onset a physical large-scale forcing, and thereby to completely circumvent the inextricable issues posed by perturbative expansions. Indeed, the functional renormalisation group (FRG) offers a very powerful way to implement non-perturbative – yet controlled – approximation schemes, i.e. approximations not requiring the existence of a small parameter. The main scheme consists in the use of an ansatz for a central object in field theory which is called the effective action (see § 3). The construction of this ansatz relies on the fundamental symmetries of the problem. This approach has yielded many results, allowing one to obtain very accurate – although approximate – estimates for various quantities, including whole functions, not only numbers. We present as examples in § 5 the results for the scaling functions for the Burgers equation, and in § 6 the results for the energy spectrum, the second- and third-order structure functions for the NS equations, including an accurate estimate of the Kolmogorov constant. More strikingly, the FRG can also be used to obtain exact results, which are not based on an ansatz. In turbulence, these results are explicit expressions for multi-point Eulerian spatio-temporal correlation functions. They are obtained as an exact limit at large wavenumbers. Given the very few exact results available for three-dimensional (3-D) turbulence, this result is particularly remarkable and is the main topic of this Perspectives article.
Let us emphasise that all the results obtained so far with FRG concern stationary, homogeneous and isotropic turbulence. This Perspectives article is thus focused on this idealised situation. However, the scope of application of FRG is not restricted to this situation. It certainly cannot tackle arbitrarily complicated situations and would be of no use to determine the precise flow configuration around particular airfoils or in some specific meteorological conditions. However, it could be used, and be efficient, for small-scale modelling, as it is designed to provide an effective description, e.g. the form of the coarse-grained effective equations, at any given scale, in particular at the grid scale of large-scale numerical simulations for instance. This direction of research is still in its infancy, and will not be further developed in this contribution, although it definitely maps out a promising program for the future.
Let us also point out that there can be different levels of reading of this Perspectives article. Some parts (e.g. §§ 3, 4, 7.2 and 7.3) are rather technical, with the objective of providing a comprehensive introduction on the basic settings of the FRG for turbulence, and more importantly on the essential ingredients, in particular symmetries, that enter approximation schemes in this framework. Therefore, the underlying hypotheses are clearly stated to highlight the range of validity of the different results presented. Other parts (e.g. §§ 5.3, 5.4, 6.4, 8 and 9) are devoted to illustrating the physical implications of these results, by comparing them with actual data and observations from experiments and direct numerical simulations (DNS). Therefore one may first wish to focus on the concrete outcomes of FRG, deferring the technical aspects.
In detail, this JFM Perspectives article is organised as follows. We start in § 2 by stressing the interest of RG as a means to study turbulence and its different implementations. We explain in § 3.1 how one can represent stochastic fluctuations as a path integral, to arrive at the field theory for turbulence in § 3.2. A key advantage of this formulation is that it provides a framework to deeply exploit the symmetries. We show in § 3.3 how one can derive exact identities relating different correlation functions from symmetries (and extended symmetries) of the field theory. These identities include well-known relations such as the Kármán–Howarth or Yaglom relations (§ 3.4), but are far more general. The FRG formalism is introduced in § 4 with the standard approximation schemes used within this framework. To illustrate the application of this method, we start in § 5 with the Burgers equation as a warm-up example. We then present in § 6 a first important result for NS turbulence ensuing from FRG, which is the existence of a fixed point corresponding to the stationary turbulence forced at large scales, and the determination of the associated statistical properties. The main achievement following from FRG method, addressed in § 7, is the derivation of the formal general expression of multi-point spatio-temporal correlation functions at large wavenumbers. The rest of this Perspectives article is dedicated to illustrating these results, for NS turbulence in § 8, and for passive scalar turbulence in § 9. Another result, concerning the form of the kinetic energy spectrum in the near-dissipation range of scale is briefly mentioned in § 8.4. Finally, the conclusion and perspectives are gathered in § 10.
2. Scale invariance and the RG
2.1. Renormalisation group and turbulence
Let us explain why RG should be useful to study turbulence from the point of view of statistical physics. The aim of statistical physics is to determine from a fundamental theory at the microscopic scale the effective behaviour at the macroscopic scale of the system, comprising a large number  ${\sim }N_A$ of particles (in a broad sense). This requires us to average over stochastic fluctuations (thermal, quantum, etc
 $\ldots$). When the fluctuations are Gaussian, and elementary constituents are non-interacting, central limit theorem applies and allows one to perform the averaging (which is how one obtains e.g. the equation of states of the perfect gas). However, when the system becomes strongly correlated, this procedure fails since the constituents are no longer statistically independent. This problem appeared to be particularly thorny for critical phenomena, and has impeded progress in our theoretical understanding for a long time. Indeed, at a second-order phase transition, the correlation length of the system diverges, which means that all the degrees of freedom are correlated and fluctuations develop at all scales. The divergence of the correlation length leads to the quintessential property of scale invariance, characterised by universal scaling laws, with anomalous exponents, i.e. exponents not complying with dimensional analysis.
The major breakthrough in understanding the physical origin of this anomalous behaviour, and primarily to compute it, was achieved with the RG. Although the RG had already been used under other forms in high-energy physics, it acquired its plain physical meaning from the work of K. Wilson (Wilson & Kogut Reference Wilson and Kogut1974). The RG provides the tool to perform the average over fluctuations, whatever their nature, i.e. eliminates degrees of freedom, even in the presence of strong correlations, and one is able thereby to build the effective theory at large scale from the microscopic one. One of the key features of the RG is that all the useful information is encoded in the RG flow, i.e. in the differential equation describing the change of the system under a change of scale. In particular, a critical point, associated with scale invariance, corresponds in essence to a fixed point of the RG flow. Let us notice that the notion of large scale is relative to the microscopic one, and it depends on the context. For turbulence, the microscopic scale, denoted  $\varLambda ^{-1}$, refers to the scale at which the continuum description of a fluid, in terms of the NS equation, is valid, say the order of the mean free path in the fluid (much smaller than the Kolmogorov scale
 $\eta$). The ‘large’ scale of the RG then refers to typical scales at which the behaviour of the fluid is observed, i.e. inertial or dissipation ranges, thus including the usual ‘small’ scales of turbulence.
The analogy between critical phenomena and turbulence is obvious, and was early pointed out in Nelkin (Reference Nelkin1974), and later refined in e.g. (Eyink & Goldenfeld Reference Eyink and Goldenfeld1994). Indeed, when turbulence is fully developed, one observes in the inertial range universal behaviours, described by scaling laws with anomalous critical exponents, akin to an equilibrium second-order phase transition. As the RG had been so successful in the latter case, it early arose as the choice candidate to tackle the former. Concomitantly, the RG was extended to study not only the equilibrium but also the dynamics of systems (Martin, Siggia & Rose Reference Martin, Siggia and Rose1973; de Dominicis Reference de Dominicis1976; Janssen Reference Janssen1976), and the first implementations of the ‘dynamical RG’ to study turbulence date back to the early eighties (Forster, Nelson & Stephen Reference Forster, Nelson and Stephen1977; DeDominicis & Martin Reference DeDominicis and Martin1979; Fournier & Frisch Reference Fournier and Frisch1983; Yakhot & Orszag Reference Yakhot and Orszag1986). However, the formulation of the RG has remained intimately linked with perturbative expansions, relying on the existence of a small parameter. This small parameter is generically chosen as the distance  $\varepsilon = d_c-d$ to an upper critical dimension
 $d_c$, which is the dimension where the fixed point associated with the phase transition under study becomes Gaussian, and the interaction coupling vanishes. In the paradigmatic example of the
 $\phi ^{4}$ theory which is the name of the field theory describing the second-order phase transition in the Ising universality class, the interaction coupling
 $g$ has a scaling dimension
 $L^{4-d}$. Thus it vanishes in the
 $L\to \infty$ limit for
 $d\geq d_c=4$, which means that fluctuations become negligible and the mean-field approximation suffices to provide a reliable description. The Wilson–Fisher fixed point describing the transition below
 $d_c$ can then be captured by a perturbative expansion in
 $\varepsilon = d_c-d$ and the coupling
 $g$.
In contrast, in turbulence, the ‘interaction’ is the nonlinear advection term, whose ‘coupling’ is unity, i.e. it is not small, and does not vanish in any dimension. Thus, one lacks a small parameter to control perturbative expansion. The usual strategy has been to introduce an artificial parameter  $\varepsilon$ through a forcing with power-law correlations behaving in wavenumber space as
 $p^{4-d-\varepsilon }$, i.e. applying a forcing on all scales, which is unphysical (Eyink Reference Eyink1994). (Note that the letter
 $p$ is used to denote a wavenumber throughout this Perspectives article. The pressure is denoted with a letter
 ${\rm \pi}$ to avoid any confusion.) Fully developed turbulence in
 $d=3$ should then correspond to an infrared (IR) dominated spectrum of the stirring force, as occurs for
 $\varepsilon \geq 2$, hence for large values for which the extrapolation of the perturbative expansions is fragile. Moreover, one finds an
 $\varepsilon$-dependent fixed point, with an energy spectrum
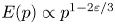 $E(p)\propto p^{1-2\varepsilon /3}$. The value corresponding to the Kolmogorov 1941 theory (denoted K41 in the following) is recovered for
 $\varepsilon =4$, but this value should somehow freeze for
 $\varepsilon$ larger than 4, and such a freezing mechanism can only be invoked within the perturbative analysis (Fournier & Frisch Reference Fournier and Frisch1983). In fact, the situation is even worse since it was recently shown that the turbulence generated by a power-law forcing or by a large-scale forcing is simply different (it corresponds to two distinct fixed points of the RG, in particular the latter is intermittent whereas the former is not for any value of
 $\varepsilon$ including
 $\varepsilon =4$) (Fontaine et al. Reference Fontaine, Tarpin, Bouchet and Canet2022). Therefore, NS turbulence with a large-scale forcing simply cannot be extrapolated from the setting with power-law forcing. Not only does recovering the K41 spectrum turn out to be difficult within this framework, but the first RG analyses also failed to capture the sweeping effect (Chen & Kraichnan Reference Chen and Kraichnan1989; Yakhot, Orszag & She Reference Yakhot, Orszag and She1989; Nelkin & Tabor Reference Nelkin and Tabor1990), and led to the conclusion that one should go to a quasi-Lagrangian framework to obtain a reliable description (L'vov & Procaccia Reference L'vov and Procaccia1995; L'vov, Podivilov & Procaccia Reference L'vov, Podivilov and Procaccia1997). However, the difficulties encountered were severe enough to thwart progress in this direction. We refer to Smith & Woodruff (Reference Smith and Woodruff1998), Adzhemyan, Antonov & Vasil'ev (Reference Adzhemyan, Antonov and Vasil'ev1999) and Zhou (Reference Zhou2010) for reviews of these developments.
In the meantime, a novel formulation of the RG has emerged, which allows for non-perturbative approximation schemes, and thereby bypasses the need for a small parameter. The FRG is a modern implementation of Wilson's original conception of the RG (Wilson & Kogut Reference Wilson and Kogut1974). It was formulated in the early nineties (Wetterich Reference Wetterich1993; Ellwanger Reference Ellwanger1994; Morris Reference Morris1994), and widely developed since then (Berges, Tetradis & Wetterich Reference Berges, Tetradis and Wetterich2002; Kopietz, Bartosch & Schütz Reference Kopietz, Bartosch and Schütz2010; Delamotte Reference Delamotte2012; Dupuis et al. Reference Dupuis, Canet, Eichhorn, Metzner, Pawlowski, Tissier and Wschebor2021). One of the noticeable features of this formalism is its versatility, as testified by its wide range of applications, from high-energy physics (quantum chromodynamics and quantum gravity) to condensed matter (fermionic and bosonic quantum systems) and classical statistical physics, including non-equilibrium classical and quantum systems or disordered ones. We refer the interested reader to Dupuis et al. (Reference Dupuis, Canet, Eichhorn, Metzner, Pawlowski, Tissier and Wschebor2021) for a recent review. This has led to fertile methodological transfers, borrowing from one area to the other. The FRG was moreover promoted to a high-precision method, since it was shown to yield, for the archetypical three-dimensional Ising model, results for the critical exponents competing with the best available estimates in the literature (Balog et al. Reference Balog, Chaté, Delamotte, Marohnić and Wschebor2019), and to yield, for the  ${{O}}(N)$ models in general, the most precise estimates for the critical exponents (De Polsi et al. Reference De Polsi, Balog, Tissier and Wschebor2020; De Polsi, Hernández-Chifflet & Wschebor Reference De Polsi, Hernández-Chifflet and Wschebor2021).
The FRG has been applied to study turbulence in several works (Tomassini Reference Tomassini1997; Mejía-Monasterio & Muratore-Ginanneschi Reference Mejía-Monasterio and Muratore-Ginanneschi2012; Barbi & Münster Reference Barbi and Münster2013; Canet, Delamotte & Wschebor Reference Canet, Delamotte and Wschebor2016; Canet et al. Reference Canet, Rossetto, Wschebor and Balarac2017; Tarpin, Canet & Wschebor Reference Tarpin, Canet and Wschebor2018; Tarpin et al. Reference Tarpin, Canet, Pagani and Wschebor2019; Pagani & Canet Reference Pagani and Canet2021), including a study of decaying turbulence within a perturbative implementation of the FRG (Fedorenko, Doussal & Wiese Reference Fedorenko, Doussal and Wiese2013). This method has turned out to be fruitful in this context, which is the motivation for this Perspectives article.
2.2. Hydrodynamical equations
The starting point of field-theoretical methods is a ‘microscopic model.’ For fluids, this model is the fundamental hydrodynamical description provided by the NS equation
 \begin{equation} \partial_t {{v}}_\alpha+ {{v}}_\beta \partial_\beta {{v}}_\alpha={-}\frac 1\rho \partial_\alpha {\rm \pi}+\nu \nabla^{2} {{v}}_\alpha+f_\alpha, \end{equation}
where the velocity field  $\boldsymbol {v}$, the pressure field
 ${\rm \pi}$ and the external force
 $\boldsymbol {f}$ depend on the space–time coordinates
 $(t,\boldsymbol {x})$, and with
 $\nu$ the kinematic viscosity and
 $\rho$ the density of the fluid. We focus in this review on incompressible flows, satisfying
 \begin{equation} \partial_\alpha {{v}}_\alpha = 0. \end{equation}
The external stirring force is introduced to maintain a stationary turbulent state. Since the small-scale (i.e.  $\ell \ll L$, that is inertial and dissipative) properties are expected to be universal with respect to the large-scale forcing, it can be chosen as a stochastic force, with a Gaussian distribution, of zero average and covariance
 \begin{equation} \langle f_\alpha(t,\boldsymbol{x})f_\beta(t',\boldsymbol{x}')\rangle=2 \delta(t-t'){N}_{\alpha \beta}\left(\frac{|\boldsymbol{x}-\boldsymbol{x}'|}{L}\right), \end{equation}
where  $\boldsymbol{\mathsf{N}}$ is concentrated around the integral scale
 $L$, such that it models the most common physical situation, where the energy is injected at large scales. This is one of the great advantages of the FRG approach compared with perturbative RG: it can incorporate any functional form for the forcing, and not necessarily a power law. Hence, one can consider a large-scale forcing, and therefore completely bypass the difficulties encountered in perturbative approaches which arise from trying to access the physical situation as an ill-defined limit from a power-law forcing.
We are also interested in a passive scalar field  $\theta (t,\boldsymbol {x})$ advected by a turbulent flow. The dynamics of the scalar is governed by the advection–diffusion equation
 \begin{equation} \partial_{t}\theta +{{v}}_\beta \partial_{\beta}\theta - \kappa_\theta \nabla^{2}\theta = f_\theta, \end{equation}
where  $\kappa _\theta$ is the molecular diffusivity of the scalar, and
 $f_\theta$ is an external stirring force acting on the scalar, which can also be chosen to be Gaussian distributed with zero mean and covariance
 \begin{equation} \langle f_\theta(t,\boldsymbol{x})f_\theta(t',\boldsymbol{x}')\rangle=2 \delta(t-t')M\left(\frac{|\boldsymbol{x}-\boldsymbol{x}'|}{L_\theta}\right), \end{equation}
with  $L_\theta$ the integral scale of the scalar.
Finally, we consider a simplified model of turbulence, introduced by Burgers (Reference Burgers1948), which describes the dynamics of a 1-D compressible randomly stirred fluid. The Burgers equation reads
 \begin{equation} \partial_t {{v}} + {{v}} \partial_x {{v}} = \nu \partial_x^{2} {{v}} + f , \end{equation}
and can be interpreted as a model for fully compressible hydrodynamics, or the pressureless NS equation (see Bec & Khanin Reference Bec and Khanin2007 for a review). Here,  $f$ is again a random Gaussian force with covariance
 \begin{equation} \langle f(t,x)f(t',x')\rangle=2 \delta(t-t')D(x-x'). \end{equation}
It corresponds to model C of Forster et al. (Reference Forster, Nelson and Stephen1977). In fact, there exists an exact mapping between the Burgers equation and the Kardar–Parisi–Zhang (KPZ) equation which describes the kinetic roughening of a stochastically growing interface (Kardar, Parisi & Zhang Reference Kardar, Parisi and Zhang1986). The KPZ equation gives the time evolution of the height field  $h(t,\boldsymbol {x})$ of a
 $(d-1)$-dimensional interface growing in a
 $d$-dimensional space as
 \begin{equation} \partial_t h = \nu \boldsymbol{\nabla}^{2} h + \dfrac \lambda 2 \left(\boldsymbol{\nabla} h\right)^{2} + \eta , \end{equation}
and has become a fundamental model in statistical physics for non-equilibrium scaling phenomena and phase transitions, akin to the Ising model at equilibrium (Halpin-Healy & Zhang Reference Halpin-Healy and Zhang1995; Krug Reference Krug1997; Takeuchi Reference Takeuchi2018). For the standard KPZ equation,  $\eta$ is interpreted as a microscopic (small-scale) noise which is delta correlated also in space
 \begin{equation} \langle \eta(t,\boldsymbol{x})\eta(t',\boldsymbol{x}')\rangle=2 D\delta(t-t')\delta^{d}(\boldsymbol{x}-\boldsymbol{x}'), \end{equation}
but it can be generalised to include a long-range noise  $D(|\boldsymbol {x}-\boldsymbol {x}'|)$. Defining the velocity field
 $\boldsymbol {v} = -\lambda \boldsymbol {\nabla } h$, one obtains from (2.8) the
 $d$-dimensional generalisation of the Burgers equation (2.6) for a potential flow, with forcing
 $\boldsymbol {f}=-\lambda \boldsymbol {\nabla } \eta$.
Equations (2.1), (2.4) and (2.6) all yield for some parameters a turbulent regime, where the velocity, pressure or scalar fields undergo rapid and random variations in space and time. One must account for these fluctuations to build a statistical theory of turbulence. A natural way to achieve this is via a path integral, which includes all possible trajectories weighted by their respective probability. How to write such a path integral is explained in § 3.1.
3. Field-theoretical formalism for turbulence
3.1. Path integral representation of a stochastic dynamical equation
The random forcing in the stochastic partial differential equations (2.1), (2.4) and (2.6) acts as a noise source, and thus these stochastic equations are formally equivalent to a Langevin equation. The fundamental difference is that, in usual Langevin description, the origin of the noise lies at the microscopic scale, it is introduced to model some microscopic collision processes, and one is usually interested in the statistical properties of the system at large scales. In the stochastic NS equation, the randomness is introduced at the integral scale, and one is interested in the statistical properties of the system at small scales (but large with respect to the microscopic scale  $\varLambda$).
Despite this conceptual difference, in both cases, the dynamical fields are fluctuating ones, and there exists a well-known procedure to encompass all the stochastic trajectories within a path integral, which is the Martin–Siggia–Rose–Janssen–de Dominicis (MSRJD) formalism, (Martin et al. Reference Martin, Siggia and Rose1973; de Dominicis Reference de Dominicis1976; Janssen Reference Janssen1976). The idea is simple, and since it is the starting point of all the subsequent analysis, it is useful to describe the procedure in the simplest case of a scalar field  $\varphi (t,\boldsymbol {x})$, following the generic Langevin equation
 \begin{equation} \partial_t \varphi(t,\boldsymbol{x}) ={-}{\mathcal{F}}[\varphi(t,\boldsymbol{x})] + \eta (t,\boldsymbol{x}) , \end{equation}
where  ${\mathcal {F}}$ represents the deterministic forces and
 $\eta$ the stochastic noise.
 ${\mathcal {F}}$ is a functional of the fields and their spatial derivatives. The noise has a Gaussian distribution with zero average and a correlator of the form
 \begin{equation} \langle \eta(t,\boldsymbol{x})\eta(t',\boldsymbol{x}')\rangle= 2 \delta(t-t') D(|\boldsymbol{x}-\boldsymbol{x}'|). \end{equation}
The probablity distribution of the noise is thus given by
 \begin{equation} {\mathcal{P}}[\eta] = {\mathcal{N}} \exp\left(-\dfrac{1}{4}\int_{t,\boldsymbol{x},\boldsymbol{x}'} \eta(t,\boldsymbol{x})D^{{-}1}(|\boldsymbol{x}-\boldsymbol{x}'|)\eta(t,\boldsymbol{x}') \right) , \end{equation}
with  ${\mathcal {N}}$ a normalisation constant. Note that the derivation we present can be generalised to include temporal correlations, or a field dependence into the noise correlations (3.2). The path integral representation of the stochastic equation is obtained in the following way. The probability distribution of the trajectories of the field follows from an average over the noise as
 \begin{equation} {\mathcal{P}}[\varphi] = \int {\mathcal{D}} \eta {\mathcal{P}}[\eta] \delta(\varphi-\varphi_{\eta}) , \end{equation}
where  $\varphi _\eta$ is a solution of (3.1) for a given realisation of
 $\eta$. A change of variable allows one to replace the constraint
 $\varphi -\varphi _\eta =0$ by the explicit equation of motion
 \begin{equation} {\mathcal{G}}[\varphi(t,\boldsymbol{x})] = 0 = \partial_t \varphi(t,\boldsymbol{x}) +{\mathcal{F}}[\varphi(t,\boldsymbol{x})] - \eta (t,\boldsymbol{x}) , \end{equation}
which introduces the functional Jacobian  ${\mathcal {J}}[\varphi ] = |{\delta {\mathcal {G}}}/{\delta \varphi }|$. (Two remarks are in order here. First, the existence and uniqueness of the solution of (3.1) has been implicitly assumed. Actually, only a solution in a weak sense is required. For the NS equation, even the existence and uniqueness of weak solutions is a subtle issue from a mathematical viewpoint, and uniqueness may not hold in some cases (Buckmaster & Vicol Reference Buckmaster and Vicol2019). However, uniqueness is not strictly required in this derivation, in the sense that for a typical set of initial conditions, there may exist a set of non-unique velocity configurations, provided they are of zero measure. Second, the expression of the Jacobian
 ${\mathcal {J}}[\varphi ]$ depends on the discretisation of the Langevin equation (3.1). In Ito's scheme,
 ${\mathcal {J}}$ is independent of the fields and can be absorbed in the normalisation of
 ${\mathcal {P}}[\varphi ]$, while in Stratonovich's convention, it depends on the fields, and it can be expressed introducing two Grassmann anti-commuting fields
 $\psi$ and
 $\bar \psi$ as
 \begin{equation} {\mathcal{J}}[\varphi]= \left|{\rm det}\frac{\delta{\mathcal{G}}(t,\boldsymbol{x})}{\delta\varphi(t',\boldsymbol{x}')}\right|= \int {\mathcal{D}}\psi {\mathcal{D}}\bar\psi \exp\left({\int_{t,t',\boldsymbol{x},\boldsymbol{x}'} \bar\psi \frac{\delta {\mathcal{G}}}{\delta \varphi} \psi}\right). \end{equation}
This representation just follows from Gaussian integration of Grassmann variables, which yields the determinant of the operator in the quadratic form (here  ${\delta {\mathcal {G}}}/{\delta \varphi }$) rather than its inverse, as for standard (non-Grassmann) variables (Zinn-Justin Reference Zinn-Justin2002). For an additive noise, which means that the noise part in (3.1) and its covariance (3.2) do not depend on the field
 $\varphi$, the statistical properties of the system are not sensitive to the choice of the discretisation scheme, and both the Ito and Stratonovich conventions yield the same results. We shall here mostly use Ito's discretisation for convenience and omit the Jacobian contribution henceforth.) This leads to
 \begin{equation} {\mathcal{P}}[\varphi] = \int {\mathcal{D}} \eta {\mathcal{P}}[\eta]{\mathcal{J}}[\varphi] \delta( {\mathcal{G}}[\varphi]) . \end{equation}
One can then use the Fourier representation of the functional Dirac deltas in (3.7), e.g.  $\delta (\psi ) = \int {\mathcal {D}}\psi \exp ({-{\rm i} \int \bar \varphi \psi })$, where the conjugate Fourier variable is now a field, denoted with an overbar, and is called the auxiliary field, or response field. Thus, introducing the auxiliary field
 $\bar \varphi$ in (3.7) yields
 \begin{equation} {\mathcal{P}}[\varphi] = \int {\mathcal{D}} \eta {\mathcal{P}}[\eta] {\mathcal{D}}\bar\varphi \exp\left({-{\rm i}\int_{t,\boldsymbol{x}} \bar \varphi {\mathcal{G}}[\varphi]}\right) = \int {\mathcal{D}} \bar\varphi \exp({-{\mathcal{S}}[\varphi,\bar\varphi]}). \end{equation}
The second equality stems from the integration over the Gaussian noise  $\eta$, resulting in the action
 \begin{equation} {\mathcal{S}}[\varphi,\bar\varphi] = {\rm i} \int_{t,\boldsymbol{x}} \left\{ \bar\varphi \left(\partial_t\varphi +{\mathcal{F}}[\varphi] \right) \right\} + \int_{t,\boldsymbol{x},\boldsymbol{x}'} \bar \varphi(t,\boldsymbol{x}) D(|\boldsymbol{x}-\boldsymbol{x}'|) \bar\varphi(t,\boldsymbol{x}') . \end{equation}
One usually absorbs the complex  $i$ into a redefinition of the auxiliary field
 $\bar \varphi \to -{\rm i}\bar \varphi$. The action resulting from the MSRJD procedure exhibits a simple structure. The response field appears linearly as a Lagrange multiplier for the equation of motion, while the characteristics of the noise, namely its correlator, are encoded in the quadratic term in
 $\bar \varphi$.
The path integral formulation offers a simple way to compute all the correlation and response functions of the model. Their generating functional is defined by
 $$\begin{gather} {\mathcal{Z}}[J,\bar{J}] = \left\langle \exp\left({\int_{t,\boldsymbol{x}} \left\{ J\varphi+\bar{J}\overline{\varphi} \right\}}\right)\right\rangle = \int {\mathcal{D}}\varphi {\mathcal{P}}[\varphi] \exp\left({\int_{t,\boldsymbol{x}} \left\{ J\varphi+\bar{J}\overline{\varphi}\right\}}\right) \nonumber\\ = \int{\mathcal{D}}\bar\varphi {\mathcal{D}}\varphi \exp\left({-{\mathcal{S}}[\varphi,\bar\varphi]+ \int_{t,\boldsymbol{x}} \left\{ J\varphi+\bar{J}\overline{\varphi}\right\}}\right), \end{gather}$$
where  $J,\bar {J}$ are the sources for the fields
 $\varphi,\bar \varphi$ respectively. Correlation functions are obtained by taking functional derivatives of
 ${\mathcal {Z}}$ with respect to the corresponding sources, e.g.
 \begin{equation} \left\langle \varphi(t,\boldsymbol{x}) \right\rangle= \frac{\delta {\mathcal{Z}}}{\delta J(t,\boldsymbol{x})} , \end{equation}
and functional derivatives with respect to response sources generate response functions (i.e. response to an external drive), hence the name ‘response fields.’ We shall henceforth use ‘correlations’ in a generalised sense including both correlation and response functions. In equilibrium statistical mechanics,  ${\mathcal {Z}}$ embodies the partition function of the system, while in probability theory, it is called the characteristic function, which is the generating function of moments.
One usually also considers the functional  ${\mathcal {W}} = \ln {\mathcal {Z}}$, which is the analogue of a Helmholtz free energy in the context of equilibrium statistical mechanics. In probability theory, it is the generating function of cumulants. When fields rather than variables are involved, the cumulants are generalised to connected correlation functions, and hence
 ${\mathcal {W}}$ is the generating functional of connected correlation functions, for instance,
 \begin{equation} \left\langle \varphi(t,\boldsymbol{x})\varphi(t',\boldsymbol{x}')\right\rangle_c \equiv \left\langle \varphi(t,\boldsymbol{x})\varphi(t',\boldsymbol{x}')\right\rangle - \left\langle \varphi(t,\boldsymbol{x})\right\rangle \left\langle \varphi(t',\boldsymbol{x}')\right\rangle = \frac{\delta {\mathcal{W}}}{\delta J(t,\boldsymbol{x})\delta J(t',\boldsymbol{x}')} . \end{equation}
More generally, one can obtain a multi-point (denoted n-point in the following, where n refers to the number of fields involved) generalised connected correlation function  ${\mathcal {W}}^{(n)}$ by taking
 $n$ functional derivatives with respect to either
 $J$ or
 $\bar J$ evaluated at
 $n$ different space–time points
 $(t_i,\boldsymbol {x}_i)$ as
 \begin{equation} {\mathcal{W}}^{(n)}(t_1,\boldsymbol{x}_1,\ldots,t_n,\boldsymbol{x}_n) = \frac{\delta^{n} {\mathcal{W}}}{\delta {\mathcal{J}}_{i_1}(t_1,\boldsymbol{x}_1)\cdots \delta {\mathcal{J}}_{i_{n}}(t_{n},\boldsymbol{x}_n)} , \end{equation}
where  ${\mathcal {J}} = (J,\bar J)$ and hence
 $i_k\in \{1,2\}$. It is also useful to introduce another notation
 ${\mathcal {W}}^{(\ell,m)}$, which specifies that the
 $\ell$ first derivatives are with respect to
 $J$ and the
 $m$ last to
 $\bar J$, that is
 \begin{align} {\mathcal{W}}^{(\ell,m)}(t_1,\boldsymbol{x}_1,\ldots,t_{\ell+m},\boldsymbol{x}_{\ell+m}) = \frac{\delta^{\ell+m} {\mathcal{W}}}{\delta J(t_1,\boldsymbol{x}_1)\cdots \delta J(t_\ell,\boldsymbol{x}_\ell)\delta \bar J(t_{\ell+1},\boldsymbol{x}_{\ell+1})\cdots \delta \bar J(t_{\ell+m},\boldsymbol{x}_{\ell+m})}. \end{align}
A last generating functional which plays a central role in field theory and in the FRG framework is the Legendre transform of  ${\mathcal {W}}$, i.e. the analogue of the Gibbs free energy in equilibrium statistical mechanics, defined as
 \begin{equation} \varGamma[\langle\varphi\rangle,\langle\bar\varphi\rangle] = {\sup}_{\left\{J,\bar J\right\}} \left[\int_{t,\boldsymbol{x}} \left\{ J \langle \varphi\rangle + \bar{J} \langle \bar\varphi\rangle \right\} -{\mathcal{W}}[J,\bar{J}] \right]. \end{equation}
In field theory,  $\varGamma$ is called the effective action, it is a functional of the average fields, defined with the usual Legendre conjugate relations
 \begin{equation} \langle \varphi(t,\boldsymbol{x})\rangle = \frac{\delta {\mathcal{W}}}{\delta J(t,\boldsymbol{x})},\quad J(t,\boldsymbol{x})\ = \frac{\delta \varGamma}{\delta \langle \varphi(t,\boldsymbol{x})\rangle}, \end{equation}
and similarly for the response fields. From a field-theoretical viewpoint,  $\varGamma$ is the generating functional of one-particle-irreducible correlation functions, which are obtained by taking functional derivatives of
 $\varGamma$ with respect to average fields
 \begin{equation} {\varGamma}^{(n)}(t_1,\boldsymbol{x}_1,\ldots,t_n,\boldsymbol{x}_n) = \frac{\delta^{n} {\varGamma}}{\delta {\varPsi}_{i_1}(t_1,\boldsymbol{x}_1)\cdots \delta {\varPsi}_{i_{n}}(t_{n},\boldsymbol{x}_n)} , \end{equation}
where  ${\varPsi } = (\langle \varphi \rangle,\langle \bar \varphi \rangle )$ and
 $i_k\in \{1,2\}$. They are also denoted
 ${\varGamma }^{(\ell,m)}$ conforming to the definition (3.14). The one-particle-irreducible correlation functions are also simply called vertices, because in diagrammatic representations à la Feynman they precisely correspond to the vertices of the diagrams, as for instance in figure 1. An important point to be highlighted is that both sets of correlation functions
 $\varGamma ^{(n)}$ and
 ${\mathcal {W}}^{(n)}$ contain the exact same information on the statistical properties of the model. Each set can be simply reconstructed from the other via a sum of tree diagrams.
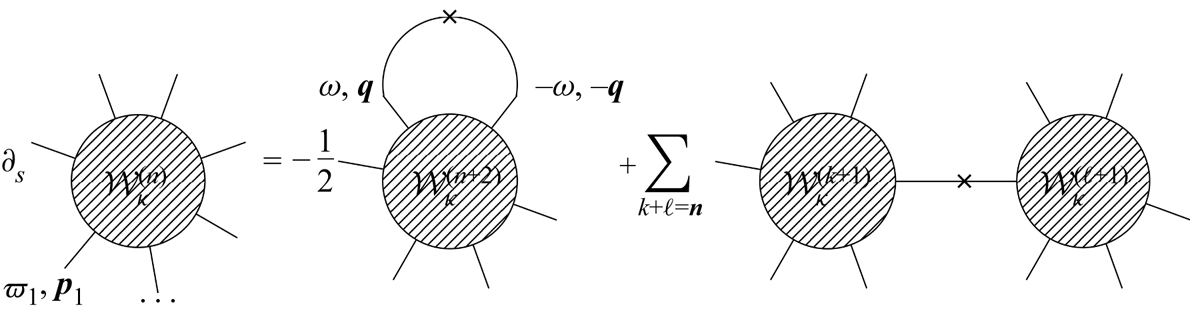
Diagrammatic representation of the flow of  $\bar \varGamma _{\kappa }^{(2)}$ given by (5.5). The bold lines represent the propagator
 $\bar G_\kappa$, the crosses the derivative of the regulator
 $\partial _\kappa {\mathcal {R}}_\kappa$ and the hatched dots the vertices
 $\bar \varGamma ^{(n)}_\kappa$ with
 $n$ the number of legs. The loop indicates that all the internal indices are summed over along the loop, and the internal momentum
 $\boldsymbol {q}$ and frequency
 $\omega$ circulating in the loop are integrated over.

To conclude these general definitions, we also consider the Fourier transforms in space and time of all these correlation functions. The Fourier convention, used throughout this Perspectives article, is
 \begin{align} f(\omega,\boldsymbol{q}) = \int_{t,\boldsymbol{x}} f({t,\boldsymbol{x}}) \exp\left({-{\rm i} \boldsymbol{q} \boldsymbol{\cdot}\boldsymbol{x} + {\rm i}\omega t}\right),\quad f(t,\boldsymbol{x}) = \int_{\omega,\boldsymbol{q}} f (\omega,\boldsymbol{q}) \exp\left({{\rm i} \boldsymbol{q} \boldsymbol{\cdot}\boldsymbol{x} - {\rm i}\omega t}\right), \end{align}
where 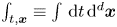 $\int _{t,\boldsymbol {x}}\equiv \int \,{\rm d}t \,{\rm d}^{d} \boldsymbol {x}$ and
 $\int _{\omega,\boldsymbol {q}} \equiv \int ({{\rm d}^{d} \boldsymbol {q}}/{(2{\rm \pi} )^{d}})({{\rm d}\omega }/{2{\rm \pi} })$. Because of translational invariance in space and time, the Fourier transform of an
 $n$-point correlation function, e.g.
 $\varGamma ^{(n)}$, takes the form
 \begin{align} \varGamma^{(n)}({\omega_1,\boldsymbol{p}_1}, \ldots,\omega_n, {\boldsymbol{p}_{n}}) = (2{\rm \pi})^{d+1}\delta\left(\sum_i \omega_i\right)\delta^{d}\left(\sum_i \boldsymbol{p}_i\right) \bar\varGamma^{(n)}({\omega_1,\boldsymbol{p}_1}, \ldots, {\omega_{n-1},\boldsymbol{p}_{n-1}}) , \end{align}
that is, the total wavevector and total frequency are conserved, and the last frequency–wavevector arguments  $\omega _n,\boldsymbol {p}_n$ can be omitted since they are fixed as minus the sum of the others.
3.2. Action for the hydrodynamical equations
The MSRJD procedure can be straightforwardly applied to the ( $d$-dimensional) Burgers equation where the field
 $\varphi$ is replaced by the velocity field
 $\boldsymbol {v}$. Introducing the response field
 $\bar {\boldsymbol {v}}$, it yields the action
 \begin{equation} {\mathcal{S}}_{B} = \int_{t,\boldsymbol{x}}\bar {{v}}_\alpha \left[\partial_t {{v}}_\alpha + {{v}}_\beta\partial_\beta {{v}}_\alpha -\nu \nabla^{2} {{v}}_\alpha \right] - \int_{t,\boldsymbol{x},\boldsymbol{x}'} \bar {{v}}_\alpha D_{\alpha\beta}(\boldsymbol{x}-\boldsymbol{x}')\bar{{v}}_\beta . \end{equation}
For the NS equation, one has to also include the incompressibility constraint (2.2). This can be simply achieved by including the factor  $\delta (\partial _\beta v_\beta )$ in (3.4). This functional delta can then be exponentiated along with the equation of motion through the introduction of an additional response field
 $\overline {{\rm \pi} }$. This yields the following path integral representation:
 \begin{align} {\mathcal{Z}}[\boldsymbol{J},\overline{\boldsymbol{J}},K,\bar{K}] = \int \mathcal{D}\boldsymbol{v}\mathcal{D}\overline{\boldsymbol{v}}\mathcal{D}{\rm \pi} \mathcal{D}\bar {\rm \pi}\, \exp\left({-{\mathcal{S}}_{NS}[\boldsymbol{v},\overline{\boldsymbol{v}},{\rm \pi},\bar {\rm \pi}] +\int_{t,\boldsymbol{x}}\left\{ \boldsymbol{J}\boldsymbol{\cdot} \boldsymbol{v}+\overline{\boldsymbol{J}}\boldsymbol{\cdot} \overline{\boldsymbol{v}}+K {\rm \pi}+\bar K\bar {\rm \pi}\right\}}\right) , \end{align}
for the fluctuating velocity and pressure fields and their associated response fields, with the NS action
 $$\begin{gather} {\mathcal{S}}_{NS}[\boldsymbol{v},\bar{\boldsymbol{v}},{\rm \pi},\bar {\rm \pi}] = \int_{t,\boldsymbol{x}}\left\{\bar {\rm \pi}\partial_\alpha {{v}}_\alpha + \bar {{v}}_\alpha\left[ \partial_t {{v}}_\alpha -\nu \nabla^{2} {{v}}_\alpha +{{v}}_\beta\partial_\beta {{v}}_\alpha+\frac 1\rho \partial_\alpha {\rm \pi}\right]\right\}\nonumber\\ -\int_{t,\boldsymbol{x},\boldsymbol{x}'}\bar {{v}}_\alpha(t,\boldsymbol{x}) N_{\alpha\beta}\left(\frac{|\boldsymbol{x}-\boldsymbol{x}'|}{L}\right)\bar {{v}}_\beta(t,\boldsymbol{x}') . \end{gather}$$
In this formulation, we have kept the pressure field and introduced a response field  $\bar {{\rm \pi} }$ to enforce the incompressibility constraint. Alternatively, the pressure field can be integrated out using the Poisson equation, such that one obtains a path integral in terms of two fields
 $\boldsymbol {v}$ and
 $\bar {\boldsymbol {v}}$ instead of four, at the price of a resulting action which is non-local (Barbi & Münster Reference Barbi and Münster2013). We choose here to keep the pressure fields since the whole pressure sector turns out to be very simple to handle, as is shown in Appendix A.
We now consider a passive scalar field  $\theta$ transported by a turbulent NS velocity flow according to the advection–diffusion equation (2.4). The associated field theory is simply obtained by adding the two fields
 $\theta, \bar \theta$ and the two corresponding sources
 $j,\bar j$ to the field multiplet
 $\varPhi =(\boldsymbol {v},\bar {\boldsymbol {v}},{\rm \pi},\bar {\rm \pi},\theta,\bar \theta )$ and source multiplet
 ${\mathcal {J}} = (\boldsymbol {J},\bar {\boldsymbol {J}},K,\bar K,j,\bar j)$ respectively. The generating functional then reads
 \begin{equation} {\mathcal{Z}}[{\mathcal{J}}] = \int \mathcal{D}\varPhi\exp\left({-{\mathcal{S}}_{NS}[\boldsymbol{v},\bar{\boldsymbol{v}},{\rm \pi},\bar {\rm \pi}] -{\mathcal{S}}_{\theta}[\theta,\bar\theta,\boldsymbol{v}] + \int_{t,\boldsymbol{x}} {\mathcal{J}}_\ell \varPhi_\ell}\right), \end{equation}
with the passive scalar action given by
 \begin{align} {\mathcal{S}}_{\theta}[\theta,\bar\theta,\boldsymbol{v}] = \int_{t,\boldsymbol{x}}\,\bar{\theta}\left[\partial_{t}\theta+{{v}}_{\beta}\partial_{\beta}\theta-\kappa_\theta \nabla^{2}\theta\right] -\int_{t,\boldsymbol{x} ,\boldsymbol{x}'} \bar{\theta}\left(t,\boldsymbol{x}\right)M\left(\frac{\boldsymbol{x}-\boldsymbol{x}'}{L_\theta}\right)\bar{\theta}\left(t,\boldsymbol{x}'\right). \end{align}
The two actions (3.22) and (3.24) possess fundamental symmetries, some of which have only been recently identified. They can be used to derive a set of exact identities relating among each other different correlation functions of the system. These identities, which include as particular cases the Kármán–Howarth and Yaglom relations, contain fundamental information on the system. We provide in § 3.3 a detailed analysis of these symmetries, and show how the set of exact identities can be inferred from Ward identities.
3.3. Symmetries and extended symmetries
We are interested in the stationary state of fully developed homogeneous and isotropic turbulence. We hence assume translational invariance in space and time, as well as rotational invariance. Beside these symmetries, the NS equation possesses other well-known symmetries, such as the Galilean invariance. In the field-theoretical formulation, these symmetries are obviously carried over, but they are moreover endowed with a systematic framework to be fully exploited. Indeed, the path integral formulation provides the natural tool to express the consequences of the symmetries on the correlation functions of the theory, under the form of exact identities which are called Ward identities.
In fact, the field-theoretical formulation is even more far reaching, in the sense that the very notion of symmetry can be extended. A symmetry means an invariance of the model (equation of motion or action) under a given transformation of the fields and space–time coordinates. Identifying the symmetries of a model is very useful because it allows for simplification, and also uncovering of invariants, as according to Noether's theorem, continuous symmetries are associated with conserved quantities. In general, the symmetries considered are global symmetries, i.e. their parameters are constants (e.g. angle of a global rotation, vector of a global translation). However, if one can identify local symmetries, i.e. whose parameters are space and/or time dependent, this will lead to local conservation laws, which are much richer, much more constraining. In general, the global symmetries of the model cannot be simply promoted to local symmetries by letting their parameters depend on space and/or time. However, this can be achieved in certain cases at the price of extending the notion of symmetry. More precisely, it is useful to also consider transformations that do not leave the model strictly invariant, but ‘almost’, in the sense that they lead to a variation which is at most linear in the fields. We refer to them as extended symmetries. The key is that one can deduce from them exact local identities, which are thus endowed with a stronger content than the original global identities associated with global symmetries, i.e. they provide additional constraints.
One may wonder why one focuses on linear variations specifically and what is special about them. In fact, in principle, one can consider any transformation of the fields and coordinates and just write down the corresponding variation of the action. Once inserted in the path integral (3.10), this leads to a relation for the average value of this variation. The reason is that only when it is linear in the fields can this relation be turned into an identity for the generating functionals themselves. In this case, it becomes extremely powerful because it allows one to obtain an infinite set of exact relations between correlation functions by taking functional derivatives. The mechanism is very simple, and is exemplified in the simplest case of the symmetries of the pressure sector in Appendix A.1. In the following, we detail two specific extended symmetries, since they play a fundamental role in § 7; refer to Appendix A for additional ones. Indeed, these two symmetries yield the identities (3.31) and (3.36), which allow for an exact closure at large wavenumbers of the FRG equations.
3.3.1. Time-dependent Galilean symmetry
A fundamental symmetry of the NS equation is the Galilean invariance, which is the invariance under the global transformation  $\boldsymbol {x}\to \boldsymbol {x}'=\boldsymbol {x}+\boldsymbol {v}_0 t$,
 $\boldsymbol {v}(t,\boldsymbol {x})\to \boldsymbol {v}(t,\boldsymbol {x}')-\boldsymbol {v}_0$. In fact, it was early recognised in the field-theoretical context that a time-dependent, (also called time-gauged) version of this transformation leads to an extended symmetry of the NS action and useful Ward identities (Adzhemyan, Antonov & Kim Reference Adzhemyan, Antonov and Kim1994; Antonov, Borisenok & Girina Reference Antonov, Borisenok and Girina1996; Adzhemyan et al. Reference Adzhemyan, Antonov and Vasil'ev1999). Considering an infinitesimal arbitrary time-dependent vector
 $\boldsymbol {\varepsilon }(t)$, this transformation reads
 \begin{equation} \left. \begin{aligned} \delta {{v}}_\alpha(t,\boldsymbol{x}) & ={-}\dot{\varepsilon}_\alpha(t)+\varepsilon_\beta(t) \partial_\beta {{v}}_\alpha(t,\boldsymbol{x})\\ \delta \varPhi_k(t,\boldsymbol{x}) & =\varepsilon_\beta(t) \partial_\beta \varPhi_k(t,\boldsymbol{x}), \end{aligned} \right\} \end{equation}
where  $\dot {\varepsilon }_\alpha = {\textrm {d}\varepsilon _\alpha }/{\textrm {d}t}$, and
 $\varPhi _k$ denotes any other fields
 $\bar {\boldsymbol {v}},{\rm \pi},\bar {{\rm \pi} },\ldots$. The variation
 $\varepsilon _\beta (t)\partial _\beta (\,{{\cdot }}\,)$ just originates from the change of coordinates. The global Galilean transformation is recovered for a constant velocity
 $\dot {\boldsymbol {\varepsilon }}(t) = \boldsymbol {v}_0$.
The overall variation of the NS action under the transformation (3.25) is
 \begin{equation} \delta {\mathcal{S}}_{NS}={-}\int_{t,\boldsymbol{x}} {\varepsilon}_\alpha(t) \partial_t^{2} \bar {{v}}_\alpha(t,\boldsymbol{x}). \end{equation}
Since the field transformation (3.25) is a mere affine change of variable in the functional integral  ${\mathcal {Z}}$, it must leave it unaltered. Performing this change of variable in (3.21) and expanding the exponential to first order in
 $\varepsilon$, one obtains
 \begin{equation} \left\langle \delta {\mathcal{S}}_{NS}\right\rangle = \left\langle \delta \int_{t,\boldsymbol{x}}{\mathcal{J}}_\ell \varPhi_\ell\right\rangle = \int_{t,\boldsymbol{x}} \left\{ -\dot\varepsilon_\alpha(t) J_\alpha(t,\boldsymbol{x}) + \varepsilon_\beta(t) {\mathcal{J}}_\ell(t,\boldsymbol{x}) \partial_\beta \varPsi_\ell(t,\boldsymbol{x}) \right\} . \end{equation}
Since this identity is valid for arbitrary  $\boldsymbol {\varepsilon }(t)$, one deduces
 \begin{equation} \int_{\boldsymbol{x}} \left\{\partial_t J_\alpha(t,\boldsymbol{x}) + {\mathcal{J}}_\ell(t,\boldsymbol{x}) \partial_\alpha \varPsi_\ell(t,\boldsymbol{x}) \right\} ={-}\int_{\boldsymbol{x}} \partial_t^{2} \bar u_\alpha(t,\boldsymbol{x}) . \end{equation}
We use throughout this paper the notation  $\boldsymbol {u} \equiv \langle \boldsymbol {v}\rangle$ and
 $\bar {\boldsymbol {u}} \equiv \langle \bar {\boldsymbol {v}}\rangle$ for the average fields, and generically for the field multiplet
 $\varPsi \equiv \langle \varPhi \rangle$. The identity (3.28) is integrated over space, but local in time. In contrast, the identity stemming from the usual Galilean invariance with a constant
 $\boldsymbol {v}_0$ is integrated over time as well, and the right-hand side is replaced by zero since the action is invariant under global Galilean transformation.
One can express the sources in term of derivatives of  $\varGamma$ using (3.16a,b) and rewrite the exact identity (3.28) as the following Ward identity for the functional
 $\varGamma$:
 \begin{equation} \int_{\boldsymbol{x}} \left\{ \partial_t \frac{\delta \varGamma}{\delta u_\alpha} + \partial_\alpha \varPsi_\ell \frac{\delta \varGamma}{\delta \varPsi_\ell}\right\} ={-}\int_{\boldsymbol{x}} \partial_t^{2} \bar u_\alpha . \end{equation}
Note that replacing instead the average values of the fields using (3.16a,b), the identity (3.28) can be equivalently written for the functional  ${\mathcal {W}}$ as
 \begin{equation} \int_{\boldsymbol{x}} \left\{\partial_t J_\alpha + {\mathcal{J}}_\ell \partial_\alpha \frac{\delta {\mathcal{W}}}{\delta {\mathcal{J}}_\ell} \right\} ={-}\int_{\boldsymbol{x}} \partial_t^{2} \frac{\delta {\mathcal{W}}}{\delta \bar J_\alpha}. \end{equation}
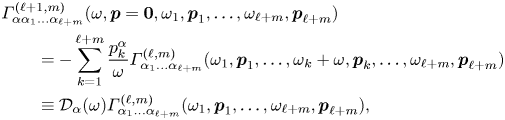
The identities (3.29) and (3.30) are functional in the fields. One can deduce from them, by functional differentiation, an infinite set of exact identities amongst the correlation functions  $\varGamma ^{(n)}$ or
 ${\mathcal {W}}^{(n)}$. Let us express them for the vertices. They are obtained by taking functional derivatives of the identity (3.29) with respect to
 $\ell$ velocity and
 $m$ response velocity fields, and setting the fields to zero, which yields in Fourier space
 \begin{align} &\varGamma^{(\ell+1,m)}_{\alpha\alpha_1\ldots\alpha_{\ell+m}}(\omega,\boldsymbol{p}=\boldsymbol{0}, \omega_1,\boldsymbol{p}_1, \ldots , \omega_{\ell+m},\boldsymbol{p}_{\ell+m})\nonumber\\ &\qquad={-}\sum_{k=1}^{\ell+m}\frac{p_k^{\alpha}}{\omega}\varGamma^{(\ell,m)}_{\alpha_1\ldots\alpha_{\ell+m}}(\omega_1,\boldsymbol{p}_1,\ldots,\omega_k+\omega,\boldsymbol{p}_k,\ldots, \omega_{\ell+m},\boldsymbol{p}_{\ell+m})\nonumber\\ &\qquad \equiv {\mathcal{D}}_\alpha(\omega) \varGamma^{(\ell,m)}_{\alpha_1\ldots\alpha_{\ell+m}}(\omega_1,\boldsymbol{p}_1, \ldots, \omega_{\ell+m},\boldsymbol{p}_{\ell+m}), \end{align}
where the  $\alpha _i$ are the space indices of the vector fields. We refer to Tarpin et al. (Reference Tarpin, Canet and Wschebor2018) for details on the derivation. The operator
 ${\mathcal {D}}_\alpha (\omega )$ hence successively shifts by
 $\omega$ all the frequencies of the function on which it acts. The identities (3.31) exactly relate an arbitrary
 $(\ell +m+1)$-point vertex function with one vanishing wavevector carried by a velocity field
 $u_\alpha$ to a lowered-by-one order
 $(\ell +m)$-point vertex function. It is clear that this type of identity can constitute a key asset to address the closure problem of turbulence, since the latter precisely requires us to express higher-order statistical moments in terms of lower-order ones. Of course, this relation only fixes
 $\varGamma ^{(\ell +m+1)}$ in a specific configuration, namely with one vanishing wavevector, so it does not allow one to completely eliminate this vertex, and it is not obvious a priori how it can be exploited. In fact, we will show that, within the FRG framework, this type of configuration plays a dominant role at small scales, and the exact identities (3.31) (together with (3.35)) in turn yields the closure of the FRG equations in the corresponding limit.
3.3.2. Shift of the response fields
It was also early noticed in the field-theoretical framework that the NS action is invariant under a constant shift of the velocity response fields (as by integration by parts in (3.22) this constant can be eliminated). However, it was not identified until recently that this symmetry could also be promoted to a time-dependent one (Canet, Delamotte & Wschebor Reference Canet, Delamotte and Wschebor2015). The latter corresponds to the following infinitesimal coupled transformation of the response fields:
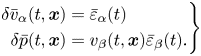 \begin{equation} \left. \begin{aligned} \delta \bar {{v}}_\alpha(t,\boldsymbol{x}) & =\bar \varepsilon_\alpha(t)\\ \delta \bar p(t,\boldsymbol{x}) & = {{v}}_\beta(t,\boldsymbol{x}) \bar \varepsilon_\beta(t) . \end{aligned} \right\} \end{equation}
This transformation indeed induces a variation of the NS action which is only linear in the fields
 \begin{equation} \delta {\mathcal{S}}_{NS} = \int_{t,\boldsymbol{x}} {\bar\varepsilon}_\beta(t) \partial_t {{v}}_\beta(t,\boldsymbol{x}) +2 \int_{t,\boldsymbol{x},\boldsymbol{x}'} {\bar\varepsilon}_\alpha(t) N_{\alpha_\beta} \left(\frac{|\boldsymbol{x}-\boldsymbol{x}'|}{L}\right) \bar {{v}}_\beta(t,\boldsymbol{x}') . \end{equation}
Hence, interpreted as a change of variable in (3.21), this yields the identity  $\langle \delta {\mathcal {S}}_{NS}\rangle = \langle \delta \int _{t,\boldsymbol {x}}{\mathcal {J}}_\ell \varPhi _\ell \rangle$, which can be written as the following Ward identity for the functional
 $\varGamma$:
 \begin{align} \int_{\boldsymbol{x}} \left\{\frac{\delta \varGamma}{\delta \bar u_\alpha(t,\boldsymbol{x})} + u_\alpha(t,\boldsymbol{x}) \frac{\delta \varGamma}{\delta \bar p(t,\boldsymbol{x})} \right\}= \int_{\boldsymbol{x}} \partial_t u_\alpha(t,\boldsymbol{x}) + 2 \int_{\boldsymbol{x},\boldsymbol{x}'}N_{\alpha_\beta} \left(\frac{|\boldsymbol{x}-\boldsymbol{x}'|}{L}\right) \bar u_\beta(t,\boldsymbol{x}') . \end{align}
Note that this identity is again local in time. Taking functional derivatives with respect to velocity and response velocity fields and evaluating at zero fields, one can deduce again exact identities for vertex functions (Canet et al. Reference Canet, Delamotte and Wschebor2016). They give the expression of any  $\varGamma ^{(\ell,m)}$ with one vanishing wavevector carried by a response velocity, which simply reads in Fourier space
 \begin{equation} \varGamma_{\alpha_1\ldots\alpha_{\ell+m}}^{(\ell,m)}(\omega_1,\boldsymbol{p}_1, \ldots,\omega_\ell,\boldsymbol{p}_\ell, \omega_{\ell+1},\boldsymbol{p}_{\ell+1}=\boldsymbol{0},\ldots)= 0 , \end{equation}
for all  $(\ell,m)$ except for the two lower-order ones which keep their original form given by
 ${\mathcal {S}}_{{NS},\alpha \beta }^{(1,1)}$ and
 ${\mathcal {S}}_{{NS},\alpha \beta \gamma }^{(2,1)}$ respectively, i.e.
 \begin{equation} \left. \begin{aligned}
&
\varGamma_{\alpha\beta}^{(1,1)}(\omega_1,\boldsymbol{p}_1,
\omega_2,\boldsymbol{p}_2 =\boldsymbol{0})={\rm
i}\omega_1\delta_{\alpha\beta}
\;(2{\rm \pi})^{d+1}\delta(\omega_1+\omega_2)\delta^{d}(\boldsymbol{p}_1),\\
&
\varGamma_{\alpha\beta\gamma}^{(2,1)}(\omega_1,\boldsymbol{p}_1,\omega_2,\boldsymbol{p}_2,\omega_3,\boldsymbol{p}_3
=\boldsymbol{0})) ={-}{\rm i} (p_2^{\alpha}
\delta_{\beta\gamma} +{\rm i} p_1^{\beta}
\delta_{\alpha\gamma})\\ & \qquad
\times(2{\rm \pi})^{d+1}\delta(\omega_1+\omega_2+\omega_3)\delta^{d}(\boldsymbol{p}_1+\boldsymbol{p}_2).
\end{aligned} \right\}
\end{equation}
Let us emphasise that the analysis of extended symmetries can still be completed. First, for 2-D turbulence, additional extended symmetries have recently been unveiled, which are reported in Appendix C. One of them is also realised in 3-D turbulence but has not been exploited yet in the FRG formalism. Second, another important symmetry of the Euler or NS equation is the scaling or dilatation symmetry, which amounts to the transformation  $\boldsymbol {v}(t,\boldsymbol {x}) \to b^{h} \boldsymbol {v}(b^{z} t,b \boldsymbol {x})$ (Frisch Reference Frisch1995; Dubrulle Reference Dubrulle2019). One can also derive from this symmetry, possibly extended, functional Ward identities. This route has not been explored either. Both could lead to future fruitful developments.
3.4. Kármán–Howarth and Yaglom relations from symmetries
The path integral formulation conveys an interesting viewpoint on well-known exact identities such as the Kármán–Howarth relation (von Kármán & Howarth Reference von Kármán and Howarth1938) or the equivalent Yaglom relation for passive scalars (Yaglom Reference Yaglom1949). The Kármán–Howarth relation stems from the energy budget equation associated with the NS equation, upon imposing stationarity, homogeneity and isotropy. From this relation, one can derive the exact four-fifths Kolmogorov law for the third-order structure function  $S^{(3)}$ (see e.g. Frisch Reference Frisch1995). It turns out that the Kármán–Howarth relation also emerges as the Ward identity associated with a space–time-dependent shift of the response fields (which is a generalisation of the time-dependent shift discussed in § 3.3.2), and can thus be obtained in the path integral formulation as a consequence of symmetries (Canet et al. Reference Canet, Delamotte and Wschebor2015).
To show this, let us consider the NS action (3.22) with an additional source  $L_{\alpha \beta }$ in (3.21) coupled to the local quadratic term
 ${{v}}_\alpha (t,\boldsymbol {x}){{v}}_\beta (t,\boldsymbol {x})$ (which is a composite operator in the field-theoretical language), i.e. the term
 $\int _{t,\boldsymbol {x}} {{v}}_\alpha L_{\alpha \beta }{{v}}_\beta$ is added to the source terms. This implies that a local, i.e. at coinciding space–time points, quadratic average of the velocities, can then be simply obtained by taking a functional derivative of
 ${\mathcal {W}}$ with respect to this new source
 \begin{equation} \left\langle {{v}}_\alpha(t,\boldsymbol{x}) {{v}}_\beta(t,\boldsymbol{x})\right\rangle = \frac{\delta {\mathcal{W}}}{\delta L_{\alpha\beta}(t,\boldsymbol{x})} ={-} \frac{\delta \varGamma}{\delta L_{\alpha\beta}(t,\boldsymbol{x})} , \end{equation}
where the last equality stems from the Legendre transform relation (3.15). (Note that to define  $\varGamma$, the Legendre transform is not taken with respect to the source
 $L_{\alpha \beta }$, i.e. both functional
 ${\mathcal {W}}$ and
 $\varGamma$ depend on
 $L_{\alpha \beta }$, hence the relation (3.37).)
The introduction of the source for the composite operator  ${{v}}_\alpha {{v}}_\beta$ allows one to consider a further extended symmetry of the NS action, namely the time- and space-dependent version of the field transformation (3.32), which amounts to
 $\bar \varepsilon _\alpha (t)\to \bar \varepsilon _\alpha (t,\boldsymbol {x})$. The variation of the NS action under this transformation writes
 \begin{align} \langle \delta {\mathcal{S}}_{NS} \rangle=\left\langle \partial_t {{v}}_\alpha+\frac{1}{\rho}\partial_\alpha {\rm \pi}-\nu \nabla^{2} {{v}}_\alpha +\partial_\beta({{v}}_\alpha {{v}}_\beta) -2\int_{\boldsymbol{x}'}\left(N_{\alpha\beta}\left(\frac{|\boldsymbol{x}-\boldsymbol{x}'|}{L}\right) \bar {{v}}_\beta(t,\boldsymbol{x}')\right) \right\rangle, \end{align}
which is linear in the fields, but for the local quadratic term. However, this term can be expressed as a derivative with respect to  $L_{\alpha \beta }$ using (3.37). The resulting Ward identity can be written equivalently in terms of
 $\varGamma$ or
 ${\mathcal {W}}$. We here write it for
 ${\mathcal {W}}$ since it renders more direct the connection with the Kármán–Howarth relation
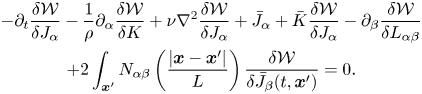 $$\begin{gather} -\partial_t \frac{\delta \mathcal{W}}{\delta J_\alpha}-\frac{1}{\rho}\partial_\alpha\frac{\delta \mathcal{W}}{\delta K} +\nu \nabla^{2} \frac{\delta \mathcal{W}}{\delta J_\alpha}+ \bar J_\alpha + \bar K \frac{\delta \mathcal{W}}{\delta J_\alpha} -\partial_\beta \frac{\delta \mathcal{W}}{\delta L_{\alpha\beta}}\nonumber\\ + 2\int_{\boldsymbol{x}'} N_{\alpha\beta}\left(\frac{|\boldsymbol{x}-\boldsymbol{x}'|}{L}\right)\frac{\delta \mathcal{W}}{\delta \bar J_\beta(t,\boldsymbol{x}')} =0 . \end{gather}$$
We emphasise that, compared with (3.34), this identity is now fully local, in space as well as in time, i.e. it is no longer integrated over space. It is also an exact identity for the generating functional  $\mathcal {W}$ itself, which means that it entails an infinite set of exact identities amongst correlation functions. The Kármán–Howarth relation embodies the lowest-order one, which is obtained by differentiating (3.39) with respect to
 $J_\gamma (t_y,\boldsymbol {y})$, and evaluating the resulting identity at zero external sources. Note that in the MSRJD formalism, the term proportional to
 $N_{\alpha \beta }$ is simply equal to a force–velocity correlation
 $\langle f_\alpha (t,\boldsymbol {x}) {{v}}_\gamma (t_y,\boldsymbol {y}) \rangle$ (Canet et al. Reference Canet, Delamotte and Wschebor2015). Summing over
 $\gamma =\alpha$ and specialising to equal time
 $t_y=t$, one deduces
 \begin{align} &-\partial_t \langle {{v}}_\alpha(t,\boldsymbol{x}) {{v}}_\alpha(t,\boldsymbol{y})\rangle + \nu (\Delta_x+\Delta_y) \langle {{v}}_\alpha(t,\boldsymbol{x}) {{v}}_\alpha(t,\boldsymbol{y})\rangle \nonumber\\ &\qquad -\partial_\beta^{x} \langle {{v}}_\alpha(t,\boldsymbol{x}) {{v}}_\beta(t,\boldsymbol{x}) {{v}}_\alpha(t,\boldsymbol{y})\rangle -\partial_\beta^{y} \langle {{v}}_\alpha(t,\boldsymbol{y}) {{v}}_\beta(t,\boldsymbol{y}) {{v}}_\alpha(t,\boldsymbol{x})\rangle\nonumber\\ &\qquad+ \langle f_\alpha(t,\boldsymbol{x}) {{v}}_\alpha(t,\boldsymbol{y}) \rangle+ \langle f_\alpha(t,\boldsymbol{y}) {{v}}_\alpha(t,\boldsymbol{x}) \rangle=0, \end{align}
which is the Kármán–Howarth relation. This fundamental relation is usually expressed in terms of the longitudinal velocity increments  $\delta {{v}}_\parallel (\boldsymbol {\ell }) = (\boldsymbol {v}(\boldsymbol {r}+\boldsymbol {\ell }) - \boldsymbol {v}(\boldsymbol{r}))\boldsymbol {{\cdot}} \boldsymbol {\ell}/\ell$ by choosing the two space points as
 $\boldsymbol {y}=\boldsymbol {x}+\boldsymbol {\ell }$ and
 $\boldsymbol {x} = \boldsymbol {r}$. Using homogeneity and isotropy, (3.40) can be equivalently expressed as
 \begin{align} \epsilon(\boldsymbol{\ell}) &\equiv{-}\dfrac 1 4 \nabla_{\boldsymbol{\ell}}\boldsymbol{\cdot} \left\langle |\delta \boldsymbol{v}(\boldsymbol{\ell})|^{2} \delta \boldsymbol{v}(\boldsymbol{\ell}) \right\rangle\nonumber\\ &={-}\dfrac 1 2 \partial_t \left\langle \boldsymbol{v}(\boldsymbol{r}) \boldsymbol{v}(\boldsymbol{r}+\boldsymbol{\ell}) \right\rangle + \left\langle \boldsymbol{v}(\boldsymbol{r})\boldsymbol{\cdot} \dfrac{\boldsymbol{f}(\boldsymbol{r}+\boldsymbol{\ell}) +\boldsymbol{f}(\boldsymbol{r}-\boldsymbol{\ell})}{2} \right\rangle +\nu \nabla_{\ell}^{2} \left\langle \boldsymbol{v}(\boldsymbol{r})\boldsymbol{\cdot} \boldsymbol{v}(\boldsymbol{r}+\boldsymbol{\ell}) \right\rangle. \end{align}
Once again, taking other functional derivatives with respect to arbitrary sources yields infinitely many exact relations. To give another example, by differentiating twice (3.39) with respect to  $L_{\mu \nu }(t_y,\boldsymbol {y})$ and
 $J_\gamma (t_z,\boldsymbol {z})$, one obtains the exact relation for a pressure–velocity correlation (Canet et al. Reference Canet, Delamotte and Wschebor2015)
 \begin{align} & \nu \langle {{v}}_\alpha(t,\boldsymbol{x}) \Delta_x {{v}}_\alpha(t,\boldsymbol{x}) \boldsymbol{v}^{2}(t,\boldsymbol{y}) \rangle -\frac 1 \rho \partial_\alpha^{x} \langle \boldsymbol{v}^{2}(t,\boldsymbol{y}) {{v}}_\alpha(t,\boldsymbol{x}) {\rm \pi}(t,\boldsymbol{x})\rangle \nonumber\\ &\qquad+ \langle f_\alpha(t,\boldsymbol{x}) {{v}}_\alpha(t,\boldsymbol{x}) \boldsymbol{v}^{2}(t,\boldsymbol{y}) \rangle - \frac 1 2 \partial^{x}_\alpha \langle {{v}}_\alpha(t,\boldsymbol{x}) \boldsymbol{v}^{2}(t,\boldsymbol{x}) v^{2}(t,\boldsymbol{y}) \rangle =0 , \end{align}
which was first derived in Falkovich, Fouxon & Oz (Reference Falkovich, Fouxon and Oz2010). Taking additional functional derivatives with respect to  $\boldsymbol {J}$ or
 $\boldsymbol{\mathsf{L}}$ (or of the any other sources) generates new exact relations between higher-order correlation functions, involving in the averages one more
 ${{v}}$ or
 $\boldsymbol {v}^{2}$ (or any of the other fields) respectively with each derivative compared with (3.40). Although exact, relations for high-order correlation functions may not be of direct practical use since they are increasingly difficult to measure, but they are important at the theoretical level.
Shortly after Kolmogorov's derivation of the exact relation for the third-order structure function, Yaglom established the analogous formula for scalar turbulence (Yaglom Reference Yaglom1949). It was shown in Pagani & Canet (Reference Pagani and Canet2021) that this relation can also be simply inferred from symmetries of the passive scalar action (3.24). More precisely, it ensues from the space–time-dependent shift of the response fields
 \begin{equation} \bar{\theta}\left(t,\boldsymbol{x}\right)\rightarrow\bar{\theta}\left(t,\boldsymbol{x}\right)+\bar\varepsilon\left(t,\boldsymbol{x}\right),\quad \bar{\rm \pi}\left(t,\boldsymbol{x}\right)\rightarrow \bar{\rm \pi}\left(t,\boldsymbol{x}\right)+\bar \varepsilon\left(t,\boldsymbol{x}\right)\theta\left(t,\boldsymbol{x}\right) \end{equation}
in the path integral (3.23), in the presence of the additional source term  $\int _{t,\boldsymbol {x}}L_{\alpha }{{v}}_{\alpha }\theta$, where
 $L_\alpha$ is the source coupled to the composite operator
 ${{v}}_{\alpha }\theta$. Following the same reasoning, one deduces an exact functional Ward identity for the passive scalar, which writes in term of
 ${\mathcal {W}}$
 \begin{equation} \left(\partial_{t}-{\kappa_\theta}\nabla^{2} \right)\frac{\delta W}{\delta j\left(t,\boldsymbol{x}\right)}+ \partial_{\beta}\frac{\delta W}{\delta L_{\beta}\left(t,\boldsymbol{x}\right)} -\int_{\boldsymbol{y}} M\left(\frac{|\boldsymbol{x}-\boldsymbol{y}|}{L_\theta}\right)\frac{\delta W}{\delta \bar{j}\left(t,\boldsymbol{y}\right)} = 0. \end{equation}
The lowest-order relation stemming from it is the Yaglom relation
 \begin{equation} -\frac{1}{2}\frac{\partial}{\partial\left(x-y\right)_{\alpha}}\langle\left|\theta\left(t,\boldsymbol{x}\right)-\theta\left(t,\boldsymbol{y}\right)\right|^{2}\left({{v}}_{\alpha}\left(t,\boldsymbol{x}\right)-{{v}}_{\alpha}\left(t,\boldsymbol{y}\right)\right)\rangle = 2\epsilon_{\theta}, \end{equation}
where  $\epsilon _\theta$ is the mean dissipation rate of the scalar. As for the Kármán–Howarth relation, it can be re-expressed using homogeneity and isotropy in the more usual form
 \begin{equation} \langle\left|\theta\left(t,\boldsymbol{r}\right)-\theta\left(t,\boldsymbol{r}+\boldsymbol{\ell}\right)\right|^{2} \delta {{v}}_\parallel(t,\boldsymbol{\ell})\rangle ={-}\dfrac{4}{3}\epsilon_{\theta}\ell. \end{equation}
This relation hence also follows from symmetries in the path integral formulation. Again, an infinite set of higher-order exact relations between scalar and velocity correlation functions can be obtained by further differentiating (3.44) with respect to sources  $\boldsymbol {L}$ or
 $j$.
4. The functional renormalisation group
As mentioned in § 2, the idea underlying the FRG is Wilson's original idea of progressive averaging of fluctuations in order to build up the effective description of a system from its microscopic model. This progressive averaging is organised scale by scale, in general in wavenumber space, and thus leads to a sequence of scale-dependent models, embodied in Wilson's formulation in a scale-dependent Hamiltonian or action (Wilson & Kogut Reference Wilson and Kogut1974). In the FRG formalism, one rather considers a scale-dependent effective action  $\varGamma _\kappa$, called the effective average action, where
 $\kappa$ denotes the RG scale. It is a wavenumber scale, which runs from the microscopic ultraviolet (UV) scale
 $\varLambda$ to a macroscopic IR scale (e.g. the inverse integral scale
 $L^{-1}$). The interest of the RG procedure is that the information about the properties of the system can be captured by the flow of these scale-dependent models, i.e. their evolution with the RG scale, without requiring us to explicitly carry out the integration of the fluctuations in the path integral. The RG flow is governed by an exact very general equation, which can take different forms depending on the precise RG used (Wilson & Kogut Reference Wilson and Kogut1974) or Polchinski flow equation (Polchinski Reference Polchinski1984), Callan–Symanzik flow equation (Callan Reference Callan1970; Symanzik Reference Symanzik1970,
 $\ldots$). The one at the basis of the FRG formalism is usually called the Wetterich equation (Wetterich Reference Wetterich1993). We briefly introduce it in the next sections on the example of the generic scalar field theory of § 3.1, denoting generically
 $\varPhi (t,\boldsymbol {x})$ the field multiplet, e.g.
 $\varPhi =(\varphi,\bar \varphi )$,
 $\varPsi =\langle \varPhi \rangle$ the multiplet of average fields, and
 ${\mathcal {J}}$ the multiplet of corresponding sources.
4.1. Progressive integration of fluctuations
The core of the RG procedure is to turn the global integration over fluctuations in the path integral (3.10) into a progressive integration, organised by wavenumber shells. To achieve this, one introduces in the path integral a scale-dependent weight  $\textrm {e}^{-\Delta {\mathcal {S}}_\kappa }$ whose role is to suppress fluctuations below the RG scale
 $\kappa$, giving rise to a new, scale-dependent generating functional
 \begin{equation} {\mathcal{Z}}_\kappa[{\mathcal{J}}] = \int{\mathcal{D}}\varPhi \exp\left({-{\mathcal{S}}[\varPhi] - \Delta{\mathcal{S}}_\kappa[\varPhi]+ \int_{t,\boldsymbol{x}} {\mathcal{J}}_\ell \varPhi_\ell } \right) . \end{equation}
The new term  $\Delta {\mathcal {S}}_\kappa$ is chosen quadratic in the fields
 \begin{equation} \Delta{\mathcal{S}}_\kappa[\varPhi] =\frac 1 2 \int_{t,\boldsymbol{x},\boldsymbol{x}'} \varPhi_m(t,\boldsymbol{x}) {\mathcal{R}}_{\kappa,m m'}(|\boldsymbol{x}-\boldsymbol{x}'|)\varPhi_{m'}(t,\boldsymbol{x}') , \end{equation}
where  ${\mathcal {R}}_\kappa$ is called the regulator, or cutoff, matrix. Note that it has been chosen here to be proportional to
 $\delta (t-t')$, or equivalently independent of frequencies. This means that the selection of fluctuations is operated in space, and not in time, as in equilibrium. (The selection can in principle be operated also in time, although it poses some technical difficulties, not to violate causality (Canet, Chaté & Delamotte Reference Canet, Chaté and Delamotte2011a) and symmetries involving time – typically the Galilean invariance. A space–time cutoff was implemented only in Duclut & Delamotte (Reference Duclut and Delamotte2017) for Model A, which is a simple, purely dissipative, dynamical extension of the Ising model. In the following, we restrict ourselves to frequency-independent regulators.)
The precise form of the elements  $[{\mathcal {R}}]_{\kappa,ij}$ of the cutoff matrix is not important, provided they satisfy the following requirements:
 \begin{equation} \left. \begin{aligned} & R_{\kappa}(\boldsymbol{p})\sim \kappa^{2},\quad \text{for }|\boldsymbol{p}|\lesssim \kappa, \\ & R_{\kappa}(\boldsymbol{p}) \longrightarrow 0,\quad \text{for }|\boldsymbol{p}|\gtrsim\kappa , \end{aligned} \right\} \end{equation}
where  $R_k$ denotes a generic non-vanishing element of the matrix
 ${\mathcal {R}}\kappa$. The first constraint endows the low wavenumber modes with a large ‘mass’
 $\kappa ^{2}$, such that these modes are damped, or filtered out, for their contribution in the functional integral to be suppressed. The second one ensures that the cutoff vanishes for large wavenumber modes, which are thus unaffected. Hence, only these modes are integrated over, thus achieving the progressive averaging. Moreover,
 $R_{\kappa =\varLambda }$ is required to be very large such that all fluctuations are frozen at the microscopic (UV) scale, and
 $R_{\kappa =0}$ to vanish such that all fluctuations are averaged over in this (IR) limit.
It follows that the free energy functional  ${\mathcal {W}}_\kappa = \ln {\mathcal {Z}}_\kappa$ also becomes scale dependent. One defines the scale-dependent effective average action through the modified Legendre transform
 \begin{equation} \varGamma_\kappa[\varPsi] + \Delta{\mathcal{S}}_\kappa[\varPsi] = {\sup}_{{\mathcal{J}}} \left[\int_{t,\boldsymbol{x}} {\mathcal{J}}_\ell \varPsi_\ell -{\mathcal{W}}_\kappa[{\mathcal{J}}] \right]. \end{equation}
The regulator term is added to the relation in order to enforce that, at the scale  $\kappa =\varLambda$, the effective average action coincides with the microscopic action
 $\varGamma _{\kappa =\varLambda }= {\mathcal {S}}$. For fluid dynamics, the scale
 $\varLambda ^{-1}$ represents a very small scale, typically a few mean free paths, where the description in term of a continuous equation becomes valid, and the ‘microscopic’ action is the NS action
 ${\mathcal {S}}_{NS}$. This scale is thus much smaller than the Kolmogorov scale
 $\eta$, and the effect of fluctuations (the renormalisation) is already important at scales
 $\ell \simeq \eta$, i.e. the statistical properties of the turbulence in the dissipative range are non-trivial. In the opposite limit
 $\kappa \to 0$ (or equivalently
 $\kappa \ll L^{-1}$) the standard effective action
 $\varGamma$, encompassing all the fluctuations, is recovered since the regulator is removed in this limit
 $\Delta {\mathcal {S}}_{\kappa =0}=0$. Thus, the sequence of
 $\varGamma _\kappa$ provides an interpolation between the microscopic action (the NS action) and the full effective action (the statistical properties of the fluid).
4.2. Exact flow equation for the effective average action
The evolution of the generating functionals  ${\mathcal {W}}_\kappa$ and
 $\varGamma _\kappa$ with the RG scale
 $\kappa$ obeys an exact differential equation, which can be simply inferred from (4.1) and (4.4) since the dependence on
 $\kappa$ only comes from the regulator term
 $\Delta {\mathcal {S}}_\kappa$. The derivation is very general and can be found in standard references, e.g. § 2.3.3. of Delamotte (Reference Delamotte2012). One finds the following exact flow equation for
 ${\mathcal {W}}_\kappa$:
 \begin{equation} \partial_{s}{\mathcal{W}}_{\kappa}\left[{\mathcal{J}}\right] ={-}\frac{1}{2}\text{Tr}\left[\partial_{s}{\mathcal{R}}_{\kappa,mn}\left(\frac{\delta^{2}{\mathcal{W}}_{\kappa}\left[{\mathcal{J}}\right]}{\delta {\mathcal{J}}_{m}\delta {\mathcal{J}}_{n}}+\frac{\delta {\mathcal{W}}_{\kappa}\left[{\mathcal{J}}\right]}{\delta {\mathcal{J}}_{m}}\frac{\delta {\mathcal{W}}_{\kappa}\left[{\mathcal{J}}\right]}{\delta {\mathcal{J}}_{n}}\right)\right], \end{equation}
where  $s\equiv \log (\kappa /\varLambda )$. This equation is very similar to the Polchinski equation (Polchinski Reference Polchinski1984). Some simple algebra then leads to the Wetterich equation for
 $\varGamma _\kappa$
 \begin{equation} \partial_{s}\varGamma_{\kappa}\left[\varPsi\right] = \frac{1}{2}\text{Tr}\left[\partial_{s}{\mathcal{R}}_{\kappa,mn} G_{\kappa,mn} \right]\equiv \frac{1}{2}\text{Tr}\left[\partial_{s}{\mathcal{R}}_{\kappa,mn}\left(\varGamma_{\kappa}^{\left(2\right)}\left[\varPsi\right]+{\mathcal{R}}_{\kappa}\right)_{mn}^{{-}1} \right] , \end{equation}
where  $G_\kappa \equiv {\mathcal {W}}^{(2)}_\kappa$ is the propagator, and is the inverse of
 $(\varGamma _\kappa ^{(2)}+{\mathcal {R}}_\kappa )$ from the Legendre relation. To alleviate notations, the indices
 $m,n$ refer to the field indices within the multiplet, as well as other possible indices (e.g. vector component) and space–time coordinates. Accordingly, the trace includes the summation over all internal indices as well as the integration over all spatial and temporal coordinates (conforming to deWitt notation, integrals are implicit).
While (4.6) and (4.5) are exact, they are functional partial differential equations which cannot be solved exactly in general. Their functional nature implies that they encompass an infinite set of flow equations for the associated correlation functions or vertices. For instance, taking one functional derivative of (4.6) with respect to a given field and evaluating the resulting expression at a fixed background field configuration (say  $\varPsi (t,\boldsymbol {x})=0$) yields the flow equation for the one-point vertex
 $\varGamma _\kappa ^{(1)}$. This equation depends on the three-point vertex
 $\varGamma _\kappa ^{(3)}$. More generally, the flow equation for the
 $n$-point vertex
 $\varGamma _\kappa ^{(n)}$ involves the vertices
 $\varGamma _\kappa ^{(n+1)}$ and
 $\varGamma _\kappa ^{(n+2)}$, such that one has to consider an infinite hierarchy of flow equations. This pertains to the very common closure problem of nonlinear systems. It means that one has to devise some approximations.
4.3. Non-perturbative approximation schemes
This part may appear very technical for readers not familiar with RG methods. Its objective is to explain the rationale underlying the approximation schemes used in the study of turbulence, which are detailed in the rest of the Perspectives article.
In the FRG context, several approximation schemes have been developed and are commonly used (Dupuis et al. Reference Dupuis, Canet, Eichhorn, Metzner, Pawlowski, Tissier and Wschebor2021). Of course one can implement a perturbative expansion, in any available small parameter, such as a small coupling or an infinitesimal distance to a critical dimension  $\varepsilon =d - d_c$. One then retrieves results obtained from standard perturbative RG techniques. However, the key advantage of the FRG formalism is that it is suited to the implementation of non-perturbative approximation schemes. The most commonly used is the derivative expansion, which consists in expanding the effective average action
 $\varGamma _\kappa$ in powers of gradients and time derivatives (thus yielding an ansatz for
 $\varGamma _\kappa$). This is equivalent to an expansion around zero external wavenumbers
 $|\boldsymbol {p}_i|=0$ and frequencies
 $\omega _i =0$ and is thus adapted to describe the long-distance long-time properties of a system. One can in particular obtain universal properties of a system at criticality (e.g. critical exponents), but also non-universal properties, such as phase diagrams. Even though it is non-perturbative in the sense that it does not rely on an explicit small parameter, it is nonetheless controlled. It can be systematically improved, order by order (adding higher-order derivatives), and an error can be estimated at each order, using properties of the cutoff (De Polsi, Hernández-Chifflet & Wschebor Reference De Polsi, Hernández-Chifflet and Wschebor2022). The convergence and accuracy of the derivative expansion have been studied in depth for archetypal models, namely the Ising model and
 ${{O}}(N)$ models (Dupuis et al. Reference Dupuis, Canet, Eichhorn, Metzner, Pawlowski, Tissier and Wschebor2021). The outcome is that the convergence is fast, and most importantly that the results obtained for instance for the critical exponents are very precise. For the 3-D Ising model, the derivative expansion has been pushed up to the sixth order
 ${{O}}(\partial ^{6})$ and the results for the critical exponents compete in accuracy with the best available estimates in the literature (stemming from conformal bootstrap methods) (Balog et al. Reference Balog, Chaté, Delamotte, Marohnić and Wschebor2019). For the
 ${{O}}(N)$ models, the FRG results are the most accurate ones available (De Polsi et al. Reference De Polsi, Balog, Tissier and Wschebor2020, Reference De Polsi, Hernández-Chifflet and Wschebor2021).
The derivative expansion is by construction restricted to describe the zero wavenumber and frequency sector, it does not allow one to access the full space–time dependence of generic correlation functions. To overcome this limitation, one can resort to another approximation scheme, which consists in a vertex expansion. The most useful form of this approximation is called the Blaizot–Mendez–Wschebor (BMW) scheme (Blaizot, Méndez-Galain & Wschebor Reference Blaizot, Méndez-Galain and Wschebor2006, Reference Blaizot, Méndez-Galain and Wschebor2007; Benitez, Méndez-Galain & Wschebor Reference Benitez, Méndez-Galain and Wschebor2008). It lies at the basis of all the FRG studies dedicated to turbulence. The BMW scheme essentially exploits an intrinsic property of the Wetterich flow equation conveyed by the presence of the regulator. The Wetterich equation has a one-loop structure. To avoid any confusion, let us emphasise that this does not mean that it is equivalent to a one-loop perturbative expansion: the propagator entering (4.6) is the full (functional) renormalised propagator of the theory, not the bare one. This simply means that the flow equation involves only one internal, or loop, (i.e. integrated over) wavevector  $\boldsymbol {q}$ and frequency
 $\omega$. This holds true for the flow equation of any vertex
 $\varGamma _\kappa ^{(n)}$, which depends on the
 $n$ external wavevectors
 $\boldsymbol {p}_i$ and frequencies
 $\varpi _i$, but always involves only one internal (loop) wavevector and frequency
 $(\omega,\boldsymbol {q})$.
The key feature of the Wetterich equation is that the internal wavevector  $\boldsymbol {q}$ is controlled by the scale derivative of the regulator. Because of the requirement (4.3),
 $\partial _s {\mathcal {R}}_\kappa (\boldsymbol {q})$ is exponentially vanishing for
 $q\equiv |\boldsymbol {q}| \gtrsim \kappa$, which implies that the loop integral is effectively cut to
 $q \simeq \kappa$, with
 $\kappa$ the RG scale. This points to a specific limit where this property can be exploited efficiently, namely the large wavenumber limit. Indeed, if one considers large external wavenumbers
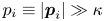 $p_i\equiv |\boldsymbol {p}_i|\gg \kappa$, then
 $|\boldsymbol {q}|\ll |\boldsymbol {p}_i|$ is automatically satisfied, or otherwise stated
 $|\boldsymbol {q}|/|\boldsymbol {p}_i|\to 0$. Hence the limit of
 $|\boldsymbol {p}_i|\to \infty$ is formally equivalent to the limit
 $|\boldsymbol {q}|\to 0$ (because the
 $\boldsymbol {p}_i$ and
 $\boldsymbol {q}$ always come as sum or product in the propagator and vertices). Moreover, the presence of the regulator ensures that all the vertices are analytical functions of their arguments at any finite
 $\kappa$, and can thus be Taylor expanded (Berges et al. Reference Berges, Tetradis and Wetterich2002). The BMW approximation precisely consists in expanding the vertices entering the flow equation around
 $\boldsymbol {q}\simeq 0$, which can be interpreted as an expansion at large
 $p_i$. This expansion becomes formally exact in the limit where all
 $p_i\to \infty$. Besides, one has that a generic
 $\varGamma _\kappa ^{(n)}$ vertex with one zero wavevector can be expressed as a derivative with respect to a constant field of the corresponding vertex
 $\varGamma _\kappa ^{(n-1)}$ stripped of the field with zero wavevector. This allows one in the original BMW approximation scheme to close the flow equation at a given order (say for the two-point function), at the price of keeping a dependence in a background constant field
 $\varPsi _0$, i.e.
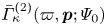 $\bar \varGamma _\kappa ^{(2)}(\varpi,\boldsymbol {p};\varPsi _0)$, which can be cumbersome. This approximation can also in principle be improved order by order, by achieving the
 $\boldsymbol {q}$ expansion in the flow equation for the next order
 $(n+1)$ vertex instead of the
 $n$th one, although it becomes increasingly difficult.
In the context of non-equilibrium statistical physics, the BMW approximation scheme was implemented successfully to study the Burgers or equivalently Kardar–Parisi–Zhang equation (2.8), which is detailed in § 5. For the NS equation, the BMW approximation scheme turns out to be remarkably efficient in two respects, which will become clear in the following: technically, the symmetries and extended symmetries allow one to get rid of the background field dependence, and thus to achieve the closure exactly. Moreover, physically, the large wavenumber limit is not trivial for turbulence, which is unusual. In critical phenomena exhibiting standard scale invariance, the large wavenumbers simply decouple from the IR properties and this limit carries no independent information (see § 5).
5. A warm-up example: Burgers-KPZ equation
The Burgers equation is often considered as a toy model for classical hydrodynamics. In the inviscid limit, its solution develops shocks after a finite time even for smooth initial conditions (Bec & Khanin Reference Bec and Khanin2007). Most studies consider potential flows, for which case the (irrotational  $d$-dimensional) Burgers equation exactly maps to the KPZ equation (2.8). The forcing is assumed to be a power law
 $D(\boldsymbol {p})\sim p^{\beta }$, which mainly injects energy at small scales (UV modes) for
 $\beta >0$, while it acts on large scales (IR modes) for
 $\beta <0$.
One is generally interested in the space–time correlations of the velocity
 \begin{equation} C^{(n)}(\tau,\ell) = \left\langle \left[\boldsymbol{v}(t+\tau,\boldsymbol{x}+\boldsymbol{\ell})-\boldsymbol{v}(t,\boldsymbol{x}) \right]^{n} \right\rangle. \end{equation}
The structure functions, which correspond to the equal-time correlations, behave as a power law in the inertial range  $S_n(\ell ) \sim \ell ^{\zeta _n}$. Besides, the two-point correlation function is expected to endow a scaling form
 \begin{equation} C^{(2)}(\tau,\ell) \equiv C(\tau,\ell) = \ell^{2(\chi-1)} F(\tau/\ell^{z}), \end{equation}
where  $\chi$ and
 $z$ are universal critical exponents called the roughness and dynamical exponent in the context of interface growth, and
 $F$ is a universal scaling function. The roughness exponent is simply related to
 $\zeta _2$ as
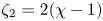 $\zeta _2 = 2(\chi -1)$. The dynamical and roughness exponents are related in all dimensions by the exact identity
 $z+\chi =2$ stemming from Galilean invariance.
In one dimension  $d=1$, the critical exponents are known exactly. For
 $\beta >0$, one has (Medina et al. Reference Medina, Hwa, Kardar and Zhang1989; Janssen, Täuber & Frey Reference Janssen, Täuber and Frey1999; Kloss et al. Reference Kloss, Canet, Delamotte and Wschebor2014a)
 \begin{equation} \chi = \max\left(\dfrac 1 2, -\dfrac \beta 3 +1\right) . \end{equation}
Moreover, shocks are overwhelmed by the forcing and there is no intermittency, i.e.  $\zeta _n = n \zeta _2/2 = n(\chi -1)$ (Hayot & Jayaprakash Reference Hayot and Jayaprakash1996). For
 $\beta <-3$, the stationary state contains a finite density of shocks and the scaling of the velocity increments in the regime where
 $|\ell |$ is much smaller than the average distance between shocks but larger than the shock size can be estimated by a simple argument, yielding (Bec & Khanin Reference Bec and Khanin2007)
 \begin{equation} \zeta_n = \min\left(1, n\right) . \end{equation}
While the intermediate regime  $-3<\beta <0$ is not well understood, a wealth of exact results are available for
 $\beta =2$, which have been obtained in the context of the KPZ equation (Corwin Reference Corwin2012). In particular, the analytical form of the scaling function
 $F$ in (5.2) has been determined exactly (Prähofer & Spohn Reference Prähofer and Spohn2000).
In higher dimensions  $d>1$, very few are known. The most studied case corresponds to the KPZ equation
 $\beta =2$. In contrast with
 $d=1$ where the interface always roughens, in dimensions
 $d>2$, the KPZ equation exhibits a (non-equilibrium) continuous phase transition between a smooth phase and a rough phase, depending on the amplitude
 $\lambda$ of the nonlinearity in (2.8). For
 $\lambda <\lambda _c$, the interface remains smooth, it is then described by the Edwards–Wilkinson equation which is the linear, non-interacting,
 $\lambda =0$, version of KPZ, and which has a simple diffusive behaviour with
 $z=2$ and
 $\chi =(2-d)/2$. For
 $\lambda >\lambda _c$, the nonlinearity is dominant and the interface becomes rough, with
 $\chi >0$. This is the KPZ phase. Contrarily to
 $d=1$, no exact result has been obtained for
 $d\neq 1$, and the critical exponents are known only numerically (Pagnani & Parisi Reference Pagnani and Parisi2015).
Since the early days of the KPZ equation, perturbative RG techniques (usually referred to as dynamical RG) have been applied to determine the critical exponents (Kardar et al. Reference Kardar, Parisi and Zhang1986; Medina et al. Reference Medina, Hwa, Kardar and Zhang1989; Janssen et al. Reference Janssen, Täuber and Frey1999). However, the KPZ equation constitutes a striking example where the perturbative RG flow equations are known to all orders in perturbation theory, but nonetheless fail for  $d\geq 2$ to find the strong-coupling fixed point expected to govern the KPZ rough phase (Wiese Reference Wiese1998). In contrast, the FRG framework allows one to access this fixed point in all dimensions even at the lowest order of the derivative expansion (Canet Reference Canet2005; Canet et al. Reference Canet, Chaté, Delamotte and Wschebor2010). This fixed point turns out to be genuinely non-perturbative, i.e. not connected to the Edwards–Wilkinson fixed point (which is the point around which perturbative expansions are performed) in any dimension, hence explaining the failure of perturbation theory, to all orders. We now briefly review these results.
5.1. The FRG for the Burgers–KPZ equation
The correlation function (5.2) can be computed from the two-point functions  $\varGamma ^{(2)}$. The general FRG flow equation for these functions is obtained by differentiating twice the exact flow equation (4.6) for the effective average action
 $\varGamma _\kappa$. Assuming translational invariance in space and time, it can be evaluated at zero fields and then reads
 \begin{align} & \partial_\kappa \bar\varGamma^{(2)}_{\kappa,\ell m}(\varpi,\boldsymbol{p})= {\rm Tr} \int_{\omega,\boldsymbol{q}} \partial_\kappa {\mathcal{R}}_\kappa(\boldsymbol{q}) \boldsymbol{\cdot} \bar G_\kappa(\omega,\boldsymbol{q}) \boldsymbol{\cdot} \left(-\frac{1}{2} \bar\varGamma^{(4)}_{\kappa,\ell m}(\varpi,\boldsymbol{p},-\varpi,-\boldsymbol{p},\omega,\boldsymbol{q})\right. \nonumber\\ &\left.\qquad + \bar\varGamma^{(3)}_{\kappa,\ell}(\varpi,\boldsymbol{p},\omega,\boldsymbol{q}) \boldsymbol{\cdot} \bar G_\kappa(\varpi+\omega,\boldsymbol{p}+\boldsymbol{q}) \boldsymbol{\cdot} \bar\varGamma^{(3)}_{\kappa,m}(-\varpi,-\boldsymbol{p},\varpi+\omega,\boldsymbol{p}+\boldsymbol{q}) \vphantom{\frac{1}{2}}\right) \boldsymbol{\cdot} G_\kappa(\omega,\boldsymbol{q}), \end{align}
where the last arguments of the  $\bar \varGamma _\kappa ^{(n)}$ are implicit since they are determined by frequency and wavevector conservation according to (3.19). We used a matrix notation, where only the external field index
 $\ell$ and
 $m$ are specified, i.e.
 $\bar \varGamma ^{(3)}_{\kappa,\ell }$ is the
 $2\times 2$ matrix of all three-point vertices with one leg fixed at
 $(\ell,\varpi,\boldsymbol {p})$ and the other two spanning all fields, and similarly for
 $\bar \varGamma ^{(4)}_{\kappa,\ell m}$. It can be represented diagrammatically as in figure 1. In order to make explicit calculations, one has to make some approximation. Here, we resort to an ansatz for the effective average action
 $\varGamma _\kappa$, which then enables one to compute all the
 $n$-point functions entering the flow equation. A crucial point for the choice of this ansatz is to preserve the symmetries of the model. The fundamental symmetry of the Burgers equation is the Galilean invariance. As a consequence, the
 $n$-point vertices
 $\varGamma^{(n)}$ are related by similar identities as (3.31) (simply removing the pressure fields). Thus, a satisfactory ansatz for the Burgers effective average action should automatically satisfy all these identities. To devise such an ansatz is not a simple task in general. However, the construction can be understood in a rather intuitive way.
Let us define a function  $f(t,\boldsymbol {x})$ as a scalar density under the Galilean transformation (3.25) if its infinitesimal variation under this transformation is
 $\delta f(t,\boldsymbol {x}) = \varepsilon _\alpha (t)\partial _\alpha f(t,\boldsymbol {x})$ – i.e. it varies only due to the change of coordinates. This then implies that
 $\int _{\boldsymbol {x}} f(t,\boldsymbol {x})$ is invariant under a Galilean transformation. According to (3.25),
 $\bar {\boldsymbol {v}}$ is a scalar density, while
 $\boldsymbol {v}$ is not. However, one can build two scalar densities from it, which are
 $\partial _\alpha \boldsymbol {v}$ and the Lagrangian time derivative
 $D_t \boldsymbol {v} \equiv \partial _t \boldsymbol {v}+ {{v}}_\alpha \partial _\alpha \boldsymbol {v}$. One can then easily show that combining scalars together through sums and products preserves the scalar density property, as well as applying a gradient. While applying a time derivative
 $\partial _t$ spoils the scalar density property, the Lagrangian time derivative preserves it, which identifies
 $D_t$ as the covariant time derivative for Galilean transformation. These rules allow one to construct an ansatz which is manifestly invariant under the Galilean transformation.
The most advanced approximation, denoted SOA, which has been implemented so far for the Burgers–KPZ equation consists in truncating the effective average action  $\varGamma _\kappa$ at second order in the response field, and thus neglecting higher-order terms in this field which could in principle be generated by the RG flow. This means that the noise probability distribution is kept as Gaussian as in the original Langevin description, which sounds reasonable. The most general ansatz at this order compatible with the symmetries of the Burgers equation, i.e. using the previous construction, reads
 \begin{equation} \varGamma_\kappa[\boldsymbol{u},\bar{\boldsymbol{u}}] = \int_{t,\boldsymbol{x}}\{\bar u_\alpha f_{\kappa}^{\rho}(D_t,\boldsymbol{\nabla}) D_t u_\alpha -\bar u_{\alpha} f^{\nu}_{\kappa}(D_t,\boldsymbol{\nabla}) \nabla^{2} u_\alpha -\bar u_\alpha f^{D}_{\kappa}(D_t,\boldsymbol{\nabla}) \bar u_\alpha\}. \end{equation}
It is parametrised by three scale-dependent renormalisation functions  $f^{\nu }_{\kappa }$,
 $f^{D}_{\kappa }$ and
 $f^{\rho }_{\kappa }$, which are arbitrary functions of the covariant operators
 $\boldsymbol {\nabla }$ and
 $D_t$, beside depending on the RG scale
 $\kappa$. (Note that
 $f^{\nu }_{\kappa }$,
 $f^{D}_{\kappa }$ and
 $f^{\rho }_{\kappa }$ are scalar functions because they correspond to the longitudinal parts of
 $f^{\nu }_{\kappa,\alpha \beta }$,
 $f^{D}_{\kappa,\alpha \beta }$ and
 $f^{\rho }_{\kappa,\alpha \beta }$. The transverse parts vanish since the flow is potential.) Their initial condition at
 $\kappa =\varLambda$ is
 $f^{\nu }_\varLambda =\nu$,
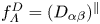 $f^{D}_\varLambda =(D_{\alpha \beta })^{\parallel }$ (longitudinal part of
 $D_{\alpha \beta }$) and
 $f^{\rho }_\varLambda =1$ for which the initial Burgers–KPZ action (3.20) is recovered. The ansatz (5.6) encompasses the most general dependence in wavenumbers and frequencies, and also in velocity fields, of the two-point functions compatible with Galilean invariance. Indeed, arbitrary powers of the velocity field
 $\boldsymbol {u}$ are included through the operator
 $D_t$. Thus
 $\varGamma _\kappa$ is truncated only in the response field, not in the field itself.
The choice of an ansatz allows one to compute explicitly all the vertices  $\varGamma _\kappa ^{(n)}$, their expression can be found in Canet et al. (Reference Canet, Chaté, Delamotte and Wschebor2011b). For example, it yields for the two-point functions in Fourier space
 \begin{equation} \left. \begin{aligned} \bar{\varGamma}_\kappa^{(1,1)}(\omega,\boldsymbol{p}) & = {\rm i}\omega f_\kappa^{\rho}\left(\omega, \boldsymbol{p}\right) + \boldsymbol{p}\,^{2} f_\kappa^{\nu}(\omega,\boldsymbol{p}) \\ \bar{\varGamma}_\kappa^{(0,2)}(\omega,\boldsymbol{p}) & ={-}2 f_\kappa^{D}(\omega,\boldsymbol{p}). \end{aligned} \right\} \end{equation}
The flow equations for the three functions  $f^{\nu }_\kappa$,
 $f^{D}_\kappa$ and
 $f^{\rho }_\kappa$ can then be computed from the flow equations (5.5). More details on the calculation, in particular on the choice of the regulator, are provided in § 6 for NS, and can be found for Burgers–KPZ in e.g. (Canet et al. Reference Canet, Chaté, Delamotte and Wschebor2011b).
5.2. Scaling dimensions
With the aim of analysing the fixed-point structure, one defines dimensionless and renormalised quantities. First, one introduces scale-dependent coefficients  $\nu _\kappa \equiv f_\kappa ^{\nu }(0,0)$ and
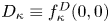 $D_\kappa \equiv f_\kappa ^{D}(0,0)$ (equivalently
 $D_\kappa$ is defined from
 $f_\kappa ^{D}$ evaluated at a finite
 $\boldsymbol {p}$ if
 $f_\kappa ^{D}$ is non-analytic at
 $p=0$) which identify at the microscopic scale
 $\kappa =\varLambda$ with the parameters
 $\nu$ and
 $D$ of the action (3.20). (Note that the scaling dimension of
 $f_\kappa ^{\rho }$ is fixed to 1 by the symmetries so there is no need to introduce a coefficient
 $\rho _\kappa$ associated with this function.) They are associated with scale-dependent anomalous dimensions as
 \begin{equation} \eta_\kappa^{D} ={-}\partial_s \ln D_\kappa ,\quad \eta^{\nu}_\kappa ={-}\partial_s \ln \nu_\kappa , \end{equation}
where  $s=\ln (\kappa /\varLambda )$ is the RG ‘time’ and
 $\partial _s = \kappa \partial _\kappa$. Indeed, one expects that if a fixed point is reached, these coefficients behave as power laws
 $D_\kappa \sim \kappa ^{-\eta _*^{D}}$ and
 $\nu _\kappa \sim \kappa ^{-\eta _*^{\nu }}$ where the
 $*$ denotes fixed-point quantities. The physical critical exponents can then be deduced from
 $\eta ^{D}_*$ and
 $\eta ^{\nu }_*$. For this, let us determine the scaling dimensions of the fields from (5.6). The three functions
 $f^{\nu }_\kappa$,
 $f^{D}_\kappa$ and
 $f^{\rho }_\kappa$ have respective scaling dimensions
 $\nu _\kappa$,
 $D_\kappa$ and
 $\rho _\kappa \equiv 1$ by definition of these coefficients. Since
 $\varGamma _\kappa$ has no dimension, one deduces from the term
 $\propto \partial _t$ in
 $\varGamma _\kappa$ that
 $[u_\alpha \bar u_\alpha ] = \kappa ^{d}$ and from the viscosity term that
 $[u_\alpha \bar u_\alpha ]=\kappa ^{d} \omega \kappa ^{-2}\nu _\kappa ^{-1}$. Equating the two terms, this implies that the scaling dimension of the frequency is
 $[\omega ] = \nu _\kappa \kappa ^{2} \equiv \kappa ^{z}$, which defines the dynamical critical exponent as
 $z=2-\eta ^{\nu }_*$. The scaling dimensions of the fields can then be deduced from the forcing term of
 $\varGamma _\kappa$ as
 \begin{equation} [u_\alpha] = (\kappa^{d-2}D_\kappa \nu_\kappa^{{-}1})^{1/2} ,\quad [\bar u_\alpha] = (\kappa^{d+2}\nu_\kappa D_\kappa^{{-}1})^{1/2} . \end{equation}
This implies in particular that the roughness critical exponent  $\chi$ is related to
 $\eta _*^{\nu }$ and
 $\eta _*^{D}$ as
 $\chi = (2-d-\eta _*^{\nu }+\eta _*^{D})/2$.
To introduce dimensionless quantities, denoted with a hat symbol, wavevectors are measured in units of  $\kappa$, e.g.
 $\boldsymbol {p} =\kappa \hat {\boldsymbol {p}}$ and frequencies in units of
 $\nu _\kappa \kappa ^{2}$, e.g.
 $\omega = \nu _\kappa \kappa ^{2} \hat {\omega }$. Dimensionless fields are defined as
 $\hat {\boldsymbol {u}} =(\kappa ^{d-2}D_\kappa \nu _\kappa ^{-1})^{-1/2} \boldsymbol {u}$,
 $\hat {\bar {\boldsymbol {u}}} = (\kappa ^{d+2}\nu _\kappa D_\kappa ^{-1})^{-1/2}\bar {\boldsymbol {u}}$, and dimensionless functions as
 \begin{align} \hat{f}_\kappa^{\nu}(\hat\omega,\hat{\boldsymbol{p}})\equiv\frac{1}{\nu_\kappa} f_\kappa^{\nu}\left(\frac{\omega}{\nu_\kappa \kappa^{2}},\frac{\boldsymbol{p}}{\kappa}\right),\quad \hat{f}_\kappa^{D}(\hat\omega,\hat{\boldsymbol{p}}) \equiv\frac{1}{D_\kappa} f_\kappa^{D}\left(\frac{\omega}{\nu_\kappa \kappa^{2}},\frac{\boldsymbol{p}}{\kappa}\right),\quad \hat{f}_\kappa^{\rho}(\hat\omega,\hat{\boldsymbol{p}}) \equiv f_\kappa^{\rho}\left(\frac{\omega}{\nu_\kappa \kappa^{2}},\frac{\boldsymbol{p}}{\kappa}\right). \end{align}
The non-dimensionalisation of the fields introduces a scaling dimension in front of the advection term. We define the corresponding dimensionless coupling as  $\hat {\lambda }_\kappa = (\kappa ^{d-4}D_\kappa \nu _\kappa ^{-3})^{1/2}\lambda$ (where
 $\lambda$ is the KPZ parameter,
 $\lambda =1$ for the Burgers equation). The Ward identity for Galilean symmetry yields that
 $\lambda$ is not renormalised, i.e. it stays constant throughout the RG flow, or otherwise stated its flow is zero
 $\partial _s \lambda =0$. One thus obtains for the flow of
 $\hat {\lambda }_\kappa$
 \begin{equation} \partial_s \hat{\lambda}_\kappa = \frac{\hat\lambda_\kappa}{2} (d -4+ 3 \eta_\kappa^{\nu} -\eta_\kappa^{D}) . \end{equation}
One can deduce from this equation that if a non-trivial fixed point exists ( $\hat \lambda _*\neq 0$), then the fixed-point values of the anomalous dimensions satisfy the exact relation
 \begin{equation} d -4+ 3 \eta_*^{\nu} -\eta_*^{D}=0 . \end{equation}
Using the definitions of the critical exponents, this relation writes  $\chi +z=2$ in all dimensions, which is the exact identity mentioned in the introduction of this section.
5.3. Results in  $d=1$

Let us focus on the case  $\beta =2$, i.e.
 $D_{\alpha \beta }(\boldsymbol {p})\equiv D p_\alpha p_\beta$ in (3.20), which corresponds to the KPZ equation, because exact results are available for this case in one dimension. In
 $d=1$, there exists an additional discrete time-reversal symmetry which greatly simplifies the problem. This is one of the reasons why exact results could be obtained in this dimension only. In particular, one can show that it implies a particular form of fluctuation–dissipation theorem which writes for the two-point functions (Frey & Täuber Reference Frey and Täuber1994; Canet et al. Reference Canet, Chaté, Delamotte and Wschebor2011b)
 \begin{equation} 2{Re}\bar\varGamma_\kappa^{(1,1)}(\omega,\boldsymbol{p}) ={-}\frac{\nu}{D}p^{2}\bar\varGamma_\kappa^{(0,2)}(\omega,\boldsymbol{p}), \end{equation}
and in turn entails that  $D_\kappa =\nu _\kappa$,
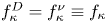 $f_\kappa ^{D} = f_\kappa ^{\nu }\equiv f_\kappa$ and
 $f_\kappa ^{\rho }\equiv 1$. (Note that the viscosity term in (5.6) has to be symmetrised to exactly preserve the Ward identities ensuing from the time-reversal symmetry for all the
 $n$-point vertices, see Canet et al. (Reference Canet, Chaté, Delamotte and Wschebor2011b).) Thus there remains only one renormalisation function
 $f_\kappa$ and one anomalous dimension
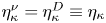 $\eta _\kappa ^{\nu }=\eta _\kappa ^{D}\equiv \eta _\kappa$ to compute in
 $d=1$. This implies that the fixed-point value of the latter is fixed exactly by (5.12) to
 $\eta _*=1/2$, which yields the well-known values
 $\chi =1/2$ and
 $z=3/2$. The flow equation for the associated dimensionless function
 $\hat {f}_\kappa$ reads
 \begin{equation} \partial_s \hat{f}_\kappa(\hat{\omega},\hat{\boldsymbol{p}}) = [\eta_\kappa +(2-\eta_\kappa) \hat{\omega} \;\partial_{\hat{\omega}} + \hat{\boldsymbol{p}} \;\partial_{\hat{\boldsymbol{p}}}]\hat{f}_\kappa(\hat{\omega},\hat{\boldsymbol{p}}) +\frac{1}{D_\kappa} \partial_s f_\kappa(\omega,\boldsymbol{p}), \end{equation}
where the first term in square bracket comes from the non-dimensionalisation (5.10a–c) and the last term corresponds to the nonlinear loop term calculated from the flow equations (5.5), which has to be expressed in terms of the dimensionless (hat) quantities.
This flow equation can be integrated numerically, from the initial condition  ${\hat {f}_{\varLambda }(\hat \omega,\hat {\boldsymbol{p}})=1}$ at scale
 $\kappa =\varLambda$. This has been performed in Canet et al. (Reference Canet, Chaté, Delamotte and Wschebor2011b), to which we refer the reader for details. One obtains that the flow reaches a fixed point, where all quantities stop evolving. The function
 $\hat {f}_\kappa$ converges to a fixed form
 $\hat {f}_*(\hat \omega,\hat {\boldsymbol {p}})$, which behaves as a power law at large
 $\boldsymbol {p}$ and large
 $\omega$ as
 \begin{equation} \hat{f}_{\kappa}(\hat\omega,\hat{\boldsymbol{p}}) \stackrel{|\hat{\boldsymbol{p}}|\gg 1}{\sim} |\boldsymbol{p}|^{-\eta_*},\quad \hat{f}_{\kappa}(\hat\omega,\hat{\boldsymbol{p}}) \stackrel{\omega\gg 1}{\sim} \omega^{-\eta_*/(2-\eta_*)}. \end{equation}
In fact, this is expected from a very important property of the flow equation called decoupling. Decoupling means that the loop contribution  ${\partial _s f_{\kappa }}/{D_\kappa }$ in the flow equation (5.14) becomes negligible in the limit of large wavenumbers and/or frequencies compared with the linear terms. Intuitively, a large wavenumber is equivalent to a large mass, and degrees of freedom with a large mass are damped and do not contribute in the dynamics at large scales. This means that the IR (effective) properties are not affected by the UV (microscopic) details, and this pertains to the mechanism for universality. Moreover, one can prove that the decoupling property entails scale invariance. Indeed, if the loop contribution
 $\partial _s \hat f_{\kappa }$ is negligible compared with the linear terms, one can readily prove that the general solution of (5.14) takes the scaling form
 \begin{equation} \hat{f}^{*}(\hat{\omega},\hat{\boldsymbol{p}}) = \frac{1}{|\hat{\boldsymbol{p}}|^{\eta_*}} \hat{\zeta}\left(\frac{\hat{\omega}}{|\hat{\boldsymbol{p}}|^{z}}\right), \end{equation}
where  $\hat {\zeta }$ is a universal scaling function, which can be determined by explicitly integrating the full flow equation (5.14). The physical correlation function (5.2) can be deduced from the ansatz as
 \begin{equation} C(\omega,\boldsymbol{p}) ={-} \frac{\varGamma^{(0,2)}(\omega,\boldsymbol{p})}{|\varGamma^{(1,1)}(\omega,\boldsymbol{p})|^{2}} = \frac{2 f(\omega,\boldsymbol{p})}{\omega^{2} + p^{4} f(\omega,\boldsymbol{p})^{2}}. \end{equation}
Replacing the function  $f$ by its fixed-point form (5.16) and using the value
 $\eta _*=1/2$, one obtains
 \begin{equation} \hat C(\hat\omega,\hat{\boldsymbol{p}}) = \frac{2}{\hat p^{7/2}} \frac{ \hat{\zeta} \left(\dfrac{\hat{\omega}}{\hat{p}^{3/2}}\right)}{{\hat{\omega}^{2}}/{\hat{p}^{3}}+\hat{\zeta}^{2} \left(\dfrac{\hat{\omega}}{\hat{p}^{3/2}}\right)} \equiv \frac{2}{\hat p^{7/2}} \mathring{F}\left(\frac{\hat\omega}{\hat p^{3/2}}\right). \end{equation}
The physical (dimensional) correlation function  $C(\omega,\boldsymbol {p})$ takes the exact same form up to normalisation constants which are fixed in terms of the KPZ parameters
 $\nu$,
 $D$ and
 $\lambda$ and the fixed-point value of the dimensionless coupling
 $\hat \lambda _*$.
In the context of the KPZ equation, it is a very important result. First, this proves the existence of generic scaling, i.e. that the KPZ interface always becomes critical (rough) in  $d=1$, and so that its correlations are indeed described by the universal scaling form (5.2). Second, the associated scaling functions have been computed exactly in Prähofer & Spohn (Reference Prähofer and Spohn2000), and can be compared with the FRG result. In particular, the exactly known function, denoted
 $f(y)$, and its Fourier transform, denoted
 $\tilde {f}(k)$, are related to the FRG function
 $\mathring {F}$ by the integral relations
 \begin{equation} \tilde{f}(k) = \int_0^{\infty} \frac{{\rm d}\tau}{\rm \pi} \cos(\tau k^{3/2}) \mathring{F}(\tau) ,\quad f(y) = \int_0^{\infty}\frac{{\rm d}k}{\rm \pi} \cos(k y )\tilde{f}(k). \end{equation}
The functions  $f(y)$ and
 $\tilde {f}(k)$ computed from the FRG approach are displayed in figure 2 together with the exact results. Let us emphasise that there are no fitting parameters. The FRG functions match with extreme accuracy the exact ones. Interestingly, the function
 $\tilde {f}(k)$ is studied in detail in Prähofer & Spohn (Reference Prähofer and Spohn2004), which show that this function first monotonically decreases to vanish at
 $k_0\simeq 4.4$, then exhibits a negative dip, after which it decays to zero with a stretched exponential tail, over which are superimposed tiny oscillations around zero, only apparent on a logarithmic scale (inset of figure 2). The FRG function reproduces all these features. Regarding the tiny magnitude over which they develop, this agreement is remarkable. The Burgers equation with other values of
 $\beta >0$ has been studied in Kloss et al. (Reference Kloss, Canet, Delamotte and Wschebor2014a), which confirms the result (5.3).
Scaling function  $f(y)$ (a) and
 $\tilde f(k)$ (b) for the 1-D Burgers–KPZ equation from FRG compared with the exact result from Prähofer & Spohn (Reference Prähofer and Spohn2000).
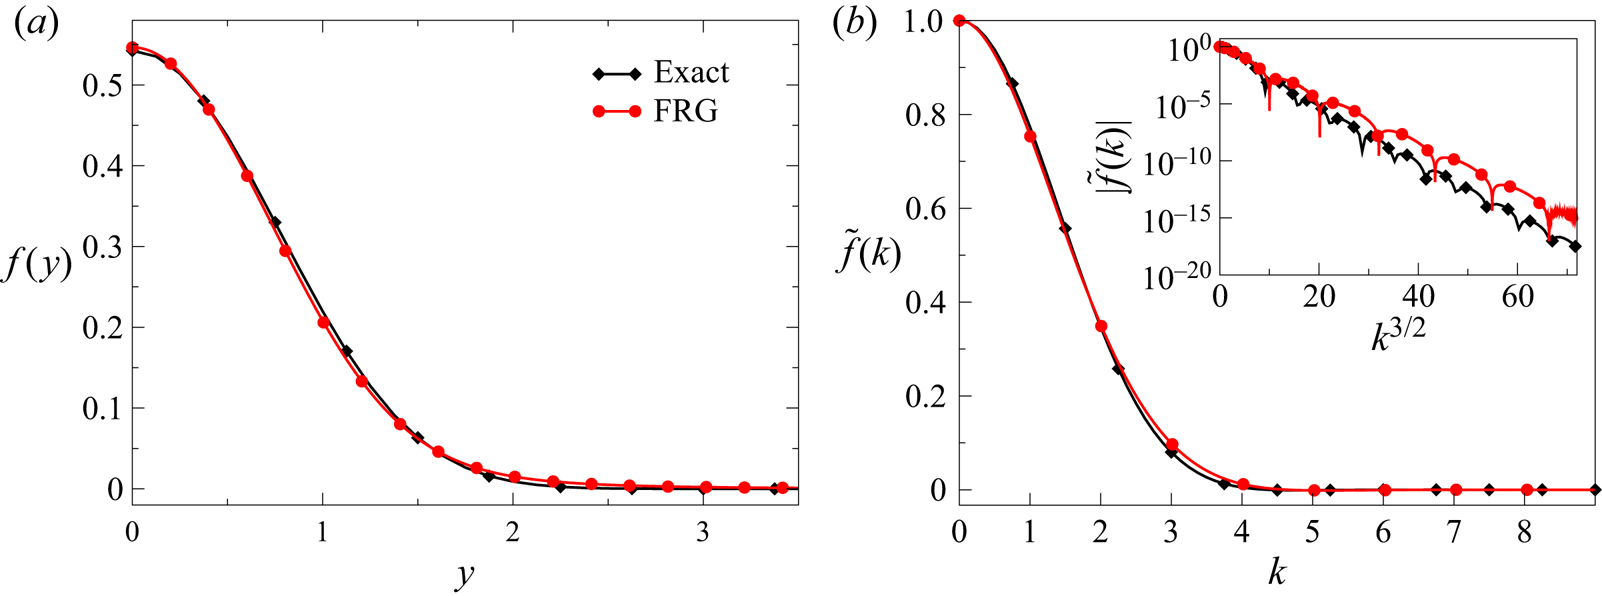
5.4. Results in $d>1$

In dimensions  $d>1$, the Burgers equation has also been studied only for
 $\beta >0$, which is equivalent to the KPZ equation with long-range noise. As explained at the beginning of the section, for
 $\beta =2$, the KPZ rough phase is controlled by a strong-coupling fixed point, and perturbative RG fails to all orders to find it. Moreover, none of the mathematical methods used to derive exact results in
 $d=1$ can be extended to non-integrable cases, which include
 $d\neq 1$. In contrast, the FRG can be straightforwardly applied to any dimension, and thereby offers the only controlled analytical approach to study this problem, and it has been used in several works (Kloss, Canet & Wschebor Reference Kloss, Canet and Wschebor2012; Kloss et al. Reference Kloss, Canet, Delamotte and Wschebor2014a; Kloss, Canet & Wschebor Reference Kloss, Canet and Wschebor2014b; Squizzato & Canet Reference Squizzato and Canet2019). We will not review all these results here since they are mainly concern with KPZ. Perhaps the most noteworthy result is that the FRG provided the critical exponents and scaling functions in the physical dimensions
 $d=2,3$, as well as other universal quantities, such as universal amplitude ratios. The estimates for these amplitude ratios in
 $d=2,3$ were later confirmed in large-scale numerical simulations within less than 1 % error in Halpin-Healy (Reference Halpin-Healy2013a,Reference Halpin-Healyb). The whole scaling function in
 $d=2$ was computed in numerical simulations of the non-equilibrium Gross–Pitaevskii equation, which surprisingly falls into the KPZ universality class for certain parameters (Deligiannis et al. Reference Deligiannis, Fontaine, Squizzato, Richard, Ravets, Bloch, Minguzzi and Canet2022). The numerical result agrees very precisely with the FRG result, as shown in figure 3.
Scaling function for the 2-D Burgers–KPZ equation from FRG compared with numerical simulations from Deligiannis et al. (Reference Deligiannis, Fontaine, Squizzato, Richard, Ravets, Bloch, Minguzzi and Canet2022).

For other values of  $\beta$, the results (5.3) were extended to
 $d>1$, yielding
 \begin{equation} \chi = \max\left(\dfrac 1 3(4-d-\beta_t(d), -\dfrac 1 3(4-d-\beta) +1\right) , \end{equation}
where  $\beta _t(1)=3/2$ and monotonically decreases with
 $d$. The complete phase diagram of the problem has also been determined in Kloss et al. (Reference Kloss, Canet, Delamotte and Wschebor2014a).
The values  $\beta >0$ correspond to a forcing mainly exerted at small scales, where it rather plays the role of a microscopic noise, which can be interpreted as a thermal noise for
 $\beta =2$. This then describes a fluid at rest submitted to thermal fluctuations, as studied in Forster et al. (Reference Forster, Nelson and Stephen1977). The values
 $\beta <0$ correspond to a large-scale forcing relevant for turbulence. This case has not been studied yet using FRG but it certainly deserves to be addressed in future works. In particular, it would be interesting to investigate whether the decoupling property breaks down for
 $\beta <0$, as occurs for NS, which is presented in the next section.
6. Fixed point for NS turbulence
As mentioned in § 2, perturbative RG approaches to turbulence have been hindered by the need to define a small parameter. The introduction of a forcing with power-law correlations  $\propto p^{4-d-\varepsilon }$ leads to a fixed point with an
 $\varepsilon$-dependent energy spectrum, which is not easily linked to the expected Kolmogorov one. In this respect, the first achievement of FRG was to find the fixed point corresponding to fully developed turbulence generated by a physical forcing concentrated at the integral scale. As explained in § 4.3, the crux is that one can devise in the FRG framework approximation schemes which are not based on a small parameter, thereby circumventing the difficulties encountered by perturbative RG. This fixed point was first obtained in a pioneering work by Tomassini (Tomassini Reference Tomassini1997), which was largely overlooked at the time. He developed an approximation close in spirit to the BMW approximation, although it was not yet invented at the time. In the meantime, the FRG framework was successfully developed to study the Burgers–KPZ equation, as stressed in § 5. Inspired by the KPZ example, the stochastic NS equation was revisited using similar FRG approximations in Mejía-Monasterio & Muratore-Ginanneschi (Reference Mejía-Monasterio and Muratore-Ginanneschi2012) and Canet et al. (Reference Canet, Delamotte and Wschebor2016). We now present the resulting fixed point describing fully developed turbulence.
To show the existence of the fixed point and characterise the associated energy spectrum, one can focus on the two-point correlation functions. We follow in this section the same strategy as for the Burgers problem, that is, we resort to an ansatz for the effective average action  $\varGamma _\kappa$ to close the flow equations. It is clear that it is an approximation, and we establish the existence of the fixed point within this approximation. However, as manifest in § 5, it constitutes a very reliable approximation, built and constrained from the symmetries, which leads to extremely accurate results in the case of the Burgers equation. It is certainly reliable enough to prove the very existence of the fixed point. Of course, the quantitative estimates associated with this fixed point could be systematically improved by implementing successive orders of the approximation scheme.
6.1. Ansatz for the effective average action
One can first infer the general structure of  $\varGamma _\kappa$ for NS equations stemming from the symmetry constraints analysed in § 3.3 and Appendix A. On can show that it endows the following form:
 \begin{equation} \varGamma_\kappa[\boldsymbol{u},\bar{\boldsymbol{u}},p,\bar p] = \int_{t,\boldsymbol{x}}\left[ \bar u_\alpha \left(\partial_t u_\alpha+ u_\beta \partial_\beta u_\alpha +\frac{\partial_\alpha {\rm \pi}}{\rho}\right) +\bar {\rm \pi}\partial_\alpha u_\alpha\right] +\tilde \varGamma_\kappa[\boldsymbol{u},\bar{\boldsymbol{u}}], \end{equation}
where the explicit terms in square brackets are not renormalised, i.e. they remain unchanged throughout the RG flow, and are thus identical to the corresponding terms in the NS action. The functional  $\tilde \varGamma _\kappa$ is renormalised, but it has to be invariant under all the extended symmetries of the NS action since they are preserved by the RG flow.
Let us now comment on the choice of the regulator. It should be quadratic in the fields, satisfy the general constraints (4.3), and preserve the symmetries. A suitable choice is
 \begin{align} \Delta {\mathcal{S}}_\kappa[\boldsymbol{u},\bar{\boldsymbol{u}}] ={-}\int_{t,\boldsymbol{x},\boldsymbol{x}'} \left\{\bar u_\alpha(t,\boldsymbol{x}) N_{\kappa,\alpha \beta}(|\boldsymbol{x}-\boldsymbol{x}'|)\bar u_\beta(t,\boldsymbol{x}')+\bar u_\alpha(t,\boldsymbol{x}) R_{\kappa,{\alpha \beta}}(|\boldsymbol{x}-\boldsymbol{x}'|) u_\beta(t,\boldsymbol{x}') \right\} . \end{align}
The first term is simply the original forcing term, promoted to a regulator by replacing the integral scale  $L$ by the RG scale
 $\kappa ^{-1}$, since it naturally satisfies all the requirements. The forcing thus builds up with the RG flow, and the physical forcing scale is restored when
 $\kappa = L^{-1}$. The additional
 $R_\kappa$ term can be interpreted as an Eckman friction term in the NS equation. Its presence is fundamental in
 $d=2$ to damp the energy transfer towards the large scales. Within the FRG formalism, the energy pile-up at large scales manifests itself as an IR divergence in the flow equation when the
 $R_\kappa$ term is absent, which is removed by its presence. This term is thus mandatory to properly regularise the RG flow in
 $d=2$. Its effect is to introduce an effective energy dissipation at the boundary of the effective volume
 $\kappa ^{-d}$. This form of dissipation is negligible in
 $d=3$ compared with the dissipation at the Kolmogorov scale.
Introducing a scale-dependent forcing amplitude  $D_\kappa$ and a scale-dependent viscosity
 $\nu _\kappa$, the two regulator terms can be parametrised as
 \begin{equation} N_{\kappa,\alpha \beta}(\boldsymbol{q})=\delta_{\alpha\beta} D_ \kappa \hat{n}(\boldsymbol{q}/\kappa),\quad R_{\kappa,\alpha \beta}(\boldsymbol{q})=\delta_{\alpha\beta} \nu_ \kappa \boldsymbol{q}^{2}\hat{r}(\boldsymbol{q}/\kappa). \end{equation}
They are chosen diagonal in components without loss of generality since the propagators are transverse due to incompressibility, and thus the component  $\propto q_\alpha q_\beta$ plays no role in the flow equations. The general structure of the propagator matrix
 $\bar G_\kappa$, i.e. the inverse of the Hessian of
 $\varGamma _\kappa +{\Delta {\mathcal {S}}_\kappa }$ is determined in Appendix B. One can show in particular that the propagator in the velocity sector is purely transverse
 \begin{equation} \bar G_{\kappa,\alpha\beta}(\omega,\boldsymbol{q}) = P^{{\perp}}_{\alpha\beta}(\boldsymbol{q}) \bar G_{\kappa,\perp}(\omega,\boldsymbol{q}) , \quad P^{{\perp}}_{\alpha\beta}(\boldsymbol{q}) = \delta_{\alpha\beta} -\frac{q_\alpha q_\beta}{q^{2}} . \end{equation}
So far we have just given in (6.1) the general structure of  $\varGamma _\kappa$ stemming from symmetry constraints. Now, one needs to make an approximation in order to solve the flow equations. For this, we devise an ansatz for
 $\tilde \varGamma$, which is very similar to the one considered for the Burgers problem. It is built to automatically preserve the Galilean symmetry. For NS, a lower-order approximation than the SOA one (5.6) was implemented. It is called LO (leading order) and was first introduced in the context of Burgers–KPZ in Canet et al. (Reference Canet, Chaté, Delamotte and Wschebor2010). The LO approximation consists in keeping the most general wavevector, but not frequency, dependence for the two-point functions. The corresponding ansatz reads
 \begin{equation} \tilde \varGamma_\kappa[\boldsymbol{u},\bar{\boldsymbol{u}}] = \int_{t,\boldsymbol{x},\boldsymbol{x}'}\{\bar u_\alpha(t,\boldsymbol{x}) f^{\nu}_{\kappa,\alpha \beta}(\boldsymbol{x}-\boldsymbol{x}') u_\beta(t,\boldsymbol{x}') -\bar u_\alpha(t,\boldsymbol{x}) f^{D}_{\kappa,\alpha \beta}(\boldsymbol{x}-\boldsymbol{x}') \bar u_\beta(t,\boldsymbol{x}')\}. \end{equation}
Compared with (5.6), the functions  $f^{\nu }_\kappa$ and
 $f^{D}_\kappa$ no longer depend on the covariant operator
 $D_t$, which amounts to neglecting the frequency dependence, but also the dependence in the field
 $\boldsymbol {u}$. For this reason, all higher-order vertices apart from the one present in the original NS action vanish. This means that the renormalisation of multi-point interactions is neglected in this ansatz, which is a rather simple approximation. However, it is sufficient for the Burgers–KPZ problem to find the fixed point in all dimensions. At LO, the flow is projected onto the two renormalisation functions
 $f_\kappa ^{\nu }$ and
 $f_\kappa ^{D}$ which can be interpreted as an effective viscosity and an effective forcing.
The initial condition of the flow at scale  $\kappa =\varLambda$ corresponds to
 \begin{equation} f^{D}_{\varLambda,\alpha \beta}(\boldsymbol{x}-\boldsymbol{x}')=0 ,\quad f^{\nu}_{\varLambda,\alpha \beta}(\boldsymbol{x}-\boldsymbol{x}')={-}\nu \delta_{\alpha \beta}\nabla_x^{2} \delta^{(d)}(\boldsymbol{x}-\boldsymbol{x}') \end{equation}
such that one recovers the original NS action (3.22). (Note that the forcing has been incorporated in the regulator part  $\Delta {\mathcal {S}}_\kappa$ which is why the initial condition of
 $f^{D}_{\varLambda,\alpha \beta }$ is zero.)
The calculation of the two-point functions from the LO ansatz is straightforward. At vanishing fields and in Fourier space, one obtains
 \begin{equation} \left. \begin{aligned} \tilde\varGamma_{\kappa,\alpha\beta}^{(1,1)}(\omega,\boldsymbol{p}) & =f^{\nu}_{\kappa,\alpha\beta}(\boldsymbol{p}),\\ \tilde\varGamma_{\kappa,\alpha\beta}^{(0,2)}(\omega,\boldsymbol{p}) & ={-}2f^{D}_{\kappa,\alpha\beta}(\boldsymbol{p}). \end{aligned} \right\} \end{equation}
Within the LO approximation, the only non-zero vertex function is the one present in the NS action, which reads in Fourier space
 \begin{equation} \bar \varGamma_{\kappa,\alpha\beta\gamma}^{(2,1)}(\omega_1,\boldsymbol{p}_1,\omega_2,\boldsymbol{p}_2) ={-}{\rm i} (p_2^{\alpha} \delta_{\beta\gamma} + p_1^{\beta} \delta_{\alpha\gamma}). \end{equation}
One can then compute the flow equations for the two-point functions  $\tilde \varGamma ^{(1,1)}_{\kappa,\alpha \beta }$ and
 $\tilde \varGamma ^{(0,2)}_{\kappa,\alpha \beta }$ from (5.5). They are purely transverse, and one can deduce from them the flow equations for
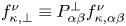 $f_{\kappa,\perp }^{\nu }\equiv P_{\alpha \beta }^{\perp } f^{\nu }_{\kappa,\alpha \beta }$ and
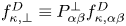 $f_{\kappa,\perp }^{D}\equiv P_{\alpha \beta }^{\perp } f^{D}_{\kappa,\alpha \beta }$, see Appendix B for details and their explicit expressions.
6.2. Stationarity
Since we are interested in the existence of a fixed point, it is convenient to non-dimensionalise all quantities by the RG scale as was done for the Burgers equation in § 5.2. The two coefficients  $D_\kappa$ and
 $\nu _\kappa$ are associated with anomalous dimensions
 $\eta _\kappa ^{D} = -\partial _s \ln D_\kappa$ and
 $\eta ^{\nu }_\kappa = -\partial _s \ln \nu _\kappa$. As one expects a power-law behaviour for the coefficient
 $\nu _\kappa$ beyond a certain scale, e.g. the Kolmogorov scale
 $\eta ^{-1}$, one can relate it to the physical viscosity
 $\nu \equiv \nu _\varLambda$ as
 \begin{equation} \nu_\kappa = \nu_{\eta^{{-}1}} ({\kappa}\eta)^{-\eta^{\nu}} \simeq \nu_{\varLambda} ({\kappa}\eta)^{-\eta^{\nu}} . \end{equation}
Because of Galilean invariance, the two anomalous dimensions  $\eta _\kappa ^{D}$ and
 $\eta _\kappa ^{\nu }$ are not independent as in the Burgers case and satisfy the same exact relation (5.12), which can be used to eliminate for instance
 $\eta _\kappa ^{\nu }$ as
 \begin{equation} \eta_\kappa^{\nu} = (4-d+\eta_\kappa^{D})/3 . \end{equation}
The running anomalous dimension  $\eta ^{D}_\kappa$ should be determined by computing the flow equation for
 $D_\kappa$, which has to be integrated along with the flow equations for
 $f_{\kappa,\perp }^{\nu }(\boldsymbol {p})$ and
 $f_{\kappa,\perp }^{\nu }(\boldsymbol {p})$. In the case of fully developed turbulence, the value of
 $\eta ^{D}_\kappa$ can be inferred by requiring a stationary state, that is that the mean injection rate balances the mean dissipation rate all along the flow. The average injected power by unit mass at the scale
 $\kappa$ can be expressed as (Canet et al. Reference Canet, Delamotte and Wschebor2016)
 \begin{align} \bar\epsilon =\langle \epsilon_{inj} \rangle &= \left\langle f_\alpha(t,\boldsymbol{x}) {{v}}_\alpha(t,\boldsymbol{x}) \right\rangle =\lim_{\delta t\to 0^{+}}\int_{\boldsymbol{x}'} N_{\kappa,\alpha\beta}(|\boldsymbol{x}-\boldsymbol{x}'|)\, G^{u\bar u}_{\kappa,\alpha\beta}(t+\delta t,\boldsymbol{x};t,\boldsymbol{x}')\nonumber\\ &=D_\kappa \kappa^{d} \lim_{\delta t\to 0^{+}} \left[(d-1) \int_{\hat \omega,\hat{\boldsymbol{q}}} \hat n(\hat{\boldsymbol{q}}) \exp({-{\rm i}\hat \omega \hat {\delta t}})\hat G^{u\bar u}_{\kappa,\perp}(\hat \omega,\hat{\boldsymbol{q}}) \right]\nonumber\\ & \equiv D_\kappa \kappa^{d} \hat{\gamma}, \end{align}
where  $\hat {\gamma }$ depends only on the forcing profile since the frequency integral of the response function is one because of causality. It is given by
 \begin{equation} \hat{\gamma} = (d-1)\int\frac{d^{d} \hat{\boldsymbol{q}}}{(2{\rm \pi})^{d}} \hat n(\hat{\boldsymbol{q}}) = (d-1)\frac{2 {\rm \pi}^{d/2}}{(2{\rm \pi})^{d}\varGamma(d/2)}\int_0^{\infty} \,{\rm d}\hat{q}\, \hat{q}^{d-1}\hat n(\hat q), \end{equation}
where the last identity holds for an isotropic forcing.
The conditions for stationarity depend on the dimension, and in particular on the main form of energy dissipation, which differs in  $d=3$ and
 $d=2$. Let us focus in the following on
 $d=3$. One can show that in this dimension, the dissipation at the Kolmogorov scale prevails on the dissipation at the boundary mediated by the regulator
 $R_\kappa$, and that it does not depend on
 $\kappa$ (it is given through an integral dominated by its UV bound
 $\propto \eta ^{-1}$). One concludes that to obtain a steady state, the mean injection should balance the mean dissipation and thus it should not depend on
 $\kappa$ either. This requires
 $D_\kappa \sim \kappa ^{-d}$, that is
 $\eta _\kappa ^{D} = d =3$. The value of
 $\eta ^{\nu }$ is then fixed by (6.10) to
 $\eta ^{\nu }=4/3$.
Thus, one may express the running coefficient  $\nu _\kappa$ using (6.9) and the coefficient
 $D_\kappa$ in term of the injection rate using (6.11) as
 \begin{equation} D_\kappa = \frac{\bar\epsilon}{ \hat\gamma} \kappa^{{-}3}, \quad \nu_\kappa = \bar\epsilon^{1/3}\kappa^{{-}4/3} , \end{equation}
where we used the definition of the Kolmogorov scale as  $\nu _\varLambda =\nu =\bar \epsilon ^{1/3}\eta ^{4/3}$.
Finally, the scaling dimension of any correlation or vertex function can be deduced from the scaling dimensions of the fields (as determined in § 5.2). This yields for instance for the two-point correlation function
 \begin{equation} \bar G^{uu}_{\kappa,\perp}(\omega,\boldsymbol{p}) = \frac{\bar\epsilon^{1/3}}{\hat{\gamma}\kappa^{13/3}} \hat{G}^{uu}_{\kappa,\perp}\left(\hat{\omega} = \frac{\omega}{\bar\epsilon^{1/3} \kappa^{2/3}},\hat{\boldsymbol{p}}=\frac{\boldsymbol{p}}{\kappa}\right) . \end{equation}
6.3. Fixed-point renormalisation functions
Using the analysis of § 6.2, we define the dimensionless functions  $\hat h_\kappa ^{\nu }$ and
 $\hat h_\kappa ^{D}$ as
 \begin{equation} f_{\kappa,\perp}^{\nu}(\boldsymbol{p}) = \nu_\kappa \,\kappa^{2}\,\hat p^{2}\, \hat h_\kappa^{\nu}(\hat{\boldsymbol{p}}) \quad{\rm and} \quad f_{\kappa,\perp}^{D}(\boldsymbol{p}) = D_\kappa \, \hat p^{2}\, \hat h_\kappa^{D}(\hat{\boldsymbol{p}}) . \end{equation}
The flow equations of  $\hat h_\kappa ^{\nu }$ and
 $\hat h_\kappa ^{D}$ are given by
 \begin{equation} \left. \begin{aligned} \partial_s \hat h_\kappa^{\nu}(\hat{\boldsymbol{p}}) & = \eta_\kappa^{\nu} \hat h_\kappa^{\nu}(\hat{\boldsymbol{p}}) +\hat{\boldsymbol{p}} \partial_{\hat{\boldsymbol{p}}} \hat h_\kappa^{\nu} (\hat{\boldsymbol{p}}) + \frac{\partial_s f_{\kappa,\perp}^{\nu}(\boldsymbol{p})}{\nu_\kappa \kappa^{2} \hat p^{2}}, \\ \partial_s \hat h_\kappa^{D}(\hat{\boldsymbol{p}}) & = (\eta_\kappa^{D}+2) \hat h_\kappa^{D}(\hat{\boldsymbol{p}}) +\hat{\boldsymbol{p}} \partial_{\hat{\boldsymbol{p}}} \hat h_\kappa^{D} (\hat{\boldsymbol{p}}) + \frac{\partial_s f_{\kappa,\perp}^{D}(\boldsymbol{p})}{D_\kappa\hat p^{2}} \end{aligned} \right\} \end{equation}
with the substitutions for dimensionless quantities in the flow equations (B8) and (B9) for  $\partial _s f_{\kappa,\perp }^{\nu }(\boldsymbol {p})$ and
 $\partial _s f_{\kappa,\perp }^{D}(\boldsymbol {p})$.
These flow equations are first-order differential equations in the RG scale  $\kappa$, they can be integrated numerically from the initial condition (6.6a,b), which corresponds to
 $\hat h_\kappa ^{\nu }(\hat {\boldsymbol {p}})=1$ and
 $\hat h_\kappa ^{D}(\hat {\boldsymbol {p}})=0$, down to
 $\kappa \to 0$. For this, the wavevectors are discretised on a (modulus, angle) grid. At each RG time step
 $s$, the derivatives are computed using five-point finite differences, the integrals are computed using Gauss–Legendre quadrature, with both interpolation and extrapolation procedures to evaluate combinations
 $\boldsymbol {p}+\boldsymbol {q}$ outside of the mesh points. One observes that the functions
 $\hat h_\kappa ^{\nu }$ and
 $\hat h_\kappa ^{D}$ smoothly deform from their constant initial condition to reach a fixed point where they stop evolving after a typical RG time
 $s\lesssim -10$. This is illustrated on figure 4, where the fixed-point functions recorded at
 $s=-25$ are highlighted with a thick line. This result shows that the fully developed turbulent state corresponds to a fixed point of the RG flow, which means that it is scale invariant. However, this fixed point exhibits a very peculiar feature.
The RG evolution of the renormalisation functions  $\hat h_\kappa ^{\nu }$ and
 $\hat h_\kappa ^{D}$ with the RG scale, from constant initial conditions (black horizontal lines) to their fixed-point shape (bold blue lines). The red arrows indicate the RG flow, decreasing the RG time from
 $s=0$ to
 $s=-25$. Insets: local exponents, defined by (6.18a,b), at the fixed point, with the corresponding K41 values indicated as dashed lines.

Indeed, the fixed-point functions are found to behave as power laws at large wavenumbers as expected. However, the corresponding exponents differ from their K41 values. The fixed-point functions can be described at large  $\hat {p}$ as
 \begin{equation} \hat h_*^{\nu}(\hat p) \sim \hat p^{-\eta^{\nu}+\delta \eta^{\nu}} \quad\text{and} \quad \hat h_*^{D}(\hat p) \sim \hat p^{-(\eta^{D}+2)+\delta \eta^{D}}, \end{equation}
where  $\delta \eta ^{\nu }$ and
 $\delta \eta ^{D}$ are the deviations from K41 scaling. The insets of figure 4 show the actual local exponents
 $\eta ^{D}_{loc}$ and
 $\eta ^{\nu }_{loc}$ at the fixed point defined as
 \begin{equation} \eta^{D}_{loc} = \frac{{\rm d}\ln \hat h_*^{D}(\hat p)}{{\rm d}\ln\hat p}\quad\eta^{\nu}_{loc} = \frac{{\rm d}\ln \hat h_*^{\nu}(\hat p)}{{\rm d}\ln\hat p}. \end{equation}
When a function  $f(x)$ behaves as a power law
 $f(x)\sim x^{\alpha }$ in some range, the local exponent defined by this logarithmic derivative identifies with
 $\alpha$ on this range. It is clear that
 $\eta ^{\nu }_{loc}$ differs from its expected K41 value
 $\eta ^{\nu }=4/3$, and similarly for
 $\eta ^{D}_{loc}$. The deviations are estimated numerically as
 $\delta \eta ^{\nu }\simeq \delta \eta ^{D}\simeq 0.33$.
Let us emphasise that it is a very unusual feature, which originates in the breaking of the decoupling property in the NS flow equations. Non-decoupling means that the loop contributions 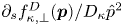 ${\partial _s f_{\kappa,\perp }^{D}(\boldsymbol {p})}/{D_\kappa \hat p^{2}}$ and
 ${\partial _s f_{\kappa,\perp }^{\nu }(\boldsymbol {p})}/{\nu _\kappa \kappa ^{2} \hat p^{2}}$ in the flow equations (6.16) do not become negligible in the limit of large wavenumbers compared with the linear terms. Intuitively, a large wavenumber is equivalent to a large mass, and degrees of freedom with a large mass are damped and do not contribute in the dynamics at large (non-microscopic) scale. This means that the IR (effective) properties are not affected by the UV (microscopic) details, and this pertains to the mechanism for universality. For turbulence, this is not the case, and the consequences of this breaking, intimately related to sweeping, will be further expounded in § 7. Within the simple LO approximation, the signature of this non-decoupling is that the exponent of the power laws at large
 $p$ are not fixed by the scaling dimensions
 $\eta _*^{\nu }$ and
 $\eta _*^{D}$, or in other words, the scaling behaviours in
 $\kappa$ and in
 $\boldsymbol {p}$ are different. Indeed, the scaling in
 $\kappa$ is fixed by (6.10), but
 $\eta _\kappa ^{D}$ and
 $\eta _\kappa ^{\nu }$ do not control the scaling behaviour in
 $\boldsymbol {p}$, given by (6.17a,b) which exhibit explicit deviations
 $\delta \eta ^{\nu }$ and
 $\delta \eta ^{D}$. This is in sharp contrast with what was observed for the Burgers–KPZ case in § 5, where decoupling was satisfied, and the behaviour in
 $\boldsymbol {p}$ and
 $\omega$, e.g. in the scaling form (5.16) is indeed controlled by
 $\eta _\kappa$. However, it turns out that this peculiar feature plays no role for equal-time quantities. As we show in the next section, the LO approximation leads to Kolmogorov scaling for the energy spectrum and the structure functions. Hence the deviations
 $\delta \eta ^{\nu }$ and
 $\delta \eta ^{D}$ are a priori not directly observable.
6.4. Kinetic energy spectrum
Let us now compute from this fixed point physical observables, starting with the kinetic energy spectrum. The mean total energy per unit mass is given by
 \begin{equation} \frac 1 2 \langle \boldsymbol{v}(t,\boldsymbol{x})^{2}\rangle = \frac 1 2 G_{\alpha\alpha}^{uu}(0,0) = \frac 1 2 \int \frac{d^{d} \boldsymbol{p}}{(2{\rm \pi})^{d}} \int \frac{{\rm d}\omega}{2{\rm \pi}} \bar G_{\alpha\alpha}^{uu}(\omega,\boldsymbol{p}) . \end{equation}
The kinetic energy spectrum, defined as the energy density at wavenumber  $p$, is hence given for an isotropic flow by
 \begin{equation} {\mathcal{E}}(p) = \frac 1 2 \frac{2{\rm \pi}^{d/2}}{(2{\rm \pi})^{d} \varGamma(d/2)} p^{d-1} (d-1) \int \frac{{\rm d}\omega}{2{\rm \pi}} \bar G_{{\perp}}^{uu}(\omega,p). \end{equation}
The statistical properties of the system are obtained once all fluctuations have been integrated over, i.e. in the limit  $\kappa \to 0$. Since the RG flow reaches a fixed point, the limit
 $\kappa \to 0$ simply amounts to evaluating at the fixed point. Within the LO approximation, and in
 $d=3$, one finds
 \begin{equation} {\mathcal{E}}(p) = \displaystyle\frac{\bar\epsilon^{2/3}}{\hat \gamma \kappa^{5/3}} \hat{E}(\hat p) ,\quad\text{with}\ \hat{E}(\hat p) = \frac{1}{2{\rm \pi}^{2}}\, \hat p^{2}\,\frac{\hat h_*^{D}(\hat{p})}{\hat h_*^{\nu}(\hat p)}. \end{equation}
The function  $\hat {E}(\hat p)$ is represented in figure 5, with in the inset the compensated spectrum
 $\hat {p}^{5/3}\hat {E}(\hat p)$. At small
 $\hat p$, it behaves as
 $\hat p^{2}$, which reflects equipartition of energy. At large
 $\hat p$, the two corrections
 $\delta \eta ^{\nu }$ and
 $\delta \eta ^{D}$ turn out to compensate in (6.21), such that one accurately recovers the Kolmogorov scaling
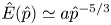 $\hat {E}(\hat p) \simeq a \hat p^{-5/3}$, with
 $a\simeq 0.106$ a numerical factor, which can be read off from the plateau value of the compensated spectrum
 $\hat {p}^{5/3}\hat {E}(\hat p)$ shown in the inset of figure 5. Thus one obtains for the spectrum
 \begin{equation} {\mathcal{E}}(p) = \frac{a}{\hat\gamma} \bar\epsilon^{2/3} p^{{-}5/3} \equiv C_K \bar\epsilon^{2/3}p^{{-}5/3} . \end{equation}
For the present choice of forcing profile, which is 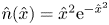 $\hat n(\hat x) = \hat x^{2} \textrm {e}^{-\hat x^{2}}$, one obtains from (6.12)
 $\hat \gamma = \tfrac {3}{8}{\rm \pi} ^{-3/2}$, and thus
 $C_K\simeq 1.572$. This value is in precise agreement with typical experimental values, as compiled e.g. by Sreenivasan (Reference Sreenivasan1995), which yields
 $C_K\simeq 1.52\pm 0.30$. Note that perturbative RG approaches yielded the estimate
 $C_K=1.617$ (Yakhot & Orszag Reference Yakhot and Orszag1986; Dannevik, Yakhot & Orszag Reference Dannevik, Yakhot and Orszag1987) although from an uncontrolled limit. Kraichnan had to resort to an improved DIA (direct interaction approximation) scheme, called Lagrangian history DIA, to obtain the correct K41 spectrum and an estimate of this constant
 $C_K=1.617$ (Kraichnan Reference Kraichnan1965).
(a) Kinetic energy spectrum (main plot) and compensated one (inset); (b) second-order structure function (main plot) and compensated one (inset); (c) third-order structure function (main plot) and compensated one (inset). All functions are calculated from the FRG fixed point obtained within the LO approximation in  $d=3$.
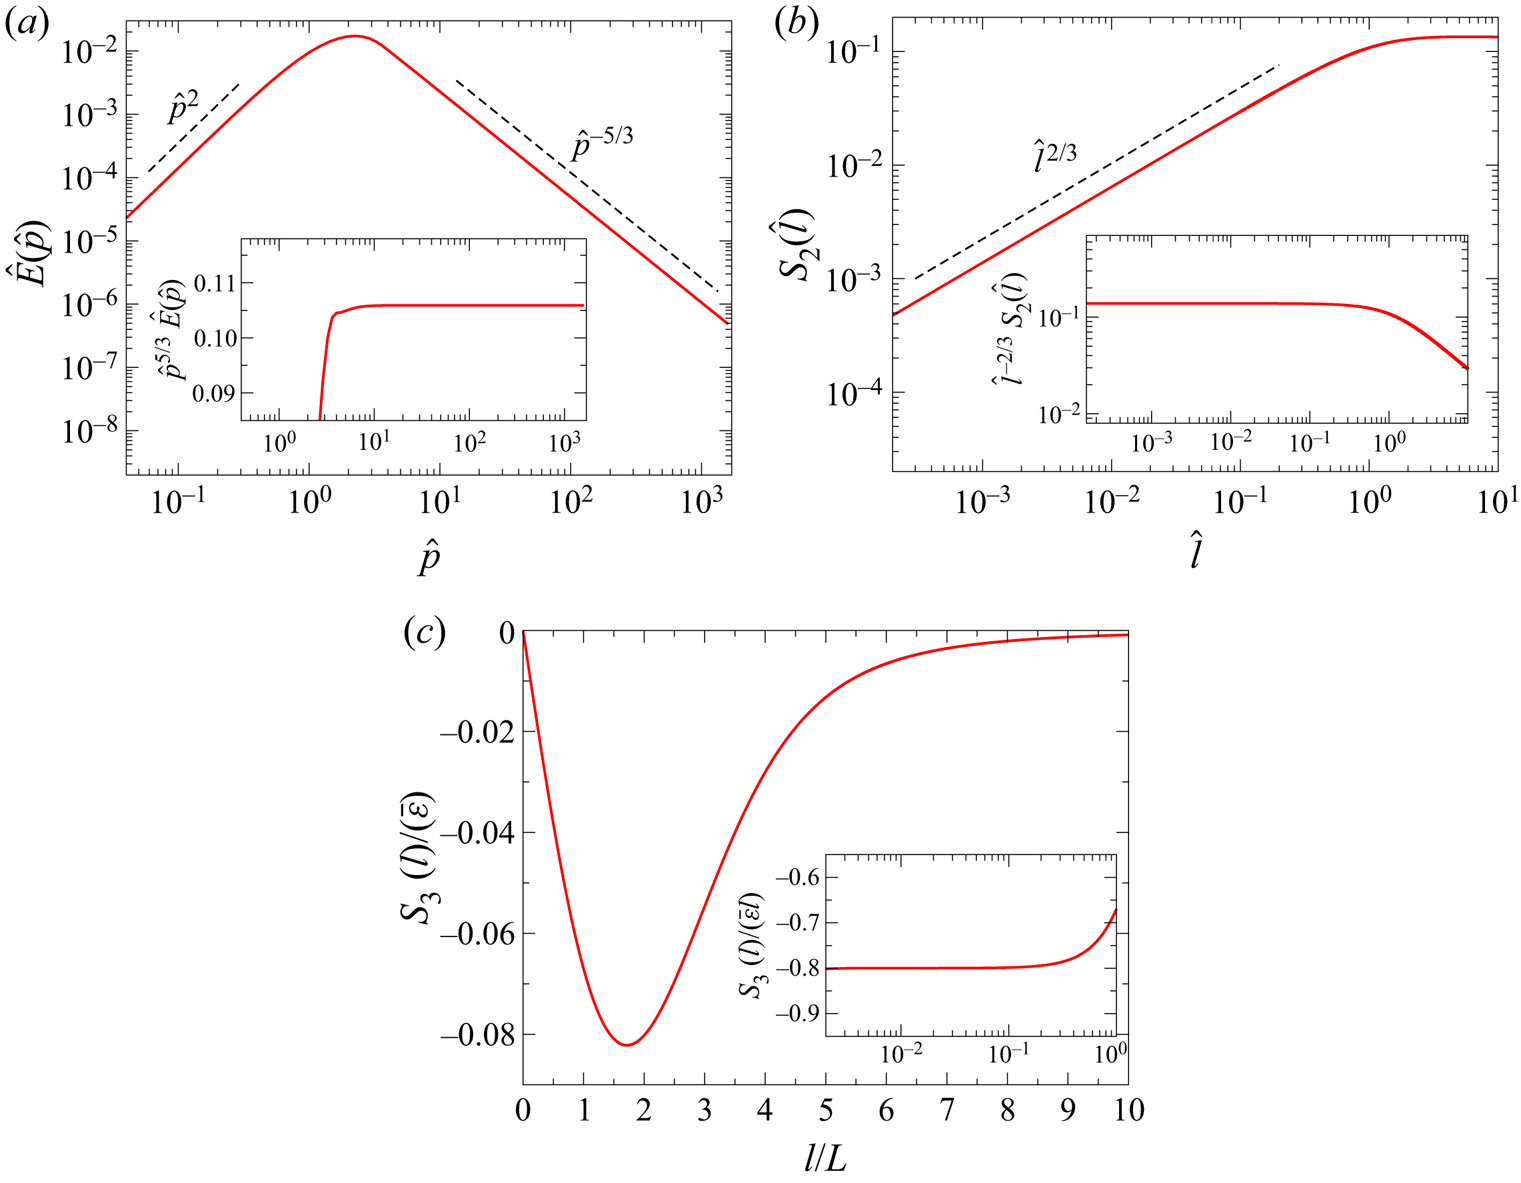
Let us emphasise that  $C_K$ explicitly depends on the forcing profile through
 $\hat \gamma$. It is thus a priori non-universal. However, it only depends on the integral of this profile, which is required to vanish at zero, be peaked around the integral scale and decay fast after. Thus one can expect that this integral is not very sensitive to the precise shape of the forcing satisfying these constraints. Indeed, it was shown in Tomassini (Reference Tomassini1997) within an approximation similar to LO that the numerical value of
 $C_K$ varies very mildly, in the range 1.2–1.8, upon changing the forcing profile.
6.5. Second- and third-order structure functions
The  $n$th-order structure function is defined as
 \begin{equation}
{\mathcal{S}}_n(\ell) = \langle [(\boldsymbol{v}(t,\boldsymbol{z}
+\boldsymbol{\ell}) -\boldsymbol{v} (t,\boldsymbol{z}))\boldsymbol{\cdot}
\hat{\boldsymbol{\ell}}]^{n}\rangle ,
\end{equation}
where  $\hat{\boldsymbol{\ell}} = {\boldsymbol{\ell}}/\ell$. The second-order structure function can thus be calculated as
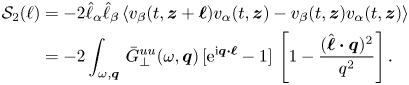 \begin{align}
{\mathcal{S}}_2(\ell)&={-}2 \hat\ell_\alpha \hat\ell_\beta
\left\langle
{{v}}_\beta(t,\boldsymbol{z}+\boldsymbol{\ell})
{{v}}_\alpha (t,\boldsymbol{z}) -
{{v}}_\beta(t,\boldsymbol{z}) {{v}}_\alpha
(t,\boldsymbol{z})\right\rangle\nonumber\\ &={-}2
\displaystyle \int_{\omega,\boldsymbol{q}} \, \bar G^{u
u}_\perp(\omega,\boldsymbol{q})\, [{\rm e}^{{\rm i}
\boldsymbol{q}\boldsymbol{\cdot} \boldsymbol{\ell}}
-1]\,\left[1-\frac{(\hat{\boldsymbol{\ell}}\boldsymbol{\cdot}
\boldsymbol{q})^{2}}{q^{2}} \right].
\end{align}
Within the LO approximation and in  $d=3$, one obtains
 \begin{equation} {\mathcal{S}}_2(\ell) = \frac{\bar\epsilon^{2/3}}{\hat\gamma} \kappa^{{-}2/3} {\hat S}_2(\hat\ell)\quad \text{with}\ {\hat S}_2(\hat\ell) ={-}\frac{1}{2{\rm \pi}^{2}}\int_0^{\infty} \,{\rm d}\hat q \,\hat q^{2} \, \frac{\hat h_*^{D}(\hat q)}{\hat h_*^{\nu}(\hat q)} I_2(\hat q\hat \ell), \end{equation}
and  $I_2$ given by the integral
 \begin{equation} I_2(x) = \displaystyle \frac{4}{x^{3}}\left[\sin x -x \cos x -\frac{x^{3}}{3}\right] . \end{equation}
The function  ${\hat S}_2(\hat \ell )$ is plotted in figure 5. Again, for small
 $\hat \ell$, the corrections
 $\delta \eta ^{\nu }$ and
 $\delta \eta ^{D}$ precisely compensate such that the second-order structure function behaves as the power law
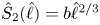 ${\hat S}_2(\hat \ell )=b\hat \ell ^{2/3}$ with the Kolmogorov exponent 2/3 and
 $b\simeq 0.139$ (plateau value of the compensated
 $S_2$). Thus one obtains
 \begin{equation} {\mathcal{S}}_2(\ell) = \bar\epsilon^{2/3} \frac{b}{\hat\gamma} \ell^{2/3}\,\equiv C_2 \bar\epsilon^{2/3} \ell^{2/3} , \end{equation}
with  $C_2\simeq 2.06$, well within the error bars of the experimental values
 $C_2\simeq 2.0 \pm 0.4$ (Sreenivasan Reference Sreenivasan1995).
Of course, the two constants  $C_2$ and
 $C_K$ are not independent. Using the expression
 $({1}/{2{\rm \pi} ^{2}})\hat q^{2}({\hat h_*^{D}(\hat q)}/{\hat h_*^{\nu }(\hat q) })= ({a}/{\hat \gamma }) \hat q^{-5/3}$ deduced from (6.21) in (6.25), one obtains
 \begin{equation} C_2 ={-}\displaystyle \frac{a}{\hat\gamma} \int_0^{\infty} x^{{-}5/3}\,I_2(x)\, {{\rm d}\kern0.7pt x} = \frac{27}{55}\varGamma(1/3)C_K , \end{equation}
where  $a/\hat \gamma =C_K$ was used according to (6.22). One thus recovers the well-known relation between these two constants (Monin & Yaglom Reference Monin and Yaglom2007).
Finally, let us compute the third-order structure function. In fact, as we now show, this function is completely fixed in the inertial range by the space–time-dependent shift symmetry of the response fields presented in § 3.4 (or equivalently by the Kármán–Howarth relation) (Tarpin Reference Tarpin2018). Thus one recovers the exact result for  $S_3$ for any approximation of the form (6.1) which automatically preserves the symmetries, and this is the case for the LO approximation.
The third-order structure function can be expressed, using translational invariance and incompressibility, as (Tarpin Reference Tarpin2018)
 \begin{align} S_3(\ell) &= 6\hat \ell_\alpha \hat\ell_\beta\hat\ell_\gamma\left\langle {{v}}_\alpha(t,0){{v}}_\beta(t,0){{v}}_\gamma(t,\ell) \right\rangle\nonumber\\ & = 6 \hat \ell_\alpha \hat\ell_\beta\hat\ell_\gamma \int_{\omega,\boldsymbol{q}} \left[q^{2} (\delta_{\beta\gamma}q_\alpha + \delta_{\alpha\gamma}q_\beta) -2 q_\alpha q_\beta q_\delta \right]\frac{\bar K(\omega,\boldsymbol{q})}{{\rm i} q^{4}} {\rm e}^{{\rm i} (\boldsymbol{q}\boldsymbol{\cdot}\hat\ell)}\nonumber\\ &= \frac{6}{(2{\rm \pi})^{2}} \int_0^{\infty} dq q I_3(q\ell) \int_{-\infty}^{\infty}\frac{{\rm d}\omega}{2{\rm \pi}} \bar K(\omega,\boldsymbol{q}) , \end{align}
where  $I_3$ is given by the integral
 \begin{equation} I_3(x) = \displaystyle -\frac{8}{x^{4}}[(x^{3}-3)\sin x +3 x \cos x] . \end{equation}
The function  $\bar K$ is related to the scalar part of the correlation function
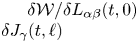 ${\delta {\mathcal {W}}}/\delta L_{\alpha \beta }(t,0)\delta J_\gamma (t,\ell)$, which can be expressed in terms of the two-point functions. Indeed, taking one functional derivative of the Ward identity (3.39) with respect to
 $J_\gamma$, and evaluating at zero sources, one obtains in Fourier space
 \begin{equation} \bar K(\omega,\boldsymbol{q}) = ({\rm i}\omega -\nu q^{2}) \bar G^{u u}_\perp(\omega,\boldsymbol{q})+ 2 D_L\hat n(L \boldsymbol{q})\bar G^{u \bar u}_\perp(-\omega,\boldsymbol{q}), \end{equation}
where  $D_L$ is the forcing amplitude at the integral scale, related to the mean energy injection as
 $\bar \epsilon = D_L L^{-3} \hat \gamma$ according to (6.11). The first contribution to
 $S_3$, proportional to
 $\bar G^{u u}_\perp$, can be evaluated within the LO approximation. One obtains that it behaves at small
 $\ell$ as
 $(\ell /\eta )^{-1/3}$, which implies that it is negligible in the inertial range. In this range,
 $S_3$ is hence dominated by the second contribution, proportional to
 $\bar G^{u \bar u}_\perp$, which writes
 \begin{equation} S_3(\ell) ={-}\frac{6}{(2{\rm \pi})^{2}} \frac{\bar\epsilon}{\hat\gamma} L \int_0^{\infty} \,{{\rm d} y} \, y\, I_3\left(y\frac{\ell}{L}\right) \hat{n}(y). \end{equation}
The result is represented in figure 5, for the choice 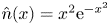 $\hat n(x) = x^{2} \textrm {e}^{-x^{2}}$. One observes that the 4/5th law is recovered for small scales in the inertial range. This result can also be demonstrated analytically from (6.32) since in the inertial range,
 $I_3$ is dominated by the small values of its argument, and
 $I_3(x) \sim \tfrac {8}{15}x$ for
 $x\to 0$. The remaining integral on
 $y$ can then be identified with
 $\hat \gamma$ defined in (6.12), which yields
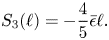 \begin{equation} S_3(\ell) ={-}\frac{4}{5}\bar \epsilon \ell. \end{equation}
It is clear from this derivation that  $C_3=-4/5$ is a universal constant, contrarily to
 $C_2$ or
 $C_K$. It has no dependence left on
 $\hat \gamma$.
To conclude this section, the merits of this approach, based on the LO approximation, are to unambiguously establish the existence of the fixed point with K41 scaling associated with fully developed turbulence generated by a realistic large-scale forcing. This has been out of reach of standard perturbative RG approaches. The approximation used here, in the form of the LO ansatz (6.5), is rather simple, since it completely neglects the frequency dependence of the two-point functions, as well as any renormalisation of the vertices. While it is sufficient to recover the exact result for  $S_3$, the K41 energy spectrum with a reliable estimate of the Kolmogorov constant, it does not yield an anomalous exponent for
 $S_2$. Hence, both the frequency and field dependences are bound to be important to capture possible intermittency corrections to K41 exponents. However, more refined approximations including these aspects (such as the SOA one implemented for Burgers–KPZ) have not been studied yet, and remain a promising but challenging route to explore in the quest of the computation of intermittency effects from first principles.
In fact, let us emphasise that this program has been recently started in the context of shell models of turbulence, which offer a much simpler setting, yet exhibiting intermittency. For these models, the FRG approach provided for the first time evidence of the associated fixed point, with intermittency corrections to  $\zeta _2$ in very good agreement with values from numerical simulations (Fontaine et al. Reference Fontaine, Tarpin, Bouchet and Canet2022).
7. Space–time correlations from FRG
This section stresses the second main achievement stemming from FRG methods in turbulence, which is the general expression for the space–time dependence of any correlation function (for any number of points  $n$) of the velocity field in the turbulent stationary state in the limit of large wavenumbers. This expression can be extended to other fields (pressure field, response fields), as well as to correlations of passive scalars transported by a turbulent flow (see § 9). Contrary to the results presented in §§ 5 and 6, this result is not based on an ansatz, it is exact in the limit of infinite wavenumbers.
In the following, we start with a brief overview of what is known on spatio-temporal correlations in turbulence in § 7.1. The principle of the derivation of the FRG results are reviewed in §§ 7.2 and 7.3, before providing a simple heuristic explanation of the large-time regime in § 7.4. Thorough comparisons with Direct Numerical Simulations (DNS) are reported in §§ 8 and 9.
7.1. Overview of space–time correlations in turbulence
One of the earliest insights on the temporal behaviour of correlations was provided by Taylor's celebrated analysis of single particle dispersion in an isotropic turbulent flow (Taylor Reference Taylor1922). The typical time scale for energy transfers in the turbulent energy cascade can be determined based on Kolmogorov original similarity hypothesis. Assuming a constant energy flux throughout the scales forming the inertial range, one deduces from dimensional analysis that the time for energy transfer from an eddy of size  $k^{-1}$ to smaller eddies scales as
 $\tau \sim (\bar \epsilon )^{-1/3}k^{-2/3}$, which corresponds to the local eddy turnover time. This scaling is associated with straining, and leads in particular to a frequency spectrum
 $E(\omega )\sim \omega ^{-2}$. However, another mechanism, referred to as sweeping, was identified by Heisenberg (Reference Heisenberg1948) and consists in the passive advection of small-scale eddies, without distortion, by the random large-scale eddies, even in the absence of mean flow. This effect introduces a new scale, the root-mean-square velocity
 $U_{rms}$, related to the large-scale motion, in the dimensional analysis and yields a typical time scale for sweeping
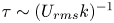 $\tau \sim (U_{rms} k)^{-1}$. It then follows that the frequency energy spectrum should scale as
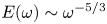 $E(\omega )\sim \omega ^{-5/3}$. The question arises as to which of the two mechanisms dominate the Eulerian correlations, and phenomenological arguments (Tennekes Reference Tennekes1975) suggest that it is the latter, which means that the small-scale eddies are swept faster than they are distorted by the turbulent energy cascade. This conclusion has been largely confirmed by numerical simulations (Orszag & Patterson Reference Orszag and Patterson1972; Gotoh et al. Reference Gotoh, Rogallo, Herring and Kraichnan1993; Kaneda, Ishihara & Gotoh Reference Kaneda, Ishihara and Gotoh1999; He, Wang & Lele Reference He, Wang and Lele2004; Favier, Godeferd & Cambon Reference Favier, Godeferd and Cambon2010). In particular, the
 $\omega ^{-5/3}$ frequency spectrum is observed in the Eulerian framework, whereas the
 $\omega ^{-2}$ spectrum emerges in the Lagrangian framework, which is devoid of sweeping (Chevillard et al. Reference Chevillard, Roux, Lévêque, Mordant, Pinton and Arnéodo2005; Lévêque et al. Reference Lévêque, Chevillard, Pinton, Roux, Arnéodo and Mordant2007).
Several theoretical attempts were made to calculate the effect of sweeping on the Eulerian spatio-temporal correlations. Kraichnan obtained from a simple model of random advection that the two-point velocity correlations should behave as a Gaussian in the variable  $kt$, where
 $k$ is the wavenumber and
 $t$ the time delay (Kraichnan Reference Kraichnan1964). In a nutshell, assuming that the velocity field can be decomposed into a large-scale slowly varying component
 $\boldsymbol {U}$ and a small-scale fluctuating one
 $\boldsymbol {u}$ as
 $\boldsymbol {v}\simeq \boldsymbol {U} + \boldsymbol {u}$ with
 $|\boldsymbol {u}|\ll |\boldsymbol {U}|$, and assuming that the two components are statistically independent, one arrives at the simplified advection equation
 $\partial _t \boldsymbol {u} + \boldsymbol {U}\boldsymbol {{\cdot }} \boldsymbol {\nabla } \boldsymbol {u} =0$, for scales in the inertial range, i.e. neglecting forcing and dissipation. This linear equation can be solved in Fourier space and one obtains
 $\langle \boldsymbol {u}(t,\boldsymbol {k})\boldsymbol {{\cdot }} \boldsymbol {u}(0,-\boldsymbol {k})\rangle \propto \exp (-\tfrac 1 2 U^{2} k^{2} t^{2})$, which is the anticipated Gaussian, and corroborates the sweeping time scale
 $\tau \sim (U k)^{-1}$. However, the previous assumptions cannot be justified for the full NS equation, so it is not clear a priori whether this should be relevant for real turbulent flows.
Correlation functions were later analysed using Taylor expansion in time in Kaneda (Reference Kaneda1993) and Kaneda et al. (Reference Kaneda, Ishihara and Gotoh1999), which yields results compatible with the sweeping time scale  $k^{-1}$ for two-point Eulerian correlations, and the straining time scale
 $k^{-2/3}$ for Lagrangian ones. The random sweeping hypothesis has been used in several approaches, such as the modelling of space–time correlations within the elliptic model (He & Zhang Reference He and Zhang2006; Zhao & He Reference Zhao and He2009) or in models of wavenumber–frequency spectra (Wilczek & Narita Reference Wilczek and Narita2012). Beyond phenomenological arguments, more recently, band-pass filtering techniques were applied to the NS equation, and confirmed the dominant contribution of sweeping in the Eulerian correlations (Drivas et al. Reference Drivas, Johnson, Lalescu and Wilczek2017). Very few works were dedicated to the study of multi-point multi-time correlation functions, and only within the quasi-Lagrangian framework (L'vov et al. Reference L'vov, Podivilov and Procaccia1997; Biferale, Calzavarini & Toschi Reference Biferale, Calzavarini and Toschi2011) or within the multifractal approach (Biferale et al. Reference Biferale, Boffetta, Celani and Toschi1999). We refer to Wallace (Reference Wallace2014) for a general review on space–time correlations in turbulence.
A closely related problem is the nature of space–time correlations of passive scalar fields transported by a turbulent flow. The scalar field can represent temperature or moisture fluctuations, pollutant or virus concentrations, etc $\ldots$, which are transported by a turbulent flow. The scalar is termed passive when it does not affect the carrier flow. This absence of back reaction is of course an approximation which only holds at small enough concentration and particle size. Understanding the statistical properties of scalar turbulence plays a crucial role in many domains ranging from natural processes to engineering (see e.g. Shraiman & Siggia Reference Shraiman and Siggia2000; Falkovich, Gaweȩdzki & Vergassola Reference Falkovich, Gaweȩdzki and Vergassola2001; Sreenivasan Reference Sreenivasan2019 for reviews). The modelling of the scalar spatio-temporal correlations lies at the basis of many approaches in turbulence diffusion problems (Mazzino Reference Mazzino1997). Regarding the relevant time scales, the effect of sweeping for the scalar field was early discussed in Chen & Kraichnan (Reference Chen and Kraichnan1989), and its importance was later confirmed in several numerical simulations (Yeung & Sawford Reference Yeung and Sawford2002; O'Gorman & Pullin Reference O'Gorman and Pullin2004) and also experiments of Rayleigh–Bénard convection (He & Tong Reference He and Tong2011).
Of course, one of the major difficulties, which has hindered decisive progress, arises from the nonlinear and non-local nature of the hydrodynamical equations. In terms of correlation functions, it implies that the equation for a given  $n$-point correlation function – i.e. the correlation of
 $n$ fields evaluated at
 $n$ different space–time points – depends on higher-order correlations, and one faces the salient closure problem of turbulence. In order to close this hierarchy, one has to devise some approximation, and many different schemes have been proposed, such as, to mention a few, the DIA elaborated by Kraichnan (Reference Kraichnan1964), approaches based on quasi-normal hypothesis, in particular the eddy damped quasi-normal Markovian model (Lesieur Reference Lesieur2008), or the local energy transfer theory (McComb & Yoffe Reference McComb and Yoffe2017), we refer to Zhou (Reference Zhou2021) for a recent review. In this context, field-theoretical and RG approaches offer a systematic framework to study correlation functions, allowing one in principle to devise controlled approximation schemes. Although this program has been largely impeded within the standard perturbative RG framework (see § 2), it turned out to be fruitful within the FRG.
Indeed, the FRG was shown to provide for homogeneous isotropic turbulence the suitable framework to achieve a controlled closure for any  $n$-point Eulerian correlation function, which becomes asymptotically exact in the limit of large wavenumbers. This closure allows one to establish the explicit analytical expression of the spatio-temporal dependence of any generic
 $n$-point correlation function in this limit. The main merit of this result is to demonstrate on a rigorous basis, from the NS equations, that the sweeping mechanism indeed dominates Eulerian correlations, and moreover to provide its exact form at large wavenumbers. Thereby, the phenomenological evidence for sweeping is endowed with a very general and systematic expression, extended to any
 $n$-point correlation functions. Remarkably, the expression obtained from FRG also carries more information, and predicts in particular a change of behaviour of the Eulerian correlations at large time delays. In this regime, another time scale emerges, which scales as
 $\tau \sim D^{-1}{k^{-2}}$, where
 $D=U_{rms}^{2} \tau _L$ is a turbulent diffusivity with
 $\tau _L$ the eddy turnover time at the integral scale. The time scale
 $\tau$ can therefore be called a diffusive time scale. The temporal decay of the correlations hence exhibit a cross-over from a fast Gaussian decrease at small time delays to a slower exponential one at large time delays. All these results are largely explained and illustrated throughout this section.
7.2. Closure in the large wavenumber limit of the FRG flow equations
The derivation is based on the large wavenumber expansion, which is inspired by the BMW approximation scheme described in § 4.3. Its unique feature for turbulence is that the flow equation for any correlation function can be closed without further approximation than taking the  $p_i\to \infty$ limit, and becomes exact in this limit.
The starting point is the exact flow equation (4.5) for the generating functional  ${\mathcal {W}}_\kappa$. An
 $n$-point correlation function
 ${\mathcal {W}}_\kappa ^{(n)}$ is defined according to (3.13) as the
 $n$th functional derivative of
 ${\mathcal {W}}_\kappa$ with respect to the corresponding sources
 ${\mathcal {J}}_1,\ldots,{\mathcal {J}}_n$. The flow equation for
 ${\mathcal {W}}_\kappa ^{(n)}$ is thus obtained by taking
 $n$ functional derivatives of (4.5), which yields
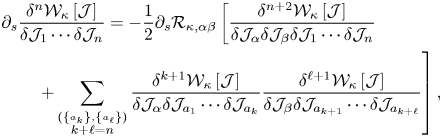 \begin{align} &\partial_{s}\frac{\delta^{n}{\mathcal{W}}_{\kappa}\left[{\mathcal{J}}\right]}{\delta {\mathcal{J}}_{1}\cdots\delta {\mathcal{J}}_{n}} ={-}\frac{1}{2}\partial_{s}{\mathcal{R}}_{\kappa,\alpha\beta}\left[\frac{\delta^{n+2}{\mathcal{W}}_{\kappa}\left[{\mathcal{J}}\right]}{\delta {\mathcal{J}}_{\alpha}\delta {\mathcal{J}}_{\beta}\delta {\mathcal{J}}_{1}\cdots\delta {\mathcal{J}}_{n}} \right.\nonumber\\ &\left.\qquad +\sum_{\stackrel{\left(\left\{ a_{k}\right\} ,\left\{ a_{\ell}\right\} \right)}{k+\ell=n}}\frac{\delta^{k+1}{\mathcal{W}}_{\kappa}\left[{\mathcal{J}}\right]}{\delta {\mathcal{J}}_{\alpha}\delta {\mathcal{J}}_{a_{1}}\cdots\delta {\mathcal{J}}_{a_{k}}}\frac{\delta^{\ell+1}{\mathcal{W}}_{\kappa}\left[{\mathcal{J}}\right]}{\delta {\mathcal{J}}_{\beta}\delta {\mathcal{J}}_{a_{k+1}}\cdots\delta {\mathcal{J}}_{a_{k+\ell}}}\right], \end{align}
where  $(\{ a_{k}\} ,\{ a_{\ell }\} )$ indicates all possible bipartitions of the indices
 $1,\ldots,n$. This equation can be represented diagrammatically as in figure 6, where the cross stands for
 $\partial _s {\mathcal {R}}_\kappa$. It is clear that, in the second diagram, the internal line carries a partial sum of external wavevectors
 $\sum _{i=1}^{k+1} \boldsymbol {p}_i$, which enters the derivative of the regulator. If one considers the large wavenumber limit, defined as the limit where all external wavevectors and all their partial sums are large with respect to the RG scale
 $\kappa$, then this diagram is exponentially suppressed, and can be neglected in this limit.
Diagrammatic representation of the flow of an arbitrary  $n$-point generalised correlation function
 ${\mathcal {W}}_\kappa ^{(n)}$ (7.1). The crosses represent the derivative of the regulator
 $\partial _\kappa {\mathcal {R}}_\kappa$ and the lines the propagator
 $\bar G_\kappa$. The correlations
 ${\mathcal {W}}_\kappa ^{(n)}$ are represented with hatched disks not to be confused with the vertices
 $\varGamma ^{(n)}_\kappa$. The first diagram involves a loop, along which the internal indices are summed over and the internal wavevector
 $\boldsymbol {q}$ and frequency
 $\omega$ are integrated over.
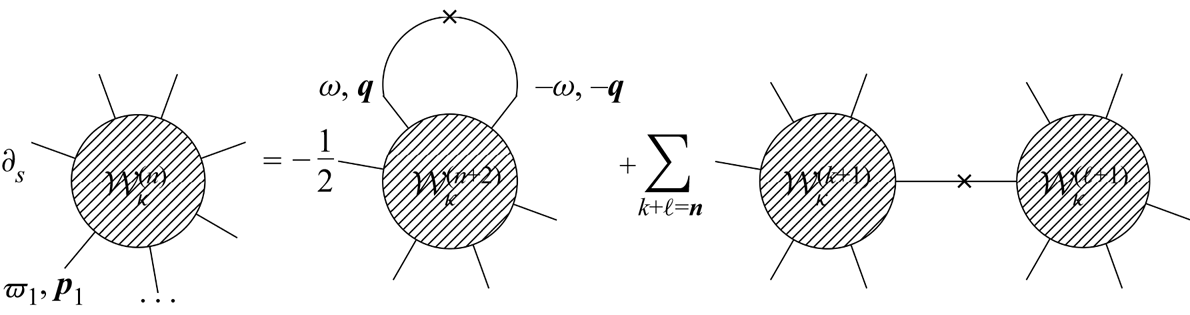
Let us now consider the first diagram. This diagram involves a loop where the internal wavevector  $\boldsymbol {q}$ circulates and is integrated over. Because of the presence of the derivative of the regulator (the cross),
 $\boldsymbol {q}$ is effectively cut to values
 $|\boldsymbol {q}|\lesssim \kappa$, and as explained in § 4.3, the limit of large wavenumbers is equivalent in the loop to the limit
 $\boldsymbol {q}\to 0$, which we now compute. The wavevector
 $\boldsymbol {q}$ enters two of the legs of
 ${\mathcal {W}}_\kappa ^{(n+2)}$. The idea is to apply the
 $\boldsymbol {q}\to 0$ expansion on these two legs. Technically, within the FRG framework, approximations are justified and performed on the
 $\varGamma ^{(n)}_\kappa$, not directly on the
 ${\mathcal {W}}_\kappa ^{(n)}$, because the flow equation of the formers ensures that they remain analytic at any finite scale
 $\kappa$ in wavevectors and frequencies (both in the UV and in the IR) thanks to the presence of the regulator. In particular, they can be Taylor expanded. However, any
 ${\mathcal {W}}_\kappa ^{(n)}$ can be expressed in terms of the
 $\varGamma _\kappa ^{(n)}$, as a sum of tree diagrams whose vertices are the
 $\varGamma _\kappa ^{(k)}$,
 $k\leq n$, and the edges the propagators. Hence,
 ${\mathcal {W}}_\kappa ^{(n+2)}$ can be thought of, in its
 $\varGamma$ representation, as a functional of the average field
 $\varPsi$, leading to
 \begin{equation} \partial_{s}\frac{\delta^{n}{\mathcal{W}}_{\kappa}\left[{\mathcal{J}}\right]}{\delta {\mathcal{J}}_{1}\cdots\delta {\mathcal{J}}_{n}} ={-}\frac{1}{2} \partial_{s}{\mathcal{R}}_{\kappa,\alpha\beta} \frac{\delta\varPsi_{\gamma}}{\delta {\mathcal{J}}_{\alpha}} \frac{\delta\varPsi_{\delta}}{\delta {\mathcal{J}}_{\beta}} \frac{\delta^{2}}{\delta\varPsi_{\gamma}\delta\varPsi_{\delta}} \frac{\delta^{n}{\mathcal{W}}_{\kappa}\left[{\mathcal{J}}\right]}{\delta {\mathcal{J}}_{1}\cdots\delta {\mathcal{J}}_{n}}, \end{equation}
where  ${\delta \varPsi _{\gamma }}/{\delta {\mathcal {J}}_{\alpha }}={\mathcal {W}}^{(2)}_{\kappa,\gamma \alpha } \equiv G_{\kappa,\gamma \alpha }$ are simply propagators. The loop wavevector
 $\boldsymbol {q}$ then enters either a propagator
 $G_\kappa$ or a vertex
 $\varGamma _\kappa ^{(k)}$, which can be evaluated in the limit
 $\boldsymbol {q} \to 0$. At this stage, the symmetries, through the set of associated Ward identities for the
 $\varGamma _\kappa ^{(n)}$, play a crucial role. Indeed, the analysis of § 3.3 has established that any vertex
 $\varGamma _\kappa ^{(n)}$ with one wavevector set to zero can be expressed exactly in a very simple way: if the
 $\boldsymbol {q}=0$ is carried by a velocity field, then it is given in terms of lower-order vertices
 $\varGamma _\kappa ^{(n-1)}$ through the
 ${\mathcal {D}}_\alpha$ operator (3.31), or it vanishes if it is carried by any other fields. This has a stringent consequence, which is that only contributions where
 $\varPsi _\gamma$ and
 $\varPsi _\delta$ are velocity fields survive in (7.2), yielding
 \begin{align} \partial_{s}
{\mathcal{W}}^{(n
)}_{\kappa,\alpha_1\cdots\alpha_n}
={-}\frac{1}{2}\int_{\omega,\boldsymbol{q}}(\bar{G}_{u_{\gamma}u_{\alpha}}\partial_{s}{\mathcal{R}}_{\kappa,u_{\alpha}u_{\beta}}\bar{G}_{u_{\beta}u_{\delta}})\left(\omega,\boldsymbol{q}\right)
\frac{\delta}{\delta
u_{\gamma}\left(-\omega,-\boldsymbol{q}\right)}\frac{\delta}{\delta
u_{\delta}\left(\omega,\boldsymbol{q}\right)}{\mathcal{W}}^{\left(n
\right)}_{\kappa,\alpha_1\cdots\alpha_n} ,
\end{align}
where the  $\alpha _k$ indices denote both the nature of the fields and their space components. One can then prove, after some algebra, the following identity:
 \begin{align} &\left.\frac{\delta}{\delta u_{\gamma}\left(-\omega,-\boldsymbol{q}\right)}\frac{\delta}{\delta u_{\delta}\left(\omega,\boldsymbol{q}\right)}{\mathcal{W}}_{\kappa,\alpha_1\cdots\alpha_n}^{\left(n\right)}\left(\omega_{1},\boldsymbol{p}_{1},\ldots\right)\right|_{\boldsymbol{q}=0} \nonumber\\ &\qquad ={\mathcal{D}}_{\gamma}\left(-\omega\right){\mathcal{D}}_{\delta}\left(\omega\right){\mathcal{W}}_{\kappa,\alpha_1\cdots\alpha_n}^{\left(n\right)}\left(\omega_{1},\boldsymbol{p}_{1},\ldots\right). \end{align}
The proof relies on expressing the  ${\mathcal {W}}_{\kappa }^{(n)}$ in terms of the
 $\varGamma _\kappa ^{(n)}$ for which the wavenumber expansions are justified and then on using the Ward identities. We refer the interested reader to Tarpin et al. (Reference Tarpin, Canet and Wschebor2018) and Tarpin (Reference Tarpin2018) for the complete proof. One thus obtains the explicit flow equation
 \begin{align} &\partial_{s}{\mathcal{W}}_{\kappa,\alpha_1\cdots\alpha_n}^{(n)}\left(\cdots,\varpi_{i},\boldsymbol{p}_{i},\ldots\right) = \frac{1}{2}\int_{\omega, \boldsymbol{q}}\left(\bar{G}_{u_{\gamma}u_{\alpha}}\partial_{s}{\mathcal{R}}_{\kappa,u_{\alpha}u_{\beta}}\bar{G}_{u_{\beta}u_{\delta}}\right)\left(\omega,\boldsymbol{q}\right) \nonumber\\ &\qquad \sum_{k,\ell=1}^{n}\frac{p_{k}^{\gamma}p_{\ell}^{\delta}}{\omega^{2}}{\mathcal{W}}_{\kappa,\alpha_1\cdots\alpha_n}^{\left(n\right)}\left(\cdots,\varpi_{k}+\omega,\boldsymbol{p}_{k},\ldots,\varpi_{\ell}-\omega,\boldsymbol{p}_{\ell},\ldots\right) + {{O}}(p_{max}), \end{align}
which constitutes one of the most important results obtained with FRG methods. The flow equation for an arbitrary  $n$-point connected correlation function
 ${\mathcal {W}}_{\kappa }^{(n)}$ (of any fields, velocity, pressure, response fields, …) is closed in the large wavenumber limit, in the sense that it no longer involves higher-order vertices. Remarkably, it does not depend on the whole hierarchy of
 ${\mathcal {W}}_{\kappa }^{(m)}$ with
 $m\leq n$, but only on the
 $n$-point function for which the flow is expressed and on propagators (i.e. two-point functions). Moreover, it is a linear equation in
 ${\mathcal {W}}_{\kappa }^{(n)}$. Once the two-point functions are determined (within some approximation scheme), any
 $n$-point correlations can be simply obtained. The term on the right-hand side is calculated exactly, i.e. it is the exact leading term in the large wavenumber expansion. Subleading corrections are at most of order
 $p_{max}$ where
 $p_{max}$ indicates the largest external wavevector at which the function is evaluated.
This equation can be further simplified, by noting that  ${\mathcal {W}}_{\kappa }^{(n)}$ on the right-hand side does not enter the integral over
 $\boldsymbol {q}$, but only the integral over the internal frequency
 $\omega$. Moreover,
 ${\mathcal {W}}_{\kappa }^{(n)}$ depends on the latter only through local shifts of the external frequencies. Hence, let us denote by
 $H_{\kappa,\gamma \delta }$ the term containing the propagators and the regulator
 \begin{equation} H_{\kappa,\gamma\delta}(\omega,\boldsymbol{q}) = \left(\bar{G}_{u_{\gamma}u_{\alpha}}\partial_{s}{\mathcal{R}}_{\kappa,u_{\alpha}u_{\beta}}\bar{G}_{u_{\beta}u_{\delta}}\right)\left(\omega,\boldsymbol{q}\right) . \end{equation}
On can show that because of incompressibility, the propagators are transverse, hence  $H_{\kappa,\gamma \delta }(\omega,\boldsymbol {q})=P^{\perp }_{\gamma \delta }(\boldsymbol {q}) H_{\kappa,\perp }(\omega,\boldsymbol {q})$. Finally, by Fourier transforming back in time variables, the shifts in frequency can be transferred to the Fourier exponentials, such that the function
 ${\mathcal {W}}_{\kappa }^{(n)}$ in the mixed time–wavevector coordinates
 $(t_i,\boldsymbol {p}_i)$ can be pulled out of the frequency integral also, yielding
 \begin{align} & \partial_{s}{\mathcal{W}}_{\kappa,\alpha_1\cdots\alpha_n}^{(n)} \left(\cdots,t_{i},\boldsymbol{p}_{i},\ldots\right) =\frac{d-1}{2d}{\mathcal{W}}_{\kappa,\alpha_1\cdots\alpha_n}^{(n)}\left(\cdots,t_{i},\boldsymbol{p}_{i},\ldots\right) \nonumber\\ &\qquad \times \sum_{k,\ell=1}^{n}{\boldsymbol{p}_{k}{\cdot} \boldsymbol{p}_{\ell}} \int_{\omega, \boldsymbol{q}} H_{\kappa,\perp}(\omega,\boldsymbol{q}) \frac{{\rm e}^{{\rm i}\omega(t_k-t_\ell)}-{\rm e}^{{\rm i}\omega t_k} - {\rm e}^{-{\rm i}\omega t_\ell}+1}{\omega^{2}} \quad+\quad{{O}}(p_{max}). \end{align}
Thus, one is left with a linear ordinary differential equation, which can be solved explicitly, as detailed in § 7.3. Again, the detailed proof of this expression can be found in Tarpin et al. (Reference Tarpin, Canet and Wschebor2018) and Tarpin (Reference Tarpin2018). We discuss in Appendix C the next-to-leading order in the large wavenumber expansion, which has been computed for 2-D turbulence in Tarpin et al. (Reference Tarpin, Canet, Pagani and Wschebor2019).
7.3. General expression of the time dependence of multi-point correlation functions
Let us now discuss the form of the general solution of the flow equation (7.7) for a generalised correlation function  ${\mathcal {W}}_\kappa ^{(n)}$. As emphasised in § 7.2, (7.7) is very special in many respects: (i) it is closed as it depends only on
 ${\mathcal {W}}_\kappa ^{(n)}$ (besides the propagators) and not on higher-order correlation functions, (ii) it is linear in
 ${\mathcal {W}}_\kappa ^{(n)}$, (iii) the leading order in the large
 $p$ expansion is exact and (iv) it does not decouple, which implies that the large wavenumber limit contains non-trivial information. This information is related to the breaking of standard scale invariance, and reflects the fact that the small-scale properties of turbulence are affected by the large scales.
We have shown in § 6 that the FRG flow for NS equation, in some reasonable approximation, with a physical large-scale forcing, reaches a fixed point. This means that the flow essentially stops when  $\kappa$ crosses the integral scale
 $L^{-1}$. However, because of the non-decoupling, the large scale remains imprinted in the solution. It is instructive to uncover the underlying mechanism. At a fixed point of a RG flow, the system does not depend any longer on the RG scale
 $\kappa$ by definition, which leads to scale invariance. The usual way to evidence such a behaviour is to introduce as in § 6 non-dimensionalised quantities, denoted with a hat symbol. Wavevectors are measured in units of
 $\kappa$, e.g.
 $\hat {\boldsymbol {p}} = \boldsymbol {p}/\kappa$, frequencies in units of
 $\nu _\kappa \kappa ^{2}$, e.g.
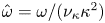 $\hat {\omega }=\omega /(\nu _\kappa \kappa ^{2})$. Denoting generically
 $d_n$ the scaling dimension of a given correlation function
 ${\mathcal {W}}^{(n)}_{\kappa }$, one also defines
 $\hat {{\mathcal {W}}}^{(n)}_{\kappa,\alpha _1\cdots \alpha _n}(\cdots,\hat {t}_i,\hat {\boldsymbol {p}}_i,\ldots ) = ({{\mathcal {W}}^{(n)}_{\kappa,\alpha _1\cdots \alpha _n}}/{\kappa ^{d_n}})(\cdots,\nu _\kappa \kappa ^{2} t_i,\boldsymbol {p}_i/\kappa,\ldots )$. For a generalised correlation function of
 $m$ velocity fields and
 $\bar {m}$ response fields with
 $m+\bar {m}=n$ in mixed time–wavevector coordinates, one has
 $d_n = 3(m-1)+(m-{\bar {m}/3})$ in
 $d=3$. The flow equation for the dimensionless correlation function then writes
 \begin{equation} \left\{\partial_s -d_n - \hat{\boldsymbol{p}}_i \boldsymbol{\cdot} \partial_{\hat{\boldsymbol{p}}_i} + z \hat t_i \partial_{\hat t_i}\right\} \hat{{\mathcal{W}}}^{(n)}_{\kappa,\alpha_1\cdots\alpha_n}(\cdots,{\hat t_i,\hat{\boldsymbol{p}}_i}, \ldots) = \hat{{\mathcal{F}}}_{loop}(\cdots,{\hat t_i,\hat{\boldsymbol{p}}_i}, \ldots) , \end{equation}
where  $\hat {{\mathcal {F}}}_{loop}$ denotes the nonlinear part of the flow, corresponding to the contribution of the loop (7.7), expressed in dimensionless quantities.
Scale invariance, as encountered in usual critical phenomena (say at a second-order phase transition), emerges if two conditions are fulfilled: existence of a fixed point, and decoupling. Indeed, as shown in § 5 for the Burgers–KPZ equation, these two conditions yield that the two-point correlation function takes a scaling form (5.2) – which is the hallmark of scale invariance. This derivation can be generalised for any correlation function. Let us assume that the flow reaches a fixed point, which means  $\partial _s\hat {{\mathcal {W}}}^{(n)}_{\kappa }=0$ and that decoupling occurs, which means that the loop contribution of the flow is negligible in the limit of large wavenumber, i.e.
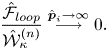 \begin{equation} \frac{\hat{{\mathcal{F}}}_{loop}}{\hat{{\mathcal{W}}}^{(n)}_{\kappa}} \stackrel{\hat{\boldsymbol{p}}_i\to\infty}{\longrightarrow} 0 . \end{equation}
One can easily show, using some elementary changes of variables, that the general form of the solution to the remaining homogeneous equation is a scaling form
 \begin{equation} \hat{{\mathcal{W}}}_{*,\alpha_1\cdots\alpha_n}^{(n)}(\cdots,{\hat t_i,\hat{\boldsymbol{p}}_i}, \ldots)= \frac{1}{\hat{p}_{tot}^{d_n}}\hat{w}_{\alpha_1\cdots\alpha_n}^{(n)}\left(\cdots,\hat{t}_i \hat{p}_i^{z},\frac{\hat{\boldsymbol{p}}_i}{\hat{p}_i},\ldots\right) , \end{equation}
where 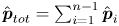 $\hat {\boldsymbol {p}}_{tot}=\sum _{i=1}^{n-1}\hat {\boldsymbol {p}}_i$ and
 $\hat {w}^{(n)}$ is a universal scaling function which form is not known, and could be determined by explicitly integrating the flow equation.
If there is no decoupling, i.e. if the condition (7.9) does not hold, the solution to (7.8) is no longer a scaling form, but is modified by the loop contribution. The explicit expression of this solution can be obtained as an integral expression, which can be simplified in two limits, the limits of small and large time delays, that we study separately in the following.
7.3.1. Small-time regime
The limit of small time delays corresponds to the limit where all  $\hat t_i \to 0$. In this limit, one can expand the exponential in the second line of (7.7)
 \begin{align} \int_{\omega, \boldsymbol{q}} H_{\kappa,\perp}(\omega,\boldsymbol{q}) \frac{{\rm e}^{{\rm i}\omega(t_k-t_\ell)}-{\rm e}^{{\rm i}\omega t_k} - {\rm e}^{-{\rm i}\omega t_\ell}+1}{\omega^{2}} \stackrel{t_i \to 0}{\simeq} I_\kappa t_k t_\ell\quad\text{with}\ I_\kappa \equiv \int_{\omega,\boldsymbol{q}} H_{\kappa,\perp}(\omega,\boldsymbol{q}) . \end{align}
Note that the explicit expression of  $H_\kappa$ is not needed in the following, one only demands that the frequency integral converges. The flow equation for the dimensionless
 $\hat {{\mathcal {W}}}^{(n)}_{\kappa }$ then simplifies to
 \begin{align} \left\{\partial_s -d_n - \hat{\boldsymbol{p}}_i \boldsymbol{\cdot} \partial_{\hat{\boldsymbol{p}}_i} + z \hat t_i \partial_{\hat t_i}\right\} \hat{{\mathcal{W}}}^{(n)}_{\kappa,\alpha_1\cdots\alpha_n}(\cdots,{\hat t_i,\hat{\boldsymbol{p}}_i}, \ldots) = \frac{\hat I_\kappa}{3}\big|\hat t_\ell \hat{\boldsymbol{p}}_\ell \big|^{2}\hat{{\mathcal{W}}}^{(n)}_{\kappa,\alpha_1\cdots\alpha_n}(\cdots,{\hat t_i,\hat{\boldsymbol{p}}_i}, \ldots). \end{align}
Since the flow reaches a fixed point, one can focus on the fixed-point equation as previously ( $\partial _s {\cdot } = 0$). At the fixed point,
 $\hat I_\kappa \to \hat I_*$ which is just a number. To solve the fixed-point equation, one can introduce a
 $(n-1)\times (n-1)$ rotation matrix
 ${\mathcal {R}}$ in wavevector space such that
 ${\mathcal {R}}_{i1} = {t_i}/{\sqrt {t_\ell t_\ell }}$ and define new variables
 $\boldsymbol {\rho }_k$ such that
 $\boldsymbol {p}_i={\mathcal {R}}_{ij} \boldsymbol {\rho }_j$. This transforms the sum
 $|t_\ell \boldsymbol {p}_\ell |^{2}$ into
 $t_\ell t_\ell |\boldsymbol {\rho }_1|^{2}$, and allows one to obtain the explicit solution, which reads in physical units (Tarpin et al. Reference Tarpin, Canet and Wschebor2018)
 $$\begin{gather} \log \left[\bar\epsilon^{({\bar{m}-m})/{3}}L^{{-}d_n}{\mathcal{W}}^{(m,\bar{m})}_{\alpha_1\ldots\alpha_{n}}({t_1,\boldsymbol{p}_1}, \ldots, {t_{n-1},\boldsymbol{p}_{n-1}})\right] ={-}\alpha_0\bar\epsilon^{2/3}L^{2/3} \, t_\ell t_\ell\, \rho_1^{2}\nonumber\\ - d_n \log (\rho_1 L) + {{w_0}^{(m,\bar{m})}}_{\alpha_1\ldots\alpha_{n}}\left(\rho_1^{2/3}\bar\epsilon^{1/3} t_1,\frac{\boldsymbol{\rho}_{1}}{\rho_1}, \ldots, \rho_1^{2/3}\bar\epsilon^{1/3}t_{n-1}, \frac{\boldsymbol{\rho}_{n-1}}{\rho_1}\right) + {{O}}(p_{max} L), \end{gather}$$
where  ${{w_0}^{(m,\bar {m})}}$ is a universal scaling function, which explicit form cannot be deduced from the fixed-point equation alone, but can be computed numerically by integrating the flow equation in some approximation. The constant
 $\alpha _0 = \hat \gamma \hat I_*/2$ is non-universal since it depends on the forcing profile through
 $\hat \gamma$, but it does not depend on the order
 $n$ of the correlation, nor on the specific fields involved (velocity, response velocity). It is thus the same number for all correlation functions of a given flow.
All the terms in the second line of (7.13) correspond to the K41 scaling form obtained in (7.10). However, these terms are subdominant, that is, they are of the same order as the indicated neglected terms  ${{O}}(p_{max} L)$ in the flow equation. Hence, they should be consistently discarded (included in
 ${{O}}(p_{max} L)$), and were kept here only for the sake of the discussion. As they are of the same order as the neglected terms, it means that they could receive corrections, i.e. be modified by these terms. In particular, at equal time, the leading term on the first line of (7.13) vanishes, and one is left with only these subdominant contributions, which are of the form K41 plus possible corrections. In other words, the FRG calculation says nothing at this order about intermittency corrections on the scaling exponents of the structure functions, which are equal-time quantities.
However, at unequal times, the important part of the result is the term in the first line of (7.13), which is the exact leading term at large wavenumber. For this reason, the most meaningful way to write this result is under the form
 \begin{equation} {\mathcal{W}}^{(m,\bar{m})}_{\alpha_1\ldots\alpha_{n}}({t_1,\boldsymbol{p}_1}, \ldots, {t_{n-1},\boldsymbol{p}_{n-1}}) \propto \exp[ -\alpha_0 (L/\tau)^{2} |t_\ell \boldsymbol{p}_\ell |^{2} + {{O}}(p_{max} L)] , \end{equation}
where 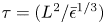 $\tau = (L^{2}/\bar \epsilon ^{1/3})$ is the eddy turnover time at the integral scale, and
 $(L/\tau )$ identifies with
 $U_{rms}$, yielding the sweeping time scale
 $(U_{rms}p)^{-1}$ expected from phenomenological arguments. The salient feature of this result is that it breaks standard scale invariance, which directly originates in the non-decoupling. As stressed before, if there were decoupling, i.e. if the fixed point conformed with a standard critical point, a time variable could only appear through the scaling combination
 $p^{z} t$ with
 $z=2/3$ in K41 theory. Instead, time enters in (7.14) through the combination
 $pt$, which can be interpreted as an effective dynamical exponent
 $z=1$. This is a large correction, which can be attributed to the effect of random sweeping. As a consequence, the argument in the exponential explicitly depends on a scale, the integral scale
 $L$. This residual dependence in the integral scale of the statistical properties of turbulence in the inertial range is well known, and crucially distinguishes turbulence from standard critical phenomena.
Let us mention that, interestingly, the non-decoupling also occurs for the passive scalars in the Kraichnan model (see § 9). In this context, the breaking of scale invariance was associated with the existence of zero modes (Falkovich et al. Reference Falkovich, Gaweȩdzki and Vergassola2001). It would be very interesting to investigate the link between the existence of zero modes and non-decoupling, which could give new insights for the case of NS turbulence.
7.3.2. Large-time regime
Let us now consider the large-time limit of (7.7), corresponding to  $t_i\to \infty$. One can show that in this limit
 \begin{align} &\int_{\omega,\boldsymbol{q}} H_{\kappa,\perp}(\omega,\boldsymbol{q}) \frac{{\rm e}^{{\rm i}\omega(t_k-t_\ell)}-{\rm e}^{{\rm i}\omega t_k} - {\rm e}^{-{\rm i}\omega t_\ell}+1}{\omega^{2}} \stackrel{t_i \to \infty}{\simeq}\frac{J_\kappa}{2} \left(|t_k|+|t_\ell|-|t_\ell-t_k|\right)\nonumber\\ & \quad\text{with}\ J_\kappa = \int_{\boldsymbol{q}} H_{\kappa,\perp}(0,\boldsymbol{q}), \end{align}
and thus the dimensionless flow equation for  $\hat {{\mathcal {W}}}^{(n)}_{\kappa }$ becomes in this limit
 \begin{align} &\left\{\partial_s -d_n - \hat{\boldsymbol{p}}_i \boldsymbol{\cdot} \partial_{\hat{\boldsymbol{p}}_i} + z \hat t_i \partial_{\hat t_i}\right\} \hat{{\mathcal{W}}}^{(n)}_{\kappa,\alpha_1\cdots\alpha_n}(\cdots,{\hat t_i,\hat{\boldsymbol{p}}_i}, \ldots) \nonumber\\ &\quad= \frac{\hat J_\kappa}{6}\sum_{k,\ell} \hat{\boldsymbol{p}}_k\boldsymbol{\cdot}\hat{\boldsymbol{p}}_\ell \left(|\hat t_k|+|\hat t_\ell|-|\hat t_\ell-\hat t_k|\right)\hat{{\mathcal{W}}}^{(n)}_{\kappa,\alpha_1\cdots\alpha_n}(\cdots,{\hat t_i,\hat{\boldsymbol{p}}_i}, \ldots). \end{align}
This equation can be solved at the fixed point in an analogous way as for the small-time limit, introducing another rotation matrix such that in the new wavevector variables  $\boldsymbol {\varrho }_1 = \sum _k\boldsymbol {p}_k$. Specifying to equal time lags
 $t_i=t$ for simplicity, the solution reads (Tarpin et al. Reference Tarpin, Canet and Wschebor2018)
 \begin{align} &\log\left(\bar\epsilon^{({\bar{m}-m})/{3}}L^{{-}d_n}{\mathcal{W}}^{(m,\bar{m})}_{\alpha_1\ldots\alpha_{n}}(t,{\boldsymbol{p}_1}, \ldots, {\boldsymbol{p}_{n-1}})\right)={-}\alpha_\infty\bar\epsilon^{1/3} L^{4/3} \, |t|\, \varrho_1^{2} \nonumber\\ &\qquad -d_n \log (\varrho_1 L)+ {{w_\infty}^{(m,\bar{m})}}_{\alpha_1\ldots\alpha_{n}}\left(\varrho_1^{2/3}\bar\epsilon^{1/3} t,\frac{\boldsymbol{\varrho}_{1}}{\varrho_1}, \ldots, \frac{\boldsymbol{\varrho}_{n-1}}{\varrho_1}\right) + {{O}}(p_{max} L) . \end{align}
The non-universal constant  $\alpha _\infty = \hat \gamma \hat J_*/4$ is again the same for any generalised correlation function, irrespective of its order or fields content. Moreover, the same comments apply for the subleading terms in the second line of (7.17): they merely represent K41 scaling, with possible corrections induced by the neglected terms. The main feature of this solution is thus captured by the expression
 \begin{align} {\mathcal{W}}^{(m,\bar{m})}_{\alpha_1\ldots\alpha_{n}}({t_1,\boldsymbol{p}_1}, \ldots, {t_{n-1},\boldsymbol{p}_{n-1}})\propto \exp\left( -\alpha_\infty (L^{2}/\tau) \left|\sum_\ell \boldsymbol{p}_\ell \right|^{2} \, |t| + {{O}}(p_{max} L) \right) . \end{align}
At large time delays, the temporal decay of correlation functions is also sensitive to the large scale and thus explicitly breaks scale invariance as in the small-time regime. However, the decay drastically slows down, since it crosses over for all wavenumbers from a Gaussian at small time delays to an exponential at large ones. Note that the dependence in the wavenumbers is quadratic in both regime. This large-time regime had not been predicted before. However, it was already in germ in early studies of sweeping, as was noted in Gorbunova et al. (Reference Gorbunova, Balarac, Canet, Eyink and Rossetto2021a). This allows one to provide a simple physical interpretation of these two regimes, see § 7.4. Let us first summarise for later comparisons the explicit forms of the two-point correlation function of the velocity fields
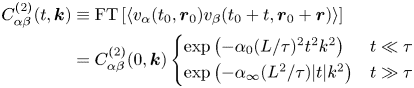 \begin{align} C_{\alpha\beta}^{(2)}(t,\boldsymbol{k}) &\equiv \text{FT} \left[ \left\langle {{v}}_\alpha(t_0, \boldsymbol{r}_0) {{v}}_\beta(t_0 + t, \boldsymbol{r}_0 + \boldsymbol{r}) \right\rangle\right] \nonumber\\ &= C^{(2)}_{\alpha\beta}(0,\boldsymbol{k}) \left\{\begin{array}{@{}ll} \exp \left(-\alpha_0 (L/\tau)^{2} t^{2} k^{2} \right) & t\ll \tau\\ \exp \left(-\alpha_\infty (L^{2}/\tau) |t| k^{2} \right) & t\gg \tau \end{array} \right. \end{align}
and of the three-point correlation function at small time delays  $t_1,t_2 \ll \tau$
 \begin{align} C^{(3)}_{\alpha \beta \gamma} (t_1, \boldsymbol{k}_1, t_2, \boldsymbol{k}_2) &\equiv \text{FT} \left[ \left\langle {{v}}_\alpha(t_0 + t_1, \boldsymbol{r}_0 + \boldsymbol{r}_1) {{v}}_\beta(t_0 + t_2, \boldsymbol{r}_0 + \boldsymbol{r}_2) {{v}}_\gamma(t_0, \boldsymbol{r}_0) \right\rangle \right] \nonumber\\ &= C^{(3)}_{\alpha \beta \gamma} (0, \boldsymbol{k}_1, 0, \boldsymbol{k}_2) \exp(- \alpha_0(L/\tau)^{2} \left|\boldsymbol{k}_1 t_1 + \boldsymbol{k}_2 t_2 \right|^{2} )\, . \end{align}
7.4. Intuitive physical interpretation
Let us now provide an heuristic derivation of these results, proposed in Gorbunova et al. (Reference Gorbunova, Balarac, Canet, Eyink and Rossetto2021a). The early analysis of Eulerian sweeping effects by (Kraichnan Reference Kraichnan1964) was based on the Lagrangian expression for the Eulerian velocity field as
 \begin{align} u_i(t,\boldsymbol{r}) = \exp_{\to}[\boldsymbol{\xi}(t|\boldsymbol{r},t_0)\boldsymbol{\cdot}\boldsymbol{\nabla}] u_i(t_0, \boldsymbol{r}) +\int_{t_0}^{t} \,{\rm d}s \exp_{\to}[\boldsymbol{\xi}(t|\boldsymbol{r},s)\boldsymbol{\cdot}\boldsymbol{\nabla}] \left[ \nu \nabla^{2} u_i(s, \boldsymbol{r})-\nabla_ip(s,\boldsymbol{r})\right]. \end{align}
In this equation,  $\boldsymbol {\xi }(t|\boldsymbol {r},t_0)=\boldsymbol {X}(t|\boldsymbol {r},t_0)-\boldsymbol {r}$ is the Lagrangian displacement vector, where
 $\boldsymbol {X}(t|\boldsymbol {r},t_0)$ denotes the position at time
 $t$ of the Lagrangian fluid particle located at position
 $\boldsymbol {r}$ at time
 $t_0$, which satisfies
 \begin{equation} \frac{{\rm d}}{{\rm d}s}\boldsymbol{X}(t|\boldsymbol{r},s)=\boldsymbol{u}(s,\boldsymbol{X}(t|\boldsymbol{r},s)), \quad \boldsymbol{X}(t|\boldsymbol{r},t)=\boldsymbol{r} . \end{equation}
One can write using (7.21) the expression of the two-point correlation function. This expression can be simplified under some general assumptions, namely slow variations in space and time of the displacement field, and its statistical independence from the initial velocities at sufficiently long time  $t$. Moreover, since the displacements are dominated by the large scales of the flow, whose statistics are nearly Gaussian (Corrsin Reference Corrsin1959, Reference Corrsin1962), one may plausibly further assume a normal distribution for
 $\xi$, resulting in the following expression:
 \begin{equation} C^{(2)}(t,\boldsymbol{k}) = \exp\left[-\frac{1}{2}\langle | \boldsymbol{\xi}(t|\boldsymbol{r},0)|^{2}\rangle k^{2} \right] C^{(2)}(0,\boldsymbol{k}) \{1+{{O}}(\nu k^{2}|t|,k U_{rms}(k)|t|)\}. \end{equation}
According to these arguments, the two-point velocity correlation undergoes a rapid decay in the time difference  $t$ which arises from an average over rapid oscillations in the phases of Fourier modes due to sweeping, or ‘convective dephasing’ (Kraichnan Reference Kraichnan1964).
The connection with the FRG results (7.19) stems from exploiting the results of the classical study by Taylor (Reference Taylor1922) on one-particle turbulent dispersion. In this study, the Lagrangian displacement field was shown to exhibit two regimes
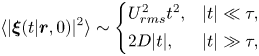 \begin{equation} \langle |\boldsymbol{\xi}(t|\boldsymbol{r},0)|^{2}\rangle \sim \left\{ \begin{array}{@{}ll} U_{rms}^{2} t^{2}, & |t|\ll \tau,\\ 2D|t|, & |t|\gg \tau, \end{array} \right. \end{equation}
where the early-time regime corresponds to ballistic motion with the root-mean-square velocity  $U_{rms}$ and the long-time regime corresponds to diffusion with a turbulent diffusivity
 $D\propto U_{rms}^{2}\tau.$ Inserting these results in (7.23) then yields the FRG expressions (7.19). This argument can be generalised in principle to multi-point correlation functions, which, under the same kind of assumptions, would also lead to similar expressions as the ones derived from FRG. Of course, the FRG derivation is far more systematic and rigorous than these heuristic arguments, but the latter provide an intuitive physical interpretation of these results.
The FRG results have been tested in extensive DNS, focused on the temporal dependence of two- and three-point correlation functions. We report in §§ 8 and 9 the main results.
8. Comparison with DNS
Extensive DNS were performed on high-performance computational clusters to quantitatively test the FRG results. The DNS consist of direct numerical integration of the NS equation with a stochastic forcing using standard pseudo-spectral methods and Runge–Kutta scheme for time advancement, with typical spatial resolution conforming the standard criterion  $k_{max}\eta \simeq 1.5$, and Taylor based Reynolds numbers
 $Re_\lambda$ from 40 to 250 for corresponding grid sizes from
 $64^{3}$ to
 $1024^{3}$. Details can be found, e.g. in Gorbunova (Reference Gorbunova2021). The analysis focused on the two-point and three-point correlation functions of the velocity field, which were computed in the stationary state, using averages over spherical shells in wavenumber and over successive time windows, typically
 \begin{equation} C^{(2)}(t,\boldsymbol{k}) = \frac{1}{N_t}\sum_{j=1}^{N_t} \frac{1}{M_n}\sum_{\boldsymbol{k}\in S_n}\textit{Re}\left[u_i(t_{0j},\boldsymbol{k})u_i^{*}(t_{0j}+t,\boldsymbol{k})\right] , \end{equation}
where  $N_t$ is the number of time windows in the simulation,
 $M_n$ is the number of modes in the spectral spherical shell
 $S_n$ and
 $k=n\Delta k$,
 $n\in \mathbb {Z}$.
8.1. Small-time regime and sweeping
We first present the result for the two-point correlation function at small time delays, whose theoretical expression is given by (7.19). The time dependence of  $C^{(2)} (t,k)$ is displayed in figure 7(a) for a sample of different wavenumbers
 $k$. The larger ones exhibit a faster decorrelation, as expected. For each
 $k$, the normalised curve
 $C^{(2)} (t,k)/C^{(2)} (0,k)$ is fitted with a two-parameter Gaussian function
 $f_{Gaus}(t) = c\exp (- (t/\tau _0)^{2})$, which provides a very accurate model for all curves, as illustrated in the figure. Moreover, all curves collapse into a single Gaussian function when plotted as a function of
 $kt$, as expected from the theory (7.19). The fine quality of the collapse is shown in figure 7(b).
(a) Time dependence of the normalised two-point correlation function  $C^{(2)} (t,k)$ at different wavenumbers
 $k$ for a simulation at
 $Re_\lambda = 90$. Data from the simulation are represented with symbols, and their Gaussian fits with plain lines. (b) Same data plotted as a function of
 $kt$, which leads to their collapse, as expected from the FRG result (7.19).
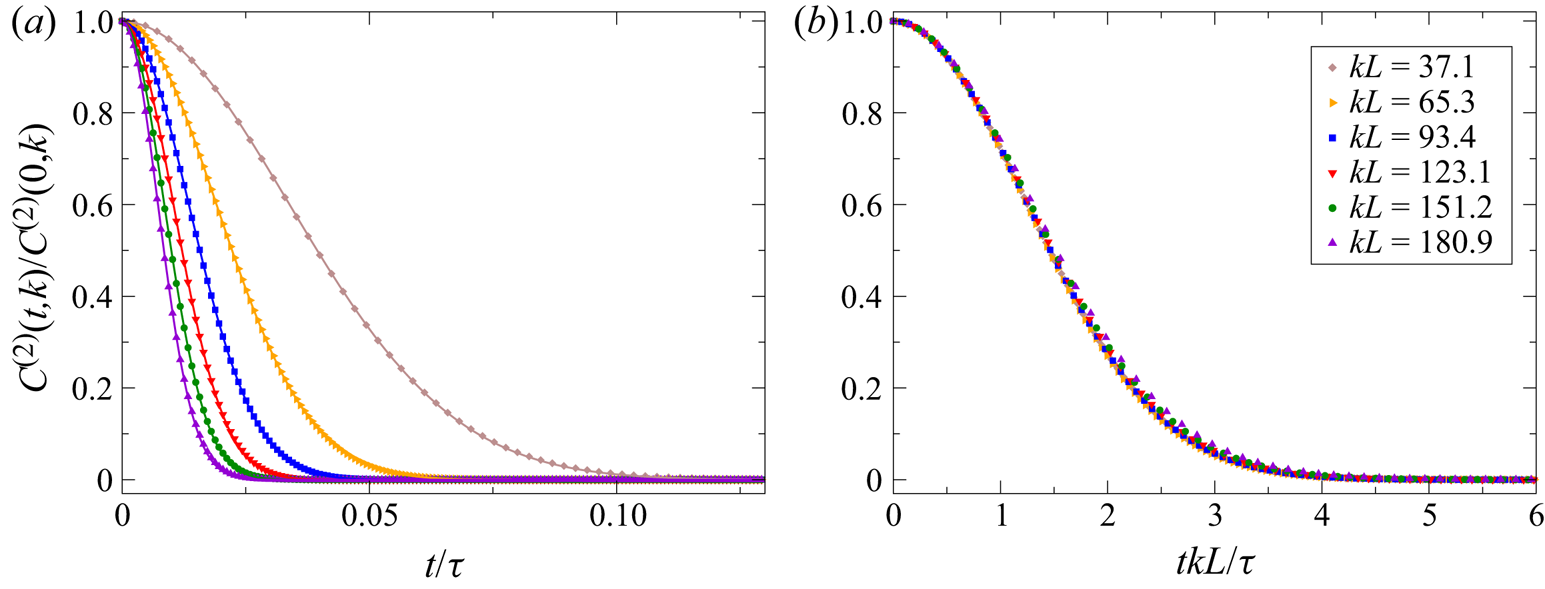
The fitting parameter  $\tau _0$ is plotted as a function of
 $kL$ in figure 8(a), which clearly confirms that it is proportional to
 $k^{-1}$ at large enough
 $k$, and not to the K41 time scale
 $k^{-2/3}$, in plain agreement with the FRG result. Similar results were also obtained in Sanada & Shanmugasundaram (Reference Sanada and Shanmugasundaram1992) and Favier et al. (Reference Favier, Godeferd and Cambon2010), where the characteristic decorrelation time is estimated by integrating the correlation function, as well as in the work of Kaneda et al. (Reference Kaneda, Ishihara and Gotoh1999), where the characteristic time is measured through the second derivative of the correlation function.
(a) Decorrelation time  $\tau _0$ extracted from the Gaussian fit as a function of the wavenumber for various
 $Re_\lambda$. (b) Non-universal constant
 $\alpha _0$ obtained as
 $\alpha _0 = \tau ^{2}/(\tau _0 kL)^{2}$. It reaches a plateau at large wavenumber, which extends with increasing
 $Re_\lambda$.
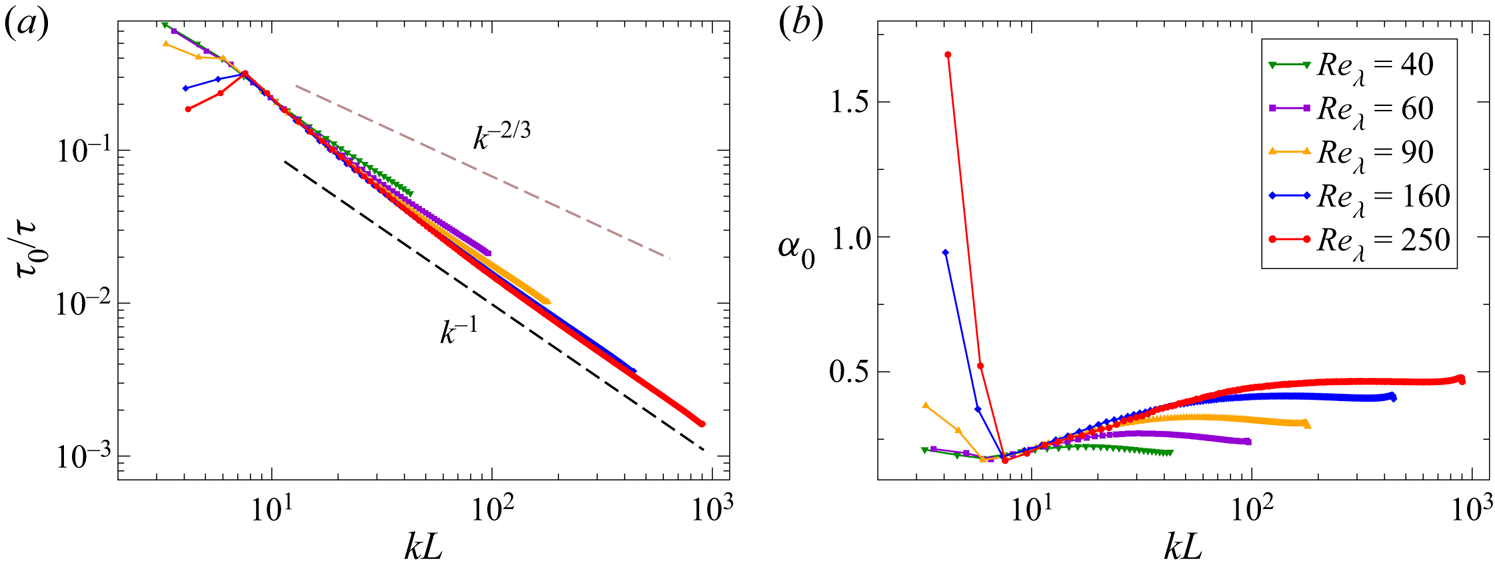
The non-universal constant  $\alpha _0$ can be deduced from
 $\tau _0$ as
 $\alpha _0 = \tau ^{2}/(\tau _0 kL)^{2}$. As can be observed in figure 8(b), this quantity reaches a plateau, which value corresponds to the theoretical
 $\alpha _0$ at large
 $k$. The physical origin of the departure from the plateau at intermediate and small wavenumbers can be clearly identified in the simulations as a ‘contamination’ from the forcing (Gorbunova et al. Reference Gorbunova, Balarac, Canet, Eyink and Rossetto2021a). Indeed, by analysing the modal energy transfers, one observes that the plateau is reached when the energy transfer to a mode
 $k$ is local, i.e. mediated by neighbouring modes only through the cascade process. The modes at intermediate and small
 $k$ also receive energy via direct non-local transfers from the forcing range in the simulations. This means that the large wavenumber limit underlying the FRG derivation corresponds to the modes
 $k$ in the inertial range with negligible direct energy transfer from the forcing range. Of course, the ‘large wavenumber’ domain extends with the Reynolds number, as visible in figure 8. One can also observe that the value of the plateau in the simulations depends on the
 $Re_\lambda$. Although only few points are available, they suggest a saturation at high
 $Re_\lambda$ beyond the values accessible in the DNS. Moreover, although the forcing location and its width are fixed for the different
 $Re_\lambda$, its amplitude varies. The theoretical expression for
 $\alpha _0=\hat \gamma \hat I_*/2$ does depend in the precise forcing profile, which could also explain the
 $Re_\lambda$ dependence. This point was not quantitatively investigated.
8.2. Three-point correlation function
Let us now present the results for the three-point correlation function. The general expression of this correlation (7.20) involves a product of velocities which is not local in  $\boldsymbol {k}$. This is unpracticable in DNS heavily relying on parallel computation and memory distribution. To overcome this difficulty, one can focus on a particular configuration, which corresponds to an advection–velocity correlation. This correlation is defined as
 \begin{equation} \left. \begin{gathered}
{T}(t, \boldsymbol{k}) \equiv \left\langle {N}_\ell(t_0 +
t, \boldsymbol{k}) {u}^{*}_\ell(t_0, \boldsymbol{k})
\right\rangle,\\ {N}_\ell(t, \boldsymbol{k}) ={-}{\rm i}
k_n P^{{\perp}}_{\ell m}(\boldsymbol{k})
\sum_{\boldsymbol{k}^{\prime}} \left\langle {u}_m (t,
\boldsymbol{k}^{\prime}) {u}_n(t, \boldsymbol{k}
-\boldsymbol{k}^{\prime}) \right\rangle,
\end{gathered} \right\}
\end{equation}
where  $\boldsymbol{N}$ is simply the Fourier transform of the advection and pressure term appearing in the NS equation expressed in spectral space
 \begin{equation} \partial_t {u}_\ell (t, \boldsymbol{k}) = {N}_\ell (t, \boldsymbol{k}) - \nu k^{2} {u}_\ell (t, \boldsymbol{k}) + {f}_\ell (t, \boldsymbol{k}) . \end{equation}
At equal times,  $T(0,\boldsymbol {k})$ is thus the usual energy transfer, and (8.2) represents its time-dependent generalisation. Let us note that
 $T(t,\boldsymbol {k})$ is still a statistical moment of order three, although evaluated in a specific configuration involving only two space–time points. It is proportional to a linear combination of three-point correlation function
 $C^{(3)}$ as
 \begin{equation} {T}(t, \boldsymbol{k}) \sim \sum_{\boldsymbol{k}^{\prime}} C^{(3)}_{m n \ell} (t, \boldsymbol{k}^{\prime}, t, \boldsymbol{k} - \boldsymbol{k}^{\prime}) \stackrel{{\rm all} \;|\boldsymbol{k}|\gg L^{{-}1}}{\sim} \exp(- \alpha_0 (L/\tau)^{2} k^{2} t^{2}) \end{equation}
and according to the FRG result, it should behave in the limit where all wavenumbers  $|\boldsymbol {k}|$,
 $|\boldsymbol {k}'|$ and
 $|\boldsymbol {k}-\boldsymbol {k}'|$ are large compared with
 $L^{-1}$, as the indicated Gaussian in
 $kt$.
However, the sum in (8.4) involves all possible wavenumbers  $\boldsymbol {k}'$, and not only large ones. Hence, in order to compare it with the FRG prediction, one needs to perform a scale decomposition, as defined e.g. in Frisch (Reference Frisch1995) and Verma (Reference Verma2019). Each velocity field
 $\boldsymbol {u}(\boldsymbol {k})$ can be decomposed into a small-scale component
 $\boldsymbol {u}^{S}(\boldsymbol {k})$ for
 $|\boldsymbol {k}|> K_c$ and a large-scale one
 $\boldsymbol {u}^{L}(\boldsymbol {k})$ for
 $|\boldsymbol {k}|\leq K_c$ as
 $\boldsymbol {u}(\boldsymbol {k}) = \boldsymbol {u}^{S}(\boldsymbol {k})+\boldsymbol {u}^{L}(\boldsymbol {k})$, where
 $K_c$ is a cutoff wavenumber. This cutoff is chosen such that the direct energy transfers from the forcing range to the modes
 $|\boldsymbol {k}|>K_c$ are negligible, which coincides with the regime of validity of the large wavenumber limit of the FRG identified on the basis of the two-point correlation function. This scale decomposition thus leads to terms of the form
 ${T}^{XYZ} (t,\boldsymbol {k}) = -{[{u}_i^{X}]^{*}}(\boldsymbol {k},t_0) \ \textrm {FT}[u_j^{Y} \partial _j u_i^{Z}](\boldsymbol {k},t_0 + t)$ where
 $X,Y,Z$ stand for
 $S \ \textrm {or}\ L$. Using the terminology of Verma (Reference Verma2019) for instantaneous energy transfers (i.e. for
 $t=0$), the first superscript of
 ${T}^{XYZ}$ is related to the mode receiving energy in a triadic interaction process, the intermediate superscript denotes the mediator mode and the last superscript is related to the giver mode that sends the energy to the receiver mode. The mediator mode does not loose nor receive energy in the interaction, it corresponds to the advecting velocity field, which comes as prefactor of the operator
 $\boldsymbol {\nabla }$ in the nonlinear term of the NS equation.
We are interested in the large wavenumbers  $\boldsymbol {k}$, which correspond to short scales in the previous terminology. Thus, fixing
 $X=S$, the possible contributions for
 $T$ are given by the following expression:
 \begin{equation} {T}(t,\boldsymbol{k}) = [{T}^{SSS} + {T}^{SLS} + {T}^{SSL} + {T}^{SLL}](t,\boldsymbol{k}) . \end{equation}
We focus on the term  ${T}^{SSS}$, which gathers all triadic interactions where the three modes belong to the small scales (all wavenumbers are large). This term constitutes with
 $T^{SLS}$ the turbulent energy cascade.
We show in figure 9 the results for  $T^{SSS}(t,\boldsymbol {k})$ computed from DNS. All the curves for
 $T(t,\boldsymbol {k})$ and
 $T^{SSS}(t,\boldsymbol {k})$ for the different wavenumbers
 $k$ are fitted with the function
 $g_{Gaus}(t)=c(1-t/\tau _l)\exp (-(t/\tau _0)^{2})$, where
 $c$,
 $\tau _l$ and
 $\tau _0$ are the fit parameters. This function provides a very accurate modellisation of the data both for
 $T$ and
 $T^{SSS}$ for all
 $k$. However, only the curves
 $T^{SSS}$ are well approximated by pure Gaussians (
 $\tau _l\ll \tau _0$), whereas without scale decomposition the curves for
 $T$ are in general not symmetric and can take negative values (see Gorbunova et al. Reference Gorbunova, Balarac, Canet, Eyink and Rossetto2021a for details).
(a) Advection–velocity spatio-temporal correlation function  ${T}^{SSS}(t,{k})$ from DNS at
 $Re_\lambda =90$, normalised by the dissipation spectrum
 $\hat {D}(k) = \nu k^{2} C^{(2)}(0,k)$. Data from the simulation are represented with symbols, and their Gaussian fits with plain lines. (b) Same curves
 ${T}^{SSS}(t,{k})$ normalised by
 $T^{SSS}(0,\boldsymbol {k})$ and plotted as a function of
 $k t$, which induces their collapse.
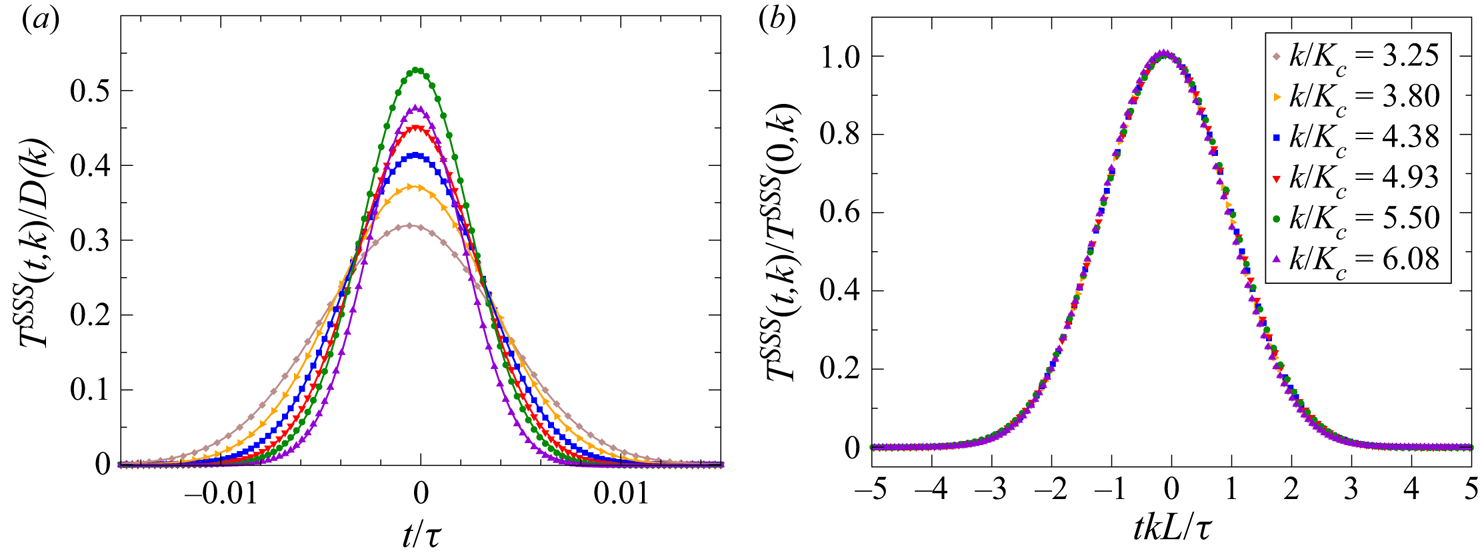
The Gaussian form of  $T^{SSS}$ is in agreement with the FRG result (8.4). As shown in figure 9, all the curves for different wavenumbers collapse onto a single Gaussian when plotted as a function of the variable
 $kt$, as expected from (8.4). Moreover, let us emphasise that the non-universal parameter
 $\alpha _0$ in this equation is predicted to be the same as the one for the two-point correlation function in (7.19). The decorrelation time
 $\tau _0$ extracted from the fit with
 $g_{Gaus}$ is displayed in figure 10, together with the value obtained from
 $C^{(2)}$ and also the one from the full correlation
 $T$. They show as expected a
 $k^{-1}$ dependence. The coefficient
 $\alpha _0$ can be obtained as
 $\alpha _0 = \tau ^{2}/(\tau _0 kL)^{2}$, and is shown in figure 10. At sufficiently large wavenumbers, corresponding to the regime of validity of FRG, the three values coincide with very good precision. At smaller wavenumbers, they are also in good agreement for
 $C^{(2)}$ and for
 $T$, although in this regime
 $\tau _l$ (parameter of the linear part of the fitting function
 $g_{Gaus}$) can be large. The detailed analysis of these results can be found in Gorbunova et al. (Reference Gorbunova, Balarac, Canet, Eyink and Rossetto2021a).
(a) Decorrelation time  $\tau _0$ extracted from the Gaussian fits of the purely small-scale advection–velocity correlation
 $T^{SSS}$ (plain lines), the two-point correlation function
 $C^{(2)}$ (dashed lines) and the full advection–velocity correlation
 $T$ (dashed-dotted lines). (b) Non-universal parameter
 $\alpha _0$ obtained as
 $\alpha _0 = \tau ^{2}/(\tau _0 kL)^{2}$. The data for the different
 $\textit{Re}_\lambda$ in both panels have been shifted vertically for clarity.
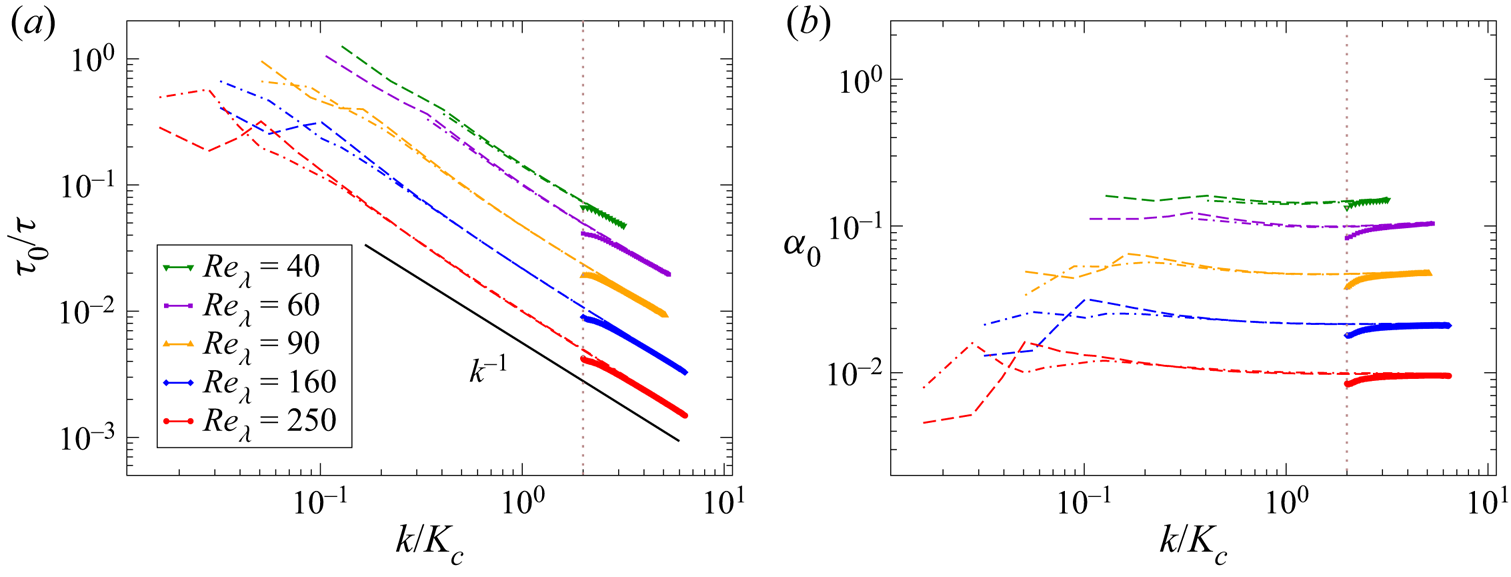
To summarise this part, the results for the spatio-temporal dependence of the two-point and the specific configuration of the three-point correlation function studied in DNS hence confirm with accuracy the FRG prediction in the small-time regime, including the equality of the non-universal prefactors in the exponentials. This regime corresponds to a fast decorrelation on a time scale  $\tau \sim k^{-1}$ related to sweeping. Because of this fast initial decay, the observation in the DNS of the cross-over to another slower regime at large time is very challenging for NS turbulence, as we now briefly discuss.
8.3. Large-time regime
The initial Gaussian decay of the two-point correlation function leads to a fast decrease of the amplitude of the signal within a short time interval. In all the simulations of NS equation, the correlation function falls to a level comparable to the numerical noise while it is still in the Gaussian regime, which prevents from detecting the cross-over to an exponential and resolving the large-time regime.
Interestingly, although this cross-over could not be accessed for the real part of the correlation function, it was observed for a different quantity, namely the correlation function of the modulus of the velocity, defined as
 \begin{equation} {C}_{mod}^{(2)} (t,k) = \left\langle \parallel\hat{\boldsymbol{u}}(t_0,\boldsymbol{k})\parallel{\parallel} \hat{\boldsymbol{u}}(t_0+t,\boldsymbol{k})\parallel \right\rangle - \left\langle \parallel\hat{\boldsymbol{u}}(t_0,\boldsymbol{k})\parallel \right\rangle\left\langle\parallel \hat{\boldsymbol{u}}(t_0+t,\boldsymbol{k})\parallel \right\rangle. \end{equation}
The result obtained in DNS for this quantity is displayed in figure 11, which clearly shows the existence of a Gaussian regime at short time followed by an exponential regime at large time, analogous to the one expected for the real part of the two-point correlation function. Remarkably, very comparable results were obtained in air jet experiments where a similar correlation is measured (Poulain et al. Reference Poulain, Mazellier, Chevillard, Gagne and Baudet2006). Of course,  ${C}_{mod}^{(2)}$ is a quite different object from
 $C^{(2)}$, and there is no theoretical understanding so far of its behaviour, neither from FRG nor from a heuristic argument. Indeed, in the latter argument, the decorrelation stems for a rapid random dephasing of the Fourier modes, while the phases obviously cannot play a role for the decorrelation of the modulus. We mention it here as an interesting puzzle, which deserves further work to be explained.
Time dependence of the normalised two-point correlation function of the velocity modulus  ${C}_{mod}^{(2)} (t,k)$ at
 $\textit{Re}_\lambda = 60$ for different wavenumbers
 $k$. The numerical data are represented with dots, the dashed lines correspond to Gaussian fits and the plain lines to exponential fits.
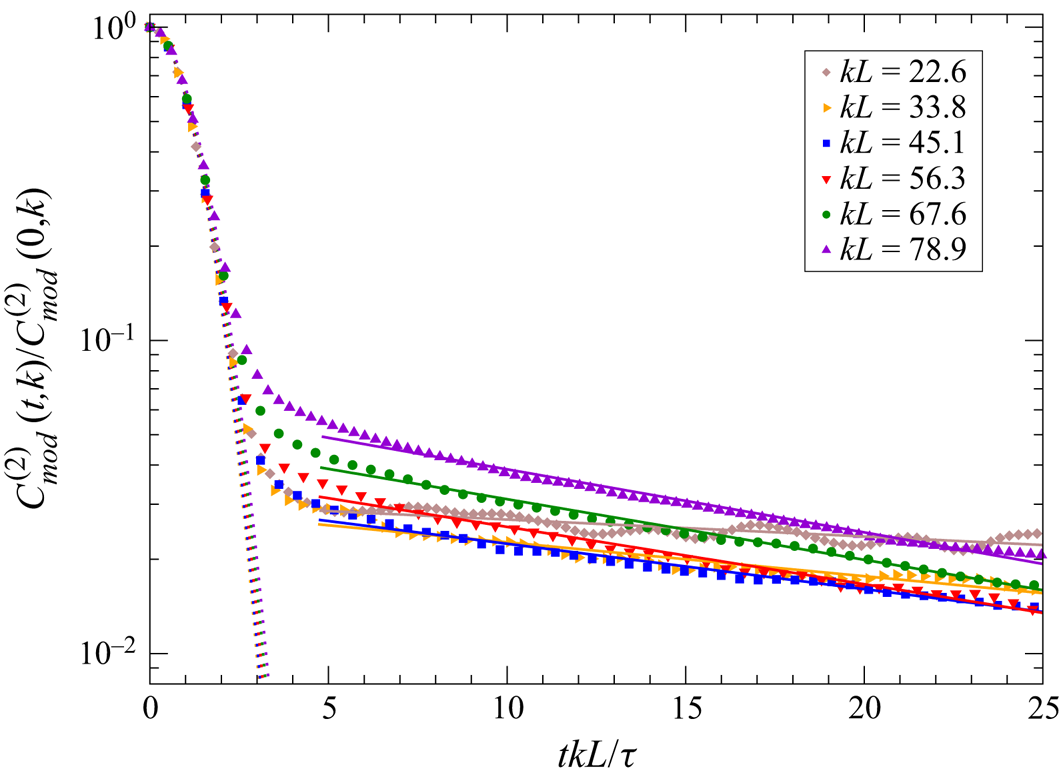
Although the large-time regime appears difficult to access in DNS of NS equation, it can be unravelled in the case of scalar turbulence, which we present in § 9. Prior to this, let us briefly mention another result which concerns the kinetic energy spectrum in the near-dissipation range.
8.4. Kinetic energy spectrum in the near-dissipation range
The expression for the two-point correlation function of the velocity obtained from FRG can also be used to study the kinetic energy spectrum beyond the inertial range, that is beyond the Kolmogorov scale 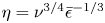 $\eta = \nu ^{3/4}\bar \epsilon ^{-1/3}$. Based on Kolmogorov hypotheses and dimensional analysis, the kinetic energy spectrum is expected to endow the universal form
 \begin{equation} E(k) = \bar\epsilon^{2/3} k^{{-}5/3} F(\eta k), \end{equation}
where  $F(x) \to C_K$ for
 $x\lesssim 1$ since viscous effects are negligible in the inertial range, and
 $F(x)$ decays fast for
 $x\gtrsim 1$ in the dissipation range. Although
 $F$ is expected to be universal, its analytical expression is not known. Many empirical expressions of the form
 $F(x)\sim x^{-\beta } \exp (-\mu x^{\gamma })$ with different values for
 $\gamma$ ranging from 1/2 to 2 were proposed (Monin & Yaglom Reference Monin and Yaglom2007). We refer to e.g. Khurshid, Donzis & Sreenivasan (Reference Khurshid, Donzis and Sreenivasan2018); Buaria & Sreenivasan (Reference Buaria and Sreenivasan2020) and Gorbunova et al. (Reference Gorbunova, Balarac, Bourgoin, Canet, Mordant and Rossetto2020) for recent overviews on the various predictions. Despite the absence of consensus on the precise form of
 $F(x)$, the following general features emerge. There exist two successive ranges:
(i) the near-dissipation range for
$0.2\lesssim k\eta \lesssim 4$ where the logarithmic derivative of the spectrum is not linear and its curvature clearly indicates $\gamma < 1$;(ii) the far-dissipation range for
$k\eta \gtrsim 4$ where the spectrum is well described by a pure exponential decay, which corresponds to $\gamma =1$;


irrespective of the value of  $\beta$. These observations hold for the NS equation in the absence of thermal noise. Of course, at large wavenumbers, the thermal fluctuations become non-negligible and drastically affect the shape of the spectrum, leading to the equilibrium
 $k^{2}$ spectrum reflecting equipartition of energy (Bandak et al. Reference Bandak, Eyink, Mailybaev and Goldenfeld2021; Bell et al. Reference Bell, Nonaka, Garcia and Eyink2022; McMullen et al. Reference McMullen, Krygier, Torczynski and Gallis2022). This cross-over was shown to occur well above the mean free path, at scales within the dissipation range. Thus, depending on the system actual scales for thermal and turbulent fluctuations, the pure exponential decay associated with far-dissipation range may be unobservable in real turbulence and superseded by the thermal spectrum.
Leaving aside this issue, the form of the spectrum just beyond the inertial range can be deduced from FRG by taking the appropriate  $t\to 0$ limit in the expression for the two-point correlation function at large wavenumbers. If one assumes that the scaling variable
 $t k^{2/3}$ saturates when
 $t$ approaches the Kolmogorov time scale
 $\tau _K=\sqrt {\nu /\bar \epsilon }$ and
 $k$ reaches
 $L^{-1}$, one obtains for the energy spectrum
 \begin{equation} E(k) = \lim_{t\to 0} 4{\rm \pi} k^{2} C^{(2)}(t,\boldsymbol{k}) = A \bar\epsilon^{2/3} (k\eta)^{-\beta}\exp(-\mu(k\eta)^{\gamma}) \end{equation}
with  $\gamma =2/3$ and
 $\beta = 5/3$. The expression for
 $C^{(2)}$ is obtained in the large wavenumber expansion and at the fixed point, thus this behaviour is expected to be valid at wavenumbers large
 $k\gg L^{-1}$ but still controlled by the fixed point, which corresponds to the near-dissipation range. Let us emphasise that the result (8.8) does not have the same status as the expression for
 $C^{(2)}$ (7.19). It clearly relies on an additional assumption, the saturation of the scaling variable, which is reasonable but not rigorous. In particular, if one assumes the existence of different successive scalings, associated with the emergence of quasi-singularities (Dubrulle Reference Dubrulle2019), one would obtain a different result. In fact, it would be interesting to investigate whether the distribution of
 $\gamma$ displayed in figure 12 is compatible with a multi-fractal description.
(a) Distribution of the exponent  $\gamma$ of the stretched exponential for over 1600 spectra collected in experimental data from Modane wind tunnel, with different precision criteria for the fit of the spectrum in the dissipation range (see Gorbunova et al. Reference Gorbunova, Balarac, Bourgoin, Canet, Mordant and Rossetto2020 for details). (b) Third logarithmic derivative
 $D_3$ of
 $E(k)$ as a function of the wavenumber from DNS at different Taylor Reynolds numbers. The spectrum in the near-dissipation range is magnified in the inset. The local exponent approaches the blue dashed line, which indicates the FRG prediction
 $\gamma =2/3$, as
 $\textit{Re}_\lambda$ increases.
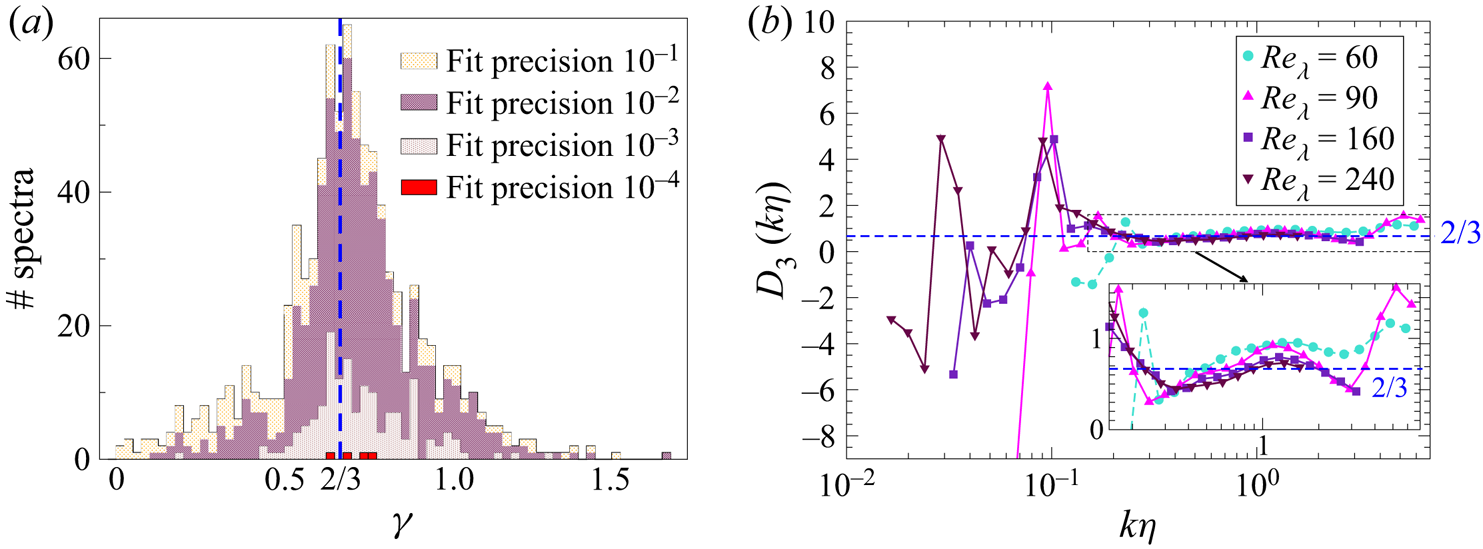
However, it seems reasonable to assume that the first scaling to dominate close to the inertial range is the Kolmogorov one, which leads to the stretched exponential (8.8) with the  $\gamma =2/3$ exponent. This prediction has been verified in high-resolution DNS (Canet et al. Reference Canet, Rossetto, Wschebor and Balarac2017; Buaria & Sreenivasan Reference Buaria and Sreenivasan2020; Gorbunova et al. Reference Gorbunova, Balarac, Bourgoin, Canet, Mordant and Rossetto2020). In the simulations, the exponent
 $\gamma$ was determined through the local exponent defined as
 \begin{equation} D_3(k) = \dfrac{{\rm d}\ln}{{\rm d}\ln(k\eta)}\left[\dfrac{{\rm d}\ln}{{\rm d}\ln(k\eta)}\left[-\dfrac{{\rm d}\ln E(k)}{{\rm d}\ln(k\eta)}\right]\right]. \end{equation}
Indeed, if  $E(k)$ is described by (8.8) on a certain range of
 $k$, one obtains
 $D_3(k) = \gamma$ on this range (Gorbunova et al. Reference Gorbunova, Balarac, Bourgoin, Canet, Mordant and Rossetto2020), irrespective of the value for
 $\beta$. In the DNS, significant averaging was used in order to obtain smooth enough data to allow for the numerical evaluation of the three successive derivatives by finite differences.
It has also been observed in experimental data from von Kármán swirling flows (Debue et al. Reference Debue, Kuzzay, Saw, Daviaud, Dubrulle, Canet, Rossetto and Wschebor2018) and from the Modane wind tunnel (Gorbunova et al. Reference Gorbunova, Balarac, Bourgoin, Canet, Mordant and Rossetto2020). The latter yields the estimate  $\gamma \simeq 0.68\pm 0.19$, which is in very good agreement with the FRG prediction. Two examples of determination of
 $\gamma$ are shown in figure 12.
9. Time dependence of correlation functions in passive scalar turbulence
We now consider a passive scalar field  $\theta (t,\boldsymbol {x})$ which dynamics is governed by the advection–diffusion equation (2.4). In this section, we consider three cases for the carrier flow: (i) the advecting field
 $\boldsymbol {v}(t,\boldsymbol {x})$ is a turbulent velocity field solution of the incompressible NS equation (2.1), (ii)
 $\boldsymbol {v}(t,\boldsymbol {x})$ is a random vector field with a Gaussian distribution characterised by zero mean and covariance
 \begin{equation} \left\langle {{v}}_\alpha \left(t,\boldsymbol{x}\right) {{v}}_\beta \left(t^{\prime},\boldsymbol{y} \right) \right\rangle = \delta\left(t-t^{\prime}\right) D_{0}\int_{\boldsymbol{p}} \frac{\exp({{\rm i} \boldsymbol{p}\boldsymbol{\cdot}\left(\boldsymbol{x}-\boldsymbol{y}\right)})P^{{\perp}}_{\alpha\beta}(\boldsymbol{p})}{\left(p^{2}+m^{2}\right) ^{{d}/{2}+{\varepsilon}/{2}}}, \end{equation}
where  $P^{\perp }_{\alpha \beta }(\boldsymbol {p})$ is the transverse projector which ensures incompressibility and (iii) the same random vector field with finite time correlations instead of
 $\delta (t-t')$. The model (ii) was proposed by Kraichnan (Reference Kraichnan1968, Reference Kraichnan1994), and has been thoroughly studied (we refer the reader to Falkovich et al. Reference Falkovich, Gaweȩdzki and Vergassola2001; Antonov Reference Antonov2006) for reviews). In this model, the parameter
 $0<\varepsilon /2<1$ corresponds to the Hölder exponent, describing the velocity roughness from very rough for
 $\varepsilon \to 0$ to smooth for
 $\varepsilon \to 2$, and
 $m$ acts as an IR cutoff.
The spatio-temporal correlations of the passive scalar in the three models for the carrier flow has been investigated within the FRG formalism in Pagani & Canet (Reference Pagani and Canet2021). We first summarise the main results, and then present comparison with DNS for the three cases.
9.1. The FRG results for the correlation functions of passive scalars
9.1.1. Scalar field in NS flow
We start with the model (i), i.e. a scalar field transported by a NS turbulent flow. We focus on the inertial–convective range, in which the energy spectrum of the scalar decays as 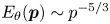 $E_\theta (\boldsymbol {p})\sim p^{-5/3}$ as established by Obukhov & Corrsin in their seminal works (Obukhov Reference Obukhov1949; Corrsin Reference Corrsin1951). As shown in § 3.3, the action for the passive scalar possesses similar extended symmetries as the NS action. As a consequence, the structure of the related Ward identities for the vertices is the same: they all vanish upon setting one wavevector to zero, unless it is carried by a velocity field in which case it can be expressed using the
 ${\mathcal {D}}_\alpha$ operator (A7). Hence, the derivation of § 7.2 can be reproduced identically in the presence of the scalar fields. We refer to Pagani & Canet (Reference Pagani and Canet2021) for details. This yields the general expression for the time dependence of any
 $n$-point generalised correlation function of the scalar in the limit of large wavenumbers.
In this section, we only consider two-point correlation functions, so we drop the superscript  $^{(2)}$ on
 $C$ in the following. The correlation function of the scalar, defined in time–wavevector coordinates as
 $C_{\theta, {NS}}(t,\boldsymbol {p})\equiv \langle \theta (t,\boldsymbol {p})\theta (0,-\boldsymbol {p} ) \rangle$, is given in the FRG formalism by
 \begin{equation} C_{\theta, {NS}}\left(t,\boldsymbol{p}\right) = \frac{\bar\epsilon_\theta \bar\epsilon^{{-}1/3}}{ p^{11/3}} \left\{ \begin{array}{@{}ll} C_{0} \exp\left({-\alpha_{0} (L/\tau)^{2} p^{2} t^{2}}\right), & t\ll \tau \\ C_{\infty} \exp\left({-\alpha_{\infty} (L^{2}/\tau) p^{2} |t|}\right), & t\gg \tau , \end{array} \right. \end{equation}
where  $\bar \epsilon$ and
 $\bar \epsilon _\theta$ denote the mean energy dissipation rates of the velocity and scalar fields respectively,
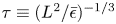 $\tau \equiv (L^{2}/\bar \epsilon )^{-1/3}$ is the eddy turnover time at the energy injection scale and
 $C_{0,\infty }$ and
 $\alpha _{0,\infty }$ are constants. In fact,
 $\alpha _{0,\infty }$ are the same constants as the ones in the NS velocity correlation function (7.19). They can be calculated using FRG by integrating the flow equations, for example within the LO approximation presented in § 6, for the forcing profile under consideration (or a reasonable model of it). Hence, the temporal decay of the scalar correlations is determined in the inertial–convective range by the one of the carrier fluid. In particular, these constants depend on the profile of the forcing exerted on the velocity, but not on the one exerted on the scalar field.
9.1.2. Scalar field in white-in-time synthetic velocity flow
Let us now focus on the model (ii) proposed by Kraichnan (Reference Kraichnan1968), in which the NS velocity field is replaced by a random vector field with white-in-time Gaussian statistics. The remarkable feature of this model is that, despite its extreme simplification compared with real scalar turbulence, it still retains its essential features, and in particular universal anomalous scaling exponents of the structure functions. Moreover, it is simple enough to allow for analytical calculation in suitable limits (Chertkov et al. Reference Chertkov, Falkovich, Kolokolov and Lebedev1995; Gawedzki & Kupiainen Reference Gawedzki and Kupiainen1995; Bernard, Gawedzki & Kupiainen Reference Bernard, Gawedzki and Kupiainen1996, Reference Bernard, Gawedzki and Kupiainen1998; Chertkov & Falkovich Reference Chertkov and Falkovich1996; Adzhemyan, Antonov & Vasil'ev Reference Adzhemyan, Antonov and Vasil'ev1998; Adzhemyan et al. Reference Adzhemyan, Antonov, Barinov, Kabrits and Vasil'ev2001; Kupiainen & Muratore-Ginanneschi Reference Kupiainen and Muratore-Ginanneschi2007; Pagani Reference Pagani2015), see Falkovich et al. (Reference Falkovich, Gaweȩdzki and Vergassola2001) and Antonov (Reference Antonov2006) for reviews. The temporal dependence of the scalar correlation function was analysed in Mitra & Pandit (Reference Mitra and Pandit2005) and Sankar Ray, Mitra & Pandit (Reference Sankar Ray, Mitra and Pandit2008). Within the FRG framework, the large wavenumber expansion also allows in this case for the closure of the flow equations for the scalar correlation functions. Indeed, for Kraichnan model, the action for the velocity field 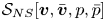 ${\mathcal {S}}_{NS}[\boldsymbol {v},\bar {\boldsymbol {v}},p,\bar p]$ is simply replaced by
 \begin{equation} {\mathcal{S}}_{K}[\boldsymbol{v}] = \int_{\boldsymbol{x}} {{v}}_\alpha(t,\boldsymbol{x})\frac{(-\partial^{2} +m^{2}) ^{({d+\varepsilon})/{2}}}{2 D_0} {{v}}_\alpha(t,\boldsymbol{x}) . \end{equation}
Remarkably, the total action  ${\mathcal {S}}_{K} + {\mathcal {S}}_\theta$ still possesses the same extended symmetries, but for the time-dependent shifts of the response fields (3.32) and (A4), which reduce to
 $\bar \theta (t,\boldsymbol {x}) = \bar \theta (t,\boldsymbol {x})+\bar \epsilon (t)$. The resulting Ward identities endow an essentially identical structure, such that the derivation of the large wavenumber expansion proceeds in the same way. The essential difference arises when computing the loop integral in the second line of (7.7), in which the velocity propagator in (7.6) is replaced by
 \begin{equation} \bar{G}_{{{v}}_\alpha {{v}}_\beta}(\omega,\boldsymbol{q}) = 2 D_0 \frac{P^{{\perp}}_{\alpha\beta}(\boldsymbol{q})}{(q^{2} +m^{2}) ^{({d +\varepsilon})/{2}}+{\mathcal{R}}_{\kappa, vv}(\boldsymbol{q})} . \end{equation}
Because of the white-in-time (frequency-independent) nature of the Kraichnan propagator, the loop integral can be computed explicitly for any time delay, and yields a linear dependence in  $t$. This implies that the decay of the scalar correlation is always exponential in time, e.g. for the two-point function
 \begin{equation} C_{\theta, {K}}\left(t,\boldsymbol{p}\right) = F\left(p\right) \exp({-2\kappa_{ren} p^{2} |t|}) , \end{equation}
hence there is no Gaussian regime at small times. Moreover, one obtains an explicit expression for the non-universal constant  $\kappa _{ren}$
 \begin{equation} \kappa_{ren} = \kappa_\theta + \frac{d-1}{2d} \int_{\boldsymbol{p}} \frac{D_{0}}{\left(p^{2}+m^{2}\right)^{{d}/{2}+{\varepsilon}/{2}}}. \end{equation}
The second term in the renormalised diffusivity  $\kappa _{ren}$ embodies the effect of fluctuations and can therefore be interpreted as an eddy diffusivity. The prefactor
 $F(p)$ in (9.5) is given by an integral, which behaves in the inertial range as
 $F(p) \sim p^{-d-2+\varepsilon }$ while in the weakly nonlinear regime (i.e. when the convective term is perturbative), it behaves as
 $F(p) \sim p^{-d-2-\varepsilon }$ (Frisch & Wirth Reference Frisch and Wirth1996; Pagani & Canet Reference Pagani and Canet2021). For the Kraichnan model, there is no anomalous correction to the second-order structure function (Falkovich et al. Reference Falkovich, Gaweȩdzki and Vergassola2001; Antonov Reference Antonov2006). The dimensional (analogous to K41) scaling of
 $F(p)$ is in this case an exact result.
9.1.3. Scalar field in time-correlated synthetic velocity flow
Let us introduce a slight extension of the Kraichnan model, model (iii), in which the white-in-time covariance (9.1) of the synthetic velocity field in replaced by one with tuneable time correlations  $D_{T_e}(t-t')$, where
 $T_e$ represents the typical decorrelation time of the synthetic velocity. The pure Kraichnan model is simply recovered in the limit
 $T_e\to 0$ where
 $D_{0}(t-t')\equiv \delta (t-t')$. The calculation of the scalar correlation functions within the FRG large wavenumber expansion is strictly identical to the pure Kraichnan case, except for the loop integral in (7.7). Indeed, as soon as some time dependence is introduced in the velocity covariance, hence in the velocity propagator (9.4), one restores the two time regimes. Let us focus for simplicity on the two-point scalar correlation function
 $C_{\theta, {K_{T_e}}}(t,\boldsymbol {p})$. For small time delays
 $t\ll T_e$, the Fourier exponentials in the loop integral can be expanded and one finds the Gaussian decay in
 $p t$, whereas for large time delays
 $t\gg T_e$,
 $T_e$ can be replaced by zero in the integral and one recovers the Kraichnan exponential decay in
 $p^{2} |t|$.
The great advantage of this model is that the time scale of the correlation function of the velocity field is adjustable and can be varied independently of the scalar dynamics, in particular in DNS, such that it allows one to access the cross-over between the two time regimes, as shown in § 9.4.
9.2. Passive scalars in NS flow
The spatio-temporal behaviour of the correlation function of the scalar transported by NS flow has been studied in DNS in Gorbunova et al. (Reference Gorbunova, Pagani, Balarac, Canet and Rossetto2021b), using similar numerical methods as for the NS case. The Schmidt number of the scalar, defined as the ratio of the fluid viscosity to the scalar diffusivity  $Sc=\nu /\kappa _\theta$ was varied from 0.7 to 36, and the two-point correlations of both the scalar and the velocity fields were recorded during the runs with similar averages as in (8.1).
The results for  $C_{\theta,{NS}}(t,\boldsymbol {k})$ are presented in figure 13. Each curve for a fixed wavenumber is accurately fitted by a Gaussian
 $f_{Gaus}(t) = c\exp (-(t/\tau _0)^{2})$. Moreover, all curves for different wavenumbers collapse when plotted as a function of the variable
 $kt$, as expected from the FRG result (9.2). This behaviour is completely similar to the one of the NS velocity field presented in figure 7, as anticipated. The transported scalars behave in the inertial–convective range as the carrier fluid particles.
Time dependence of the normalised two-point correlation function  $C_{\theta,{NS}} (t,k)$ of the scalar in the NS flow at different wavenumbers
 $k$ for
 $R_\lambda = 90$, as a function of
 $t$ (a) and of
 $kt$ (b), which results in their collapse. Here,
 $L$ is the integral length scale,
 $\tau$ is the eddy turnover time scale at the integral scale.
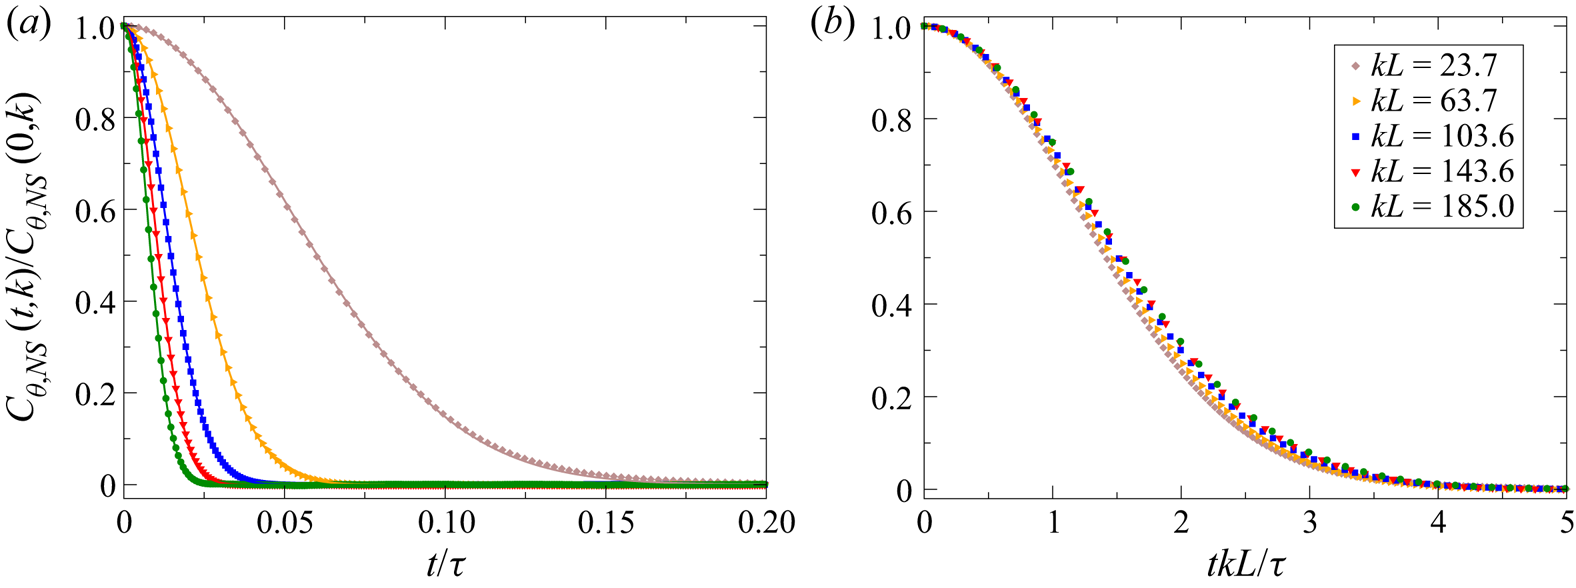
The decorrelation time  $\tau _0$ extracted from the Gaussian fit is displayed in figure 14. According to (9.2), it is related to
 $\alpha _0$ as
 $\tau _0/\tau = (\sqrt {\alpha _0} kL)^{-1}$, and it is found to precisely conform to the expected
 $k^{-1}$ decay. Moreover, beyond this behaviour, the FRG analysis yields that the prefactor
 $\alpha _0$ is uniquely fixed by the properties of the carrier fluid, and is therefore equal for the velocity and the transported scalars. The numerical data for
 $\alpha _0$ shown in figure 14 confirm this result, since the values of
 $\alpha _0$ for the velocity correlations and for the scalar correlations are in very close agreement, and almost independent of the scalar properties. Indeed, the variation of
 $Sc$ from 0.7 to 36 does not lead to significant changes of
 $\alpha _0$. Hence the dynamics of the scalar field is dominated by the random advection and the sweeping effect.
(a) Decorrelation time  $\tau _0$ extracted from the Gaussian fit of the scalar correlations (plain lines) and of the velocity correlations (dashed lines) as a function of the wavenumber for various
 $\textit{Re}_\lambda$ and
 $Sc$. (b) Non-universal parameter
 $\alpha _0$ obtained as
 $\alpha _0 = \tau ^{2}/(\tau _0 kL)^{2}$. In panels (a,b), the data for
 $\textit{Re}_\lambda =90$ are shifted downward by a factor 10 for visibility.
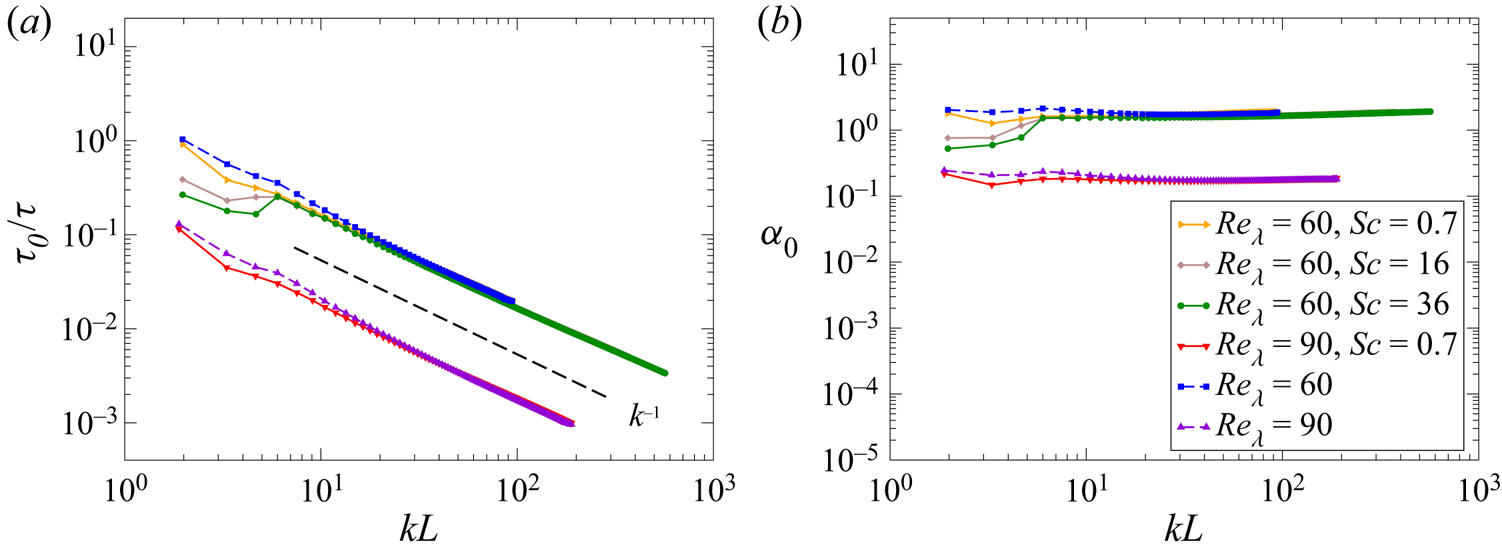
At large time delays, a cross-over from the Gaussian in  $kt$ to an exponential in
 $k^{2}t$ is predicted by the FRG result (9.2). However, the Gaussian decay at small time induces a fast decrease of the correlations, such that the signal approaches zero and becomes oscillatory is the simulations before the cross-over can occur. This prevents from its detection, as for the NS flow, which is not surprising since in this inertial–convective range the behaviour of the scalar closely follows that of the velocity field. It would be very interesting to study other regimes of the scalar in order to find a more favourable situation to observe the large-time regime. Meanwhile, the cross-over can be evidenced in the case of synthetic flows, as we now show.
9.3. Passive scalars in the Kraichnan model
The correlation function of the scalar field transported in a white-in-time synthetic velocity field has also been studied in Gorbunova et al. (Reference Gorbunova, Pagani, Balarac, Canet and Rossetto2021b). A random vector field, isotropic and divergenceless, conforming to a Gaussian distribution with the prescribed covariance (9.1) is generated. The advection–diffusion equation (2.4) with this synthetic field is then solved using DNS. The details of the procedure and parameters can be found in Gorbunova et al. (Reference Gorbunova, Pagani, Balarac, Canet and Rossetto2021b). In order to achieve a precision test of the FRG result (9.5) and (9.6), 24 different sets of simulations were analysed, varying the different parameters: Hölder exponent  $\varepsilon$, amplitude
 $D_0$ of the velocity covariance and diffusivity
 $\kappa _\theta$ of the scalar.
For each set, the correlation function of the scalar  $C_{\theta,{K}}(t,\boldsymbol {k})$ was computed. As illustrated in figure 15, it always exhibits an exponential decay in time, perfectly modelled by the fitting function
 $f_{exp}(t) = c\exp (-t/\tau _K)$. The decorrelation time
 $\tau _K$ depends on the wavenumber as
 $\tau _K\sim k^{-2}$, as expected from (9.5), and shown in figure 16.
Time dependence of the normalised two-point correlation function of the scalar  $C_{\theta, {K}} (t,k)$ in the Kraichnan model at different wavenumbers, as a function of time (b) and of the variable
 $k^{2} t$ (a) which leads to their collapse. Data from the numerical simulation, for
 $\varepsilon =1$ in this example, are denoted with dots and their exponential fits with continuous lines.
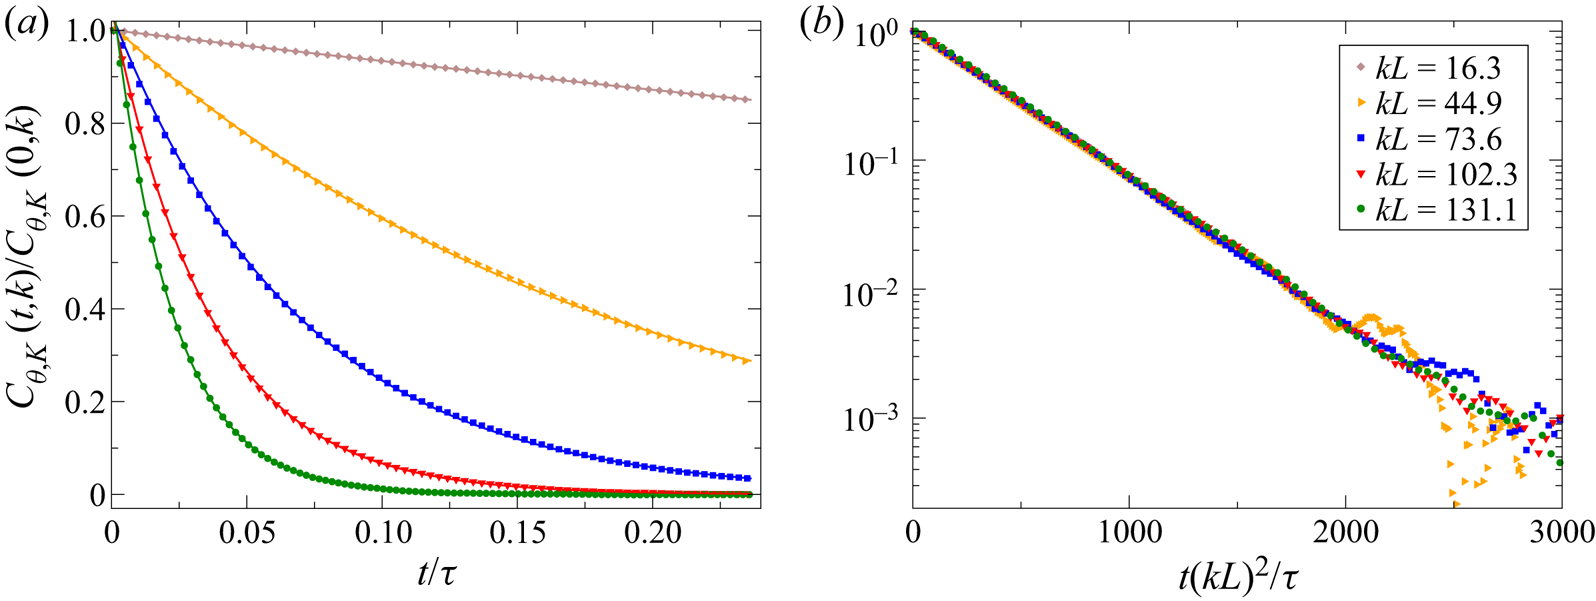
(a) Decorrelation time  $\tau _K$ extracted from the exponential fits for different values of the Hölder exponent
 $\varepsilon$ from 0.1 to 2. (b) Compensated decorrelation time
 $k^{2} \tau _K$ extracted from the exponential fits, for different values of
 $D_0$ and
 $\varepsilon =1$. The renormalised diffusivity
 $\kappa _{ren}$ for each curve is determined as the fitted value of the plateau represented by dashed lines.
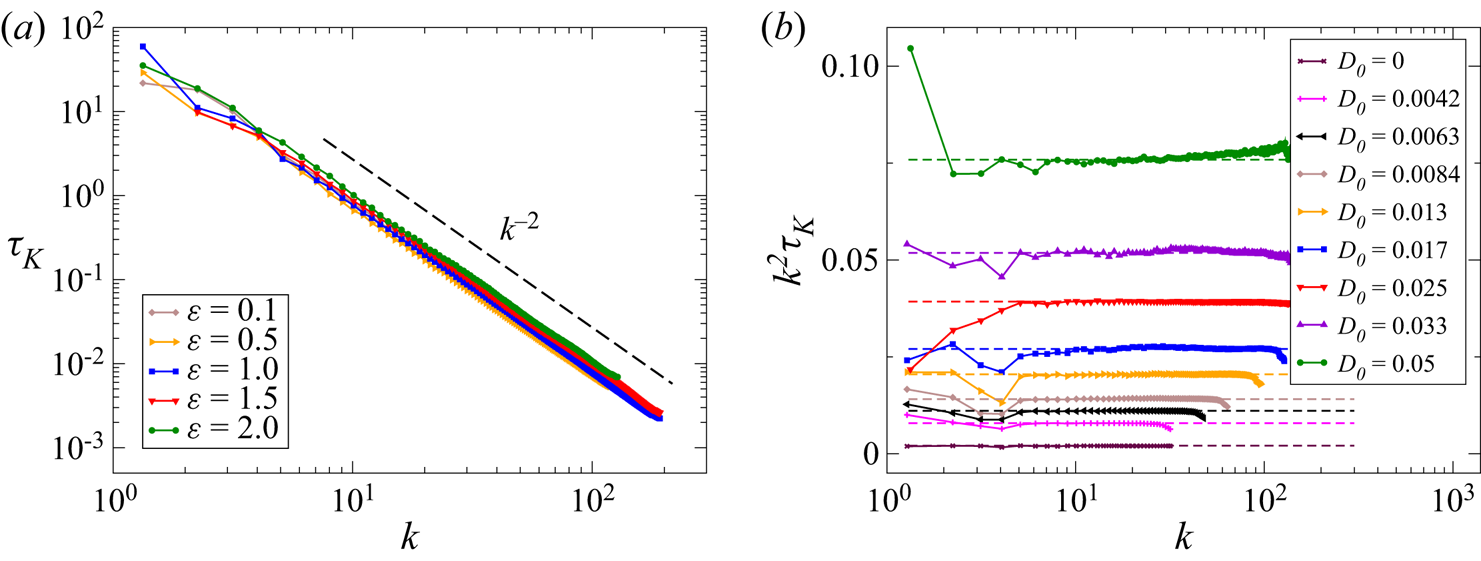
Beyond the global exponential form of the spatio-temporal dependence of the scalar correlation function, the non-universal factor  $\kappa _{ren}$ in the exponential can be computed explicitly for the Kraichnan model within the FRG framework and is given by (9.6). Its value depends on the parameters
 $\varepsilon$,
 $D_0$ characterising the synthetic velocity and
 $\kappa _\theta$ characterising the scalar. All these parameters have been varied independently in the 24 sets of simulations. For each set,
 $\kappa ^{num}_{ren}$ is determined from the numerical data as the plateau value of
 $\tau _K k^{2}$, where
 $\tau _K$ is extracted from the exponential fit, as illustrated in figure 16. Besides, the value of
 $(\kappa _{ren}-\kappa _\theta )$ depends on the synthetic velocity only and can be computed prior to any simulation as
 $\kappa ^{num}_{ren} -\kappa _\theta = A_\varepsilon D_0$ with
 $A_\varepsilon = \frac {1}{3} \sum _{\boldsymbol {p}} {D_{0}}/{(p^{2}+m^{2})^{{3}/{2}+{\varepsilon }/{2}}}$ following the FRG expression (9.6). The comparison of the two estimations for
 $\kappa _{ren}$ is displayed in figure 17, which shows a remarkable agreement. Let us emphasise that the numerical data presented span values of
 $\varepsilon$ up to 1.5, well beyond the perturbative regime
 $\varepsilon \simeq 0$ (Adzhemyan et al. Reference Adzhemyan, Antonov and Vasil'ev1998). This analysis hence provides a thorough confirmation of the FRG theory, including to the precise form of the non-universal prefactor in the exponential.
Renormalised scalar diffusivity:  $\kappa _{ren}$ (simulations) is obtained from the plateau values of
 $k^{2} \tau _K$ extracted from the exponential fits of the scalar correlation function;
 $\kappa _{ren}$ (theory) is calculated from its theoretical estimate based on (9.6). The data are gathered from the 24 data sets for which the parameters
 $\varepsilon$,
 $Sc$,
 $D_0$,
 $\kappa _\theta$ are varied independently (see Gorbunova et al. Reference Gorbunova, Pagani, Balarac, Canet and Rossetto2021b for detailed parameters).
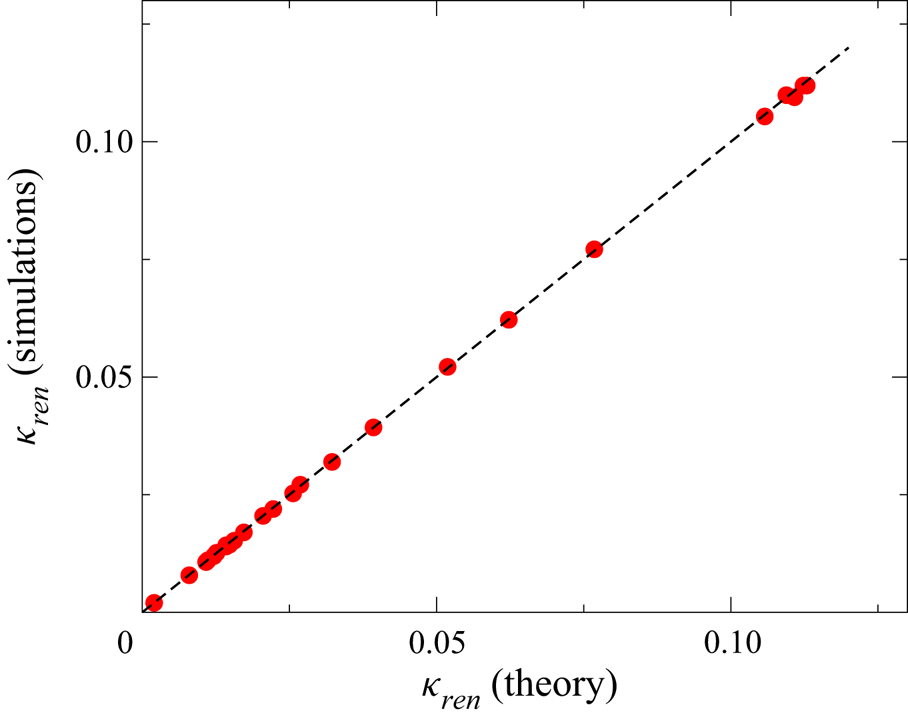
9.4. Passive scalars in a time-correlated synthetic flow
Let us now turn to the extended Kraichnan model (iii), i.e. a scalar field advected by a synthetic velocity field with finite time correlations  $D_{T_e}(t-t')$. The simplest implementation of these finite time correlations in the DNS is to define a correlator
 $D_{T_e}(t) = ({1}/{T_e})\theta (t-T_e)$, where
 $\theta (t)$ is the Heavyside step function. Hence, when
 $T_e$ is negligible compared with the other dynamical time scales of the mixing (
 $\tau _A \sim \eta _B /U_{{rms}}$ for advection, and
 $\tau _\kappa \sim \eta _B^{2}/\kappa _\theta$ for diffusion, with
 $\eta _B$ the Batchelor scale, i.e. the smallest variation scale of the scalar), the velocity field can be considered as white in time (pure Kraichnan model). In contrast, when
 $T_e$ becomes comparable to the typical decorrelation time of the scalar – say
 $\tau _K$ estimated from the pure Kraichnan model at intermediate wavenumbers – then it realises a correlated synthetic velocity field.
The correlation function of the scalar  $C_{\theta,{K_{T_e}}}(t,\boldsymbol {k})$, obtained from DNS of model (iii), is shown in figure 18. At small time delays
 $t \leq T_e$, the different curves for each wavenumber are well fitted by Gaussian curves, whereas at large time delays, they depart from their Gaussian fits and decay much more slowly. The slower decay is precisely modelled by exponential fits. Hence, the cross-over from the small-time Gaussian regime to the large-time exponential one, predicted by FRG, can be observed in this model. It can be further evidenced by computing the time derivative of
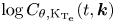 $\log C_{\theta,\textrm{K}_{\textrm{T}_\textrm{e}}}(t,\boldsymbol {k})$. According to the FRG results, one should obtain
 \begin{equation} \frac{1}{k^{2}}\frac{\partial \log C_{\theta,{\rm K_{T_e}}}(t,k)}{\partial t} = \left\{ \begin{array}{@{}ll} -2 \alpha_0 t, & t \ll T_e,\\ - \alpha_\infty, & t \gg T_e, \end{array} \right. \end{equation}
where  $\alpha _{0,\infty }$ are the non-universal prefactors depending on the velocity characteristics only. This derivative is displayed in figure 18. All the curves collapse when divided by
 $k^{2}$, and show a linear decay with negative slope at small time, which crosses over to a negative constant at large time, in agreement with (9.7). Note that at higher wavenumbers (not shown), the large-time regime becomes indiscernible as the scalar field decorrelates fast (because of the
 $\sim k^{2}$ dependence) down to near-zero noisy values before
 $T_e$ is reached. This prevents us from resolving the cross-over for these wavenumbers. This hints that a similar effect hinders the large-time regime in NS flows.
(a) Time dependence of the normalised two-point correlation function  $C_{\theta,{K_{T_e}}} (t,k)$ at different wavenumbers
 $k$. Data from the numerical simulation are denoted with dots, their Gaussian fits calculated for
 $t\leq T_e$ with continuous lines, their exponential fits calculated for
 $t\geq T_e$ with dashed lines. (b) Time derivative of the logarithm of the same data (including the fits), divided by
 $D_0 k^{2}$.
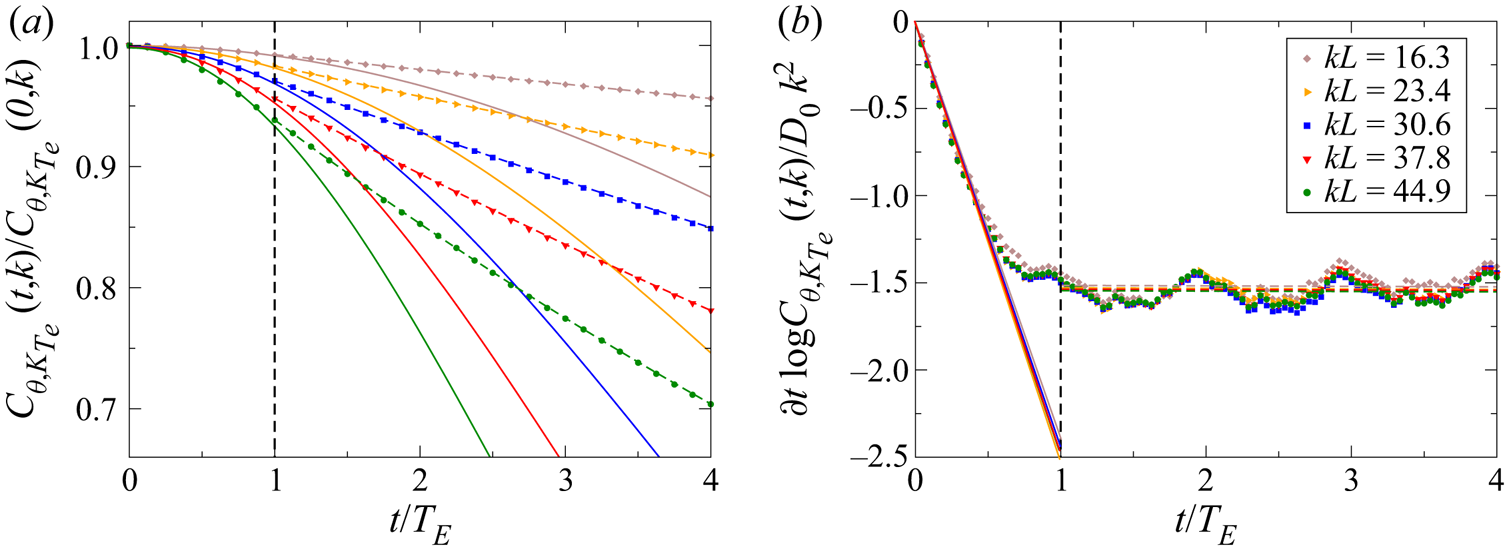
10. Conclusion and perspectives
The purpose of this JFM Perspectives article was to give an overview of what has been achieved using FRG methods in the challenging field of turbulence, and to provide the necessary technical elements for the reader to grasp the basis and the scope of these results. An important aspect is that the RG is in essence conceived to build effective theories from ‘first principles’, in the sense that it is a tool to compute statistical properties of a system, by averaging over fluctuations, from its underlying microscopic or fundamental description, that is, in the case of turbulence, from the NS equations, without phenomenological inputs. An essential ingredient in this method is the symmetries, and extended symmetries, which can be fully exploited within the field-theoretical framework through exact Ward identities, that we expounded. So far, the main aspects of turbulence addressed with the FRG methods are the universal statistical properties of stationary, homogeneous and isotropic turbulence. In this context, the main achievements of this approach are twofold.
The first one is the evidence for the existence of a fixed point of the RG flow, for physical forcing concentrated at large scales, which describes fully developed turbulence. This was not accessible using perturbative RG approaches, because they are restricted to power-law forcing which changes the nature of the turbulence. The very existence of a fixed point demonstrates two essential properties of turbulence: universality (independence of the precise forcing and dissipation mechanisms) and power-law behaviours. So far, this fixed point has been studied within a simple approximation of the FRG, called LO, which amounts to neglecting all vertices of order  $n\geq 3$ but the one present in the NS field theory. Nonetheless, this rather simple approximation allows one to recover the exact result for the third-order structure function, and yields the correct K41 scaling for the energy spectrum and the second-order structure function, with accurate estimates of the Kolmogorov constant. This work calls for further calculations, within improved approximations, in order to determine whether anomalous exponents arise when including higher-order vertices in the FRG ansatz. This is a first route to be explored, possibly coupled with the introduction of composite operators, to achieve this goal. This program has already been started in shell models, which are simplified models of turbulence. It indeed allows us to compute intermittency corrections to the exponents of the structure functions (Fontaine et al. Reference Fontaine, Tarpin, Bouchet and Canet2022).
The second achievement using FRG, which is the most striking one, is the obtainment of the general expression, at large wavenumbers, of the spatio-temporal dependence of any  $n$-point correlation and response function in the turbulent stationary state. The valuable feature of this expression is that it is asymptotically exact in the limit of large wavenumbers. Given the scarcity of rigorous results in 3-D turbulence, this point is remarkable and worth highlighting. All the
 $n$-point correlation functions are endowed with a common structure for their temporal behaviour, which can be simply summarised, on the example of the two-point function
 $C(t,\boldsymbol {p})$ for conciseness, as follows. At small time delays
 $t$,
 $C(t,\boldsymbol {p})$ exhibits a fast Gaussian decay in the variable
 $p t$, while at large time delays, it shows a cross-over to a slower exponential decay in the variable
 $p^{2} |t|$. The prefactors
 $\alpha _0$ entering the Gaussian, and
 $\alpha _\infty$ entering the exponential, respectively, are non-universal, but are equal for any
 $n$-point correlations. Similar expressions have been established in the case of passive scalars transported by turbulent flows, in the three cases where the turbulent velocity field is either the solution of the NS equations, or a synthetic random velocity field (Kraichnan model and its time-correlated extension). For the NS turbulent flow, the behaviour of the scalar follows in the inertial–convective range the one of the velocity field with fully analogous spatio-temporal correlations, including the non-universal prefactors. In the case of the white-in-time Kraichnan model, the temporal decay of the scalar correlations is purely exponential in
 $p^{2} t$, but a Gaussian regime opens up at small time delays when introducing a finite time correlation in the velocity covariance.
The FRG results can be compared with DNS, which allows one in particular to quantify the precise range of validity of the ‘large wavenumber limit’ which underlies the FRG calculations. Several DNS have been conducted both for NS turbulence and passive scalar turbulence with the different models for the advecting velocity field. They brought a thorough and accurate confirmation of the FRG predictions in the small-time regime, including high-precision tests in the case of the Kraichnan model. In contrast, the large-time regime has remained elusive in most DNS, due to the steepness of the Gaussian regime, which leads to a fast damping of the correlations to near-zero levels and renders very challenging its numerical detection. The cross-over has been evidenced in the time-correlated synthetic velocity field, because in this case, the different time scales are more easily adjustable in order to reach the large-time exponential decay before the signal gets too low and indiscernible from numerical noise. Although challenging, it would be very interesting to push further the DNS investigations in order to access and study the large-time regime for the NS flow. Another direction which remains unexplored so far is to test in DNS the FRG predictions for 2-D turbulence, for which explicit expressions for the spatio-temporal correlations at large wavenumbers are also available (Tarpin et al. Reference Tarpin, Canet, Pagani and Wschebor2019).
The temporal behaviour of the  $n$-point correlation functions are obtained within FRG from the leading term in the large wavenumber expansion of the flow equations. Although this leading term is exact at large
 $p$, it vanishes at coinciding times
 $t=0$, such that it does not carry any information on the structure functions, and in particular on their possible anomalous exponents. Another route in the quest for the intermittency corrections is thus to compute within the large wavenumber expansion, the first non-vanishing term at equal times. Preliminary results were obtained in this direction for 2-D turbulence (Tarpin et al. Reference Tarpin, Canet, Pagani and Wschebor2019), but it remains to be completed and extended to study 3-D turbulence.
The calculation of intermittency corrections within the FRG framework is clearly the next challenge to be addressed and probably the most significant, and recent results (Fontaine et al. Reference Fontaine, Tarpin, Bouchet and Canet2022) already pave the way for this quest. However, another promising line of research is the use of FRG in turbulence modelling. The FRG is designed by essence to construct a sequence of scale-dependent effective descriptions of a given system from the microscopic scale to the macroscopic one. In particular, if stopped at any chosen scale, the FRG flow provides the effective model at that scale, including the effect of fluctuations on all smaller (distance) scales (larger wavenumbers). As mentioned in the introduction, computing such effective models from the fundamental equations, e.g. NS equations, via a controlled procedure of integration of fluctuations would be very valuable in many applications. Probably the most relevant one is to improve current models used as a ‘sub-grid’ description – that is model for the non-resolved scales – in many numerical schemes, such as large eddies simulations, meteorological or climate models. Of course, a long path lies before arriving at competitive results, since one should first extend the FRG framework to describe more realistic situations, such as non-homogeneous, or anisotropic, or non-stationary conditions, the presence of shear, fluxes at the boundaries, etc. $\ldots$ Nonetheless, we believe that this path is worth exploring, and should be the subject of future efforts.
Acknowledgements
L.C. would like to sincerely thank all her collaborators involved in the works presented here, whose implication was essential to obtain all these results. She thanks in particular B. Delamotte and N. Wschebor, with whom the FRG approach to turbulence was initiated, and largely developed. She is also grateful to G. Balarac for all the work with DNS, and G. Eyink and V. Rossetto, who greatly contributed in analysing the data and the results of DNS and experiments. Her special and warm thanks go to the PhD students, A. Gorbunova and M. Tarpin, and postdoc C. Pagani, whose contributions were absolutely pivotal in FRG and DNS works. L.C. would also like to thank M. Bourgoin, N. Mordant, B. Dubrulle and her team for their great help with experimental data.
Funding
This work was supported by the Agence Nationale pour la Recherche (grant ANR-18-CE92-0019 NeqFluids) and by the Institut Universitaire de France.
Declaration of interests
The author reports no conflict of interest.
Appendix A. Additional extended symmetries and Ward identities
A.1. Local shift symmetries of the pressure fields
An evident symmetry of the NS action (3.22) is the invariance under a time-dependent shift of the pressure field  ${\rm \pi} (t,\boldsymbol {x})\to {\rm \pi}(t,\boldsymbol {x})+\varepsilon (t)$ since the latter only appears with a gradient. Let us now consider instead an infinitesimal time- and space-dependent shift
 ${\rm \pi} (t,\boldsymbol {x})\to {\rm \pi}(t,\boldsymbol {x})+\varepsilon (t,\boldsymbol {x})$. This field transformation yields a variation of
 ${\mathcal {S}}_{NS}$ which is linear in
 $\bar {\boldsymbol {v}}$. Since the field transformation is simply a change of variables in the functional integral (3.21), it must leave it unchanged. One deduces to first order in
 $\varepsilon$ the equality
 \begin{equation} 0= \int_{t,\boldsymbol{x}} \left\langle -\bar {{v}}_\alpha(t,\boldsymbol{x}) \partial_\alpha \varepsilon(t,\boldsymbol{x}) + K(t,\boldsymbol{x})\varepsilon(t,\boldsymbol{x})\right\rangle , \end{equation}
where the first term comes from the variation of the action and the second one from the variation of the source term. Since this equality holds for any arbitrary infinitesimal  $\varepsilon (t,\boldsymbol {x})$, one deduces the following Ward identity:
 \begin{equation} \frac{\delta \varGamma}{\delta \langle {\rm \pi}(t,\boldsymbol{x})\rangle}\equiv K(t,\boldsymbol{x}) ={-}\frac{1}{\rho} \left\langle \partial_\alpha \bar{v}_\alpha(t,\boldsymbol{x})\right\rangle =\frac{\delta {\mathcal{S}}_{NS}}{\delta {\rm \pi}(t,\boldsymbol{x})}\Big|_{\langle\varPhi_k\rangle} , \end{equation}
where the first equality simply stems from the Legendre conjugate relations (3.16a,b), the second from the relation (A1) and the third can be deduced from the NS action (3.22). This entails that the dependence of the effective action  $\varGamma$ in the pressure field
 ${\rm \pi}$ remains the same as the one of the original action
 ${\mathcal {S}}_{NS}$, i.e. it keeps the same form in terms of the average fields
 $(1/\rho ) \int _{t,\boldsymbol {x}} \langle \bar v\rangle _\alpha \partial _\alpha \langle {\rm \pi}\rangle$, or otherwise stated, this term is not renormalised – it is not modified by the fluctuations.
The same analysis can be carried over for the response pressure field, by considering the infinitesimal field transformation  $\bar {\rm \pi}(t,\boldsymbol {x})\to \bar {\rm \pi}(t,\boldsymbol {x})+\bar \varepsilon (t,\boldsymbol {x})$. This yields the Ward identity
 \begin{equation} \frac{\delta \varGamma}{\delta\langle \bar {\rm \pi}(t,\boldsymbol{x})\rangle} \equiv \bar K(t,\boldsymbol{x}) = \left\langle\partial_\alpha {{v}}_\alpha(t,\boldsymbol{x}) \right\rangle= \left.\frac{\delta {\mathcal{S}}_{NS}}{\delta \bar {\rm \pi}(t,\boldsymbol{x})}\right|_{\langle\varPhi_k\rangle}, \end{equation}
which means that the corresponding term in the effective action is not renormalised either and keeps its original form 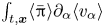 $\int _{t,\boldsymbol {x}} \langle \bar {\rm \pi}\rangle \partial _\alpha \langle {{v}}_\alpha \rangle$. Hence, the effective action remains linear in the pressure and response pressure fields, and there are no mixed pressure–velocity vertices beyond quadratic order, i.e. no vertices for
 $n\geq 3$ with a
 $p$ or a
 $\bar p$ leg. As a consequence, the pressure fields only enter in the propagator, and the whole pressure sector essentially decouples, as will be manifest in the FRG framework.
Since the pressure fields are not renormalised, we have used throughout the paper the same notation  ${\rm \pi}$ for both the pressure and the average pressure, and similarly
 $\bar {{\rm \pi} }$ for both the response pressure and its average. This is of course not the case for the velocity sector which contains non-trivial fluctuations, and we have used different notations
 $\boldsymbol {u} \equiv \langle \boldsymbol {v}\rangle$ and
 $\bar {\boldsymbol {u}} \equiv \langle \bar {\boldsymbol {v}}\rangle$ for the fields and average fields.
A.2. Extended symmetries for the passive scalar fields
Let us now consider the symmetries and extended symmetries of the passive scalar action (3.24). This action possesses two extended symmetries related to time-dependent shifts of the scalar field:  $\theta (t,\boldsymbol {x})\to \theta (t,\boldsymbol {x}) +\varepsilon (t)$ and the joint transformation for the response field
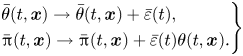 \begin{equation} \left. \begin{aligned} & \bar\theta(t,\boldsymbol{x})\to \bar\theta(t,\boldsymbol{x}) +\bar \varepsilon(t),\\ & \bar {\rm \pi}(t,\boldsymbol{x}) \to \bar {\rm \pi}(t,\boldsymbol{x}) + \bar \varepsilon(t)\theta(t,\boldsymbol{x}) . \end{aligned} \right\} \end{equation}
Each of these transformations leads to a variation of the action which is linear in the fields. The corresponding functional Ward identities are straightforward to derive and read, respectively, (Pagani & Canet Reference Pagani and Canet2021)
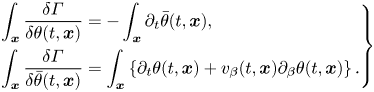 \begin{equation} \left. \begin{aligned} & \int_{\boldsymbol{x}} \frac{\delta \varGamma}{\delta \theta(t,\boldsymbol{x})} ={-}\int_{\boldsymbol{x}}\partial_t\bar\theta(t,\boldsymbol{x}) ,\\ & \int_{\boldsymbol{x}} \frac{\delta \varGamma}{\delta \bar \theta(t,\boldsymbol{x})} = \int_{\boldsymbol{x}} \left\{\partial_t\theta(t,\boldsymbol{x})+{{v}}_\beta(t,\boldsymbol{x})\partial_\beta \theta(t,\boldsymbol{x}) \right\} . \end{aligned} \right\} \end{equation}
These identities imply that the two terms  $\int \bar \theta \partial _t\theta$ and
 $\int \bar \theta {{v}}_\beta \partial _\beta \theta$ are not renormalised, and they entail that any vertex with one vanishing wavevector carried either by a
 $\theta$ or a
 $\bar \theta$ field vanishes – except for
 $\varGamma ^{\theta \bar \theta }$ which keeps its original form given by
 ${\mathcal {S}}^{\theta \bar \theta }$ – i.e.
 \begin{equation} \left. \begin{aligned} & \varGamma^{(n_v,n_{\bar v}, n_\theta\geq 1, n_{\bar\theta})}(\cdots, \omega_\theta,\boldsymbol{p}_\theta=0,\ldots) = 0,\\ & \varGamma^{(n_v,n_{\bar v}, n_\theta, n_{\bar\theta}\geq 1)}(\cdots, \omega_{\bar\theta},\boldsymbol{p}_{\bar \theta}=0,\ldots) = 0,\\ & \varGamma^{(0,0,1, 1)}(\omega_\theta,\boldsymbol{p}_\theta=\boldsymbol{0},\omega_{\bar\theta},\boldsymbol{p}_{\bar\theta}) = {\rm i}\omega_\theta\;(2{\rm \pi})^{d+1}\delta(\omega_\theta+\omega_{\bar\theta})\delta^{d}(\boldsymbol{p}_\theta+\boldsymbol{p}_{\bar\theta}). \end{aligned} \right\} \end{equation}
These identities are very similar to (3.35) and (3.36) ensuing from the time-gauged shift of the response fields.
Moreover, the time-dependent Galilean symmetry is also an extended symmetry of the total action  ${\mathcal {S}}_{NS}+{\mathcal {S}}_{\theta }$. Indeed, the passive scalar and its response field behave as Galilean scalar densities under time-dependent Galilean transformations (3.25), i.e.
 $\delta \theta (t,\boldsymbol {x}) = \varepsilon _\beta (t) \partial _\beta \theta (t,\boldsymbol {x})$ and
 $\delta \bar \theta (t,\boldsymbol {x}) = \varepsilon _\beta (t) \partial _\beta \bar \theta (t,\boldsymbol {x})$, which yield a variation of the total action linear in the field. The associated Ward identity constrains the vertices for which one of the velocities has a zero wavevector
 \begin{align} \varGamma_{\alpha_{1}\cdots\alpha_{n_{v}+n_{\bar{v}}+1}}^{\left(n_{v}+1,n_{\bar v},n_{\theta},n_{\bar{\theta}}\right)}\left(\cdots,\underbrace{\omega_\ell,\boldsymbol{p}_\ell=0}_{\ell={\rm velocity\ \;index}},\ldots\right) &={-}\sum_{i=1}^{n}\frac{p_{i}^{\alpha_\ell}}{\omega_\ell}\varGamma_{\alpha_{1}\cdots\alpha_{n_{v}+n_{\bar{v}}}}^{\left(n_v,n_{\bar v},n_{\theta},n_{\bar{\theta}}\right)}\left(\cdots,\underbrace{\omega_{i}+\omega_\ell,\boldsymbol{p}_{i}}_{i^{{\rm th}}{\rm field}},\ldots\right),\nonumber\\ &= {\mathcal{D}}_{\alpha_\ell}(\omega_\ell)\varGamma_{\alpha_{1}\cdots\alpha_{n_{v}+n_{\bar{v}}}}^{\left(n_v,n_{\bar v},n_{\theta},n_{\bar{\theta}}\right)}\left(\cdots, \omega_i, \boldsymbol{p}_i, \ldots\right), \end{align}
where  $\alpha _{1}\cdots \alpha _{n_{v}+n_{\bar {v}}+1}$ are the spatial indices of the velocity (and response velocity) fields,
 $n=n_{\theta }+n_{\bar {\theta }}+n_{v}+n_{\bar v}$ and
 ${\mathcal {D}}_\alpha$ is the same operator as in (3.31).
To summarise, the key point is that the Ward identities for the scalar advected by the NS flow share essentially the same structure as the ones for the NS action. They have a strong implication: when at least one wavevector of any vertex is set to zero, then it vanishes, except if the wavevector is carried by a velocity field, in which case it is controlled by (3.31) or (A7), i.e. given in terms of a linear combination of lower-order vertices through the operator  ${\mathcal {D}}_\alpha$. This constitutes the cornerstone of the large wavenumber closure expounded in § 7.2.
Appendix B. Flow equations in the LO approximation
We report in this appendix additional details on the derivation of the flow equations for NS, within the LO approximation presented in § 6, for the functions  $f_{\kappa,\perp }^{\nu }$ and
 $f_{\kappa,\perp }^{D}$, and their explicit expressions. We refer to Canet et al. (Reference Canet, Delamotte and Wschebor2016) for the full derivation.
From the general form of the effective average action and of the regulator term  $\Delta {\mathcal {S}}_\kappa$, one can infer the general structure of the propagator matrix, defined as the inverse of the Hessian of
 $\varGamma _\kappa + \Delta {\mathcal {S}}_\kappa$. It is more conveniently expressed in Fourier space where it is diagonal in wavevector and frequency, such that it is just the inverse of a matrix
 \begin{equation} \bar G_\kappa(\omega,\boldsymbol{p}) = [\bar \varGamma_\kappa^{(2)} +{\mathcal{R}}_\kappa ]^{{-}1}(\omega,\boldsymbol{p}). \end{equation}
As usual, because of rotational and parity invariance, any generic two-(space) index function (in Fourier space)  $F_{\alpha \beta }(\omega,\boldsymbol {p})$ can be decomposed into a longitudinal and a transverse part as
 $F_{\alpha \beta }(\omega,\boldsymbol {p}) = F_{\parallel }(\omega,\boldsymbol {p})P_{\alpha \beta }^{\parallel }(\boldsymbol {p}) + F_{\perp }(\omega,\boldsymbol {p})P_{\alpha \beta }^{\perp }(\boldsymbol {p})$ where the transverse and longitudinal projectors are defined by
 \begin{equation} P_{\alpha\beta}^{{\perp}}(\boldsymbol{p})=\delta_{\alpha\beta}-\frac{p_\alpha p_\beta}{\boldsymbol{p}^{2}}, \quad\mathrm{and}\quad P_{\alpha\beta}^{{\parallel}}(\boldsymbol{p})=\frac{p_\alpha p_\beta}{\boldsymbol{p}^{2}}. \end{equation}
Inverting the matrix  $[\bar \varGamma _\kappa ^{(2)} +{\mathcal {R}}_\kappa ]$, one obtains the general propagator
 \begin{equation} \bar G_{\kappa,\alpha\beta}(\omega,\boldsymbol{p})= \eqalign{u_\alpha \cr \bar u_\alpha \cr {\rm \pi}\cr \bar {\rm \pi}} \left(\matrix{u_\beta & \bar u_\beta & {\rm \pi}& \bar {\rm \pi}\cr \bar G^{u u}_{\kappa,\alpha\beta}(\omega,\boldsymbol{p}) &\bar G^{u \bar u}_{\kappa,\alpha\beta}(\omega,\boldsymbol{p}) & 0 & i p_\alpha \bar G_\kappa^{u\bar {\rm \pi}}(\omega,\boldsymbol{p}) \cr \bar G^{u \bar u}_{\kappa,\alpha\beta}(-\omega,\boldsymbol{p}) & 0 & i p_\alpha \bar G_\kappa^{\bar u {\rm \pi}}(\omega,\boldsymbol{p}) & 0 \cr 0& -i p_\beta \bar G_\kappa^{\bar u {\rm \pi}}(-\omega,\boldsymbol{p}) & \bar G_\kappa^{{\rm \pi} {\rm \pi}}(\omega,\boldsymbol{p}) & \bar G_\kappa^{{\rm \pi} \bar {\rm \pi}}(\omega,\boldsymbol{p})\cr -i p_\beta\bar G_\kappa^{u\bar {\rm \pi}}(-\omega,\boldsymbol{p})& 0 & \bar G_\kappa^{{\rm \pi}\bar {\rm \pi}}(-\omega,\boldsymbol{p}) & 0}\right), \end{equation}
with, in the pressure sector,
 \begin{equation} \bar G_\kappa^{{\rm \pi} {\rm \pi}}(\omega,\boldsymbol{p})={-}\frac {\rho} {p^{2}}\bar \varGamma^{(0,2)}_{\kappa,\parallel}(\omega,\boldsymbol{p}),\quad \bar G_\kappa^{{\rm \pi} \bar {\rm \pi}}(\omega,\boldsymbol{p})=\frac{\rho}{p^{2}}\bar \varGamma_{\kappa,\parallel}^{(1,1)}(-\omega,\boldsymbol{p}) , \end{equation}
and in the mixed velocity–pressure sector
 \begin{equation} \bar G_\kappa^{u \bar {\rm \pi}}(\omega,\boldsymbol{p}) ={-}\frac 1 {p^{2}} ,\quad \bar G_\kappa^{\bar u {\rm \pi}}(\omega,\boldsymbol{p})=\frac \rho {p^{2}}. \end{equation}
Furthermore, the components of the propagator in the velocity sector are purely transverse (that is, all the longitudinal parts vanish), as a consequence of incompressibility, and given by
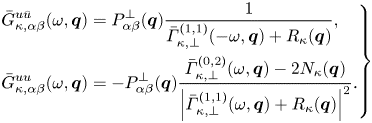 \begin{equation} \left. \begin{aligned} \bar G^{u \bar u}_{\kappa,\alpha\beta}(\omega, \boldsymbol{q}) & = P_{\alpha\beta}^{{\perp}}(\boldsymbol{q}) \frac{1}{\bar \varGamma^{(1,1)}_{\kappa,\perp}(-\omega, \boldsymbol{q}) + R_\kappa(\boldsymbol{q})},\\ \bar G^{u u}_{\kappa,\alpha\beta}(\omega, \boldsymbol{q}) & ={-}P_{\alpha\beta}^{{\perp}}(\boldsymbol{q}) \frac{\bar \varGamma^{(0,2)}_{\kappa,\perp}(\omega, \boldsymbol{q}) -2 N_\kappa(\boldsymbol{q})}{\left|\bar \varGamma^{(1,1)}_{\kappa,\perp}(\omega, \boldsymbol{q})+R_\kappa(\boldsymbol{q})\right|^{2}}. \end{aligned} \right\} \end{equation}
One can then insert the expression (B3) into (5.5), and compute the matrix product and trace to obtain the flow of  $\bar \varGamma _\kappa ^{(2)}$. Within the LO approximation, only the vertex
 $\bar \varGamma _\kappa ^{(2,1)}$ remains and is given by (6.8), such that in (5.5), one may set
 $\bar \varGamma _\kappa ^{(4)}=0$, and only a few elements are non-zero in the matrices
 $\bar \varGamma _{\kappa,\ell }^{(3)}$.
According to the expressions (6.7) for  $\bar \varGamma _{\kappa,\alpha \beta }^{(0,2)}$ and
 $\bar \varGamma _{\kappa,\alpha \beta }^{(1,1)}$, the flow equations of the transverse functions
 $f_{\kappa,\perp }^{D}$ and
 $f_{\kappa,\perp }^{\nu }$ may be defined as
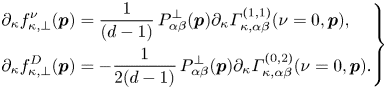 \begin{equation} \left. \begin{aligned} \partial_\kappa f_{\kappa,\perp}^{\nu}(\boldsymbol{p}) & = \frac{1}{(d-1)}\, P_{\alpha\beta}^{{\perp}}(\boldsymbol{p}) \partial_\kappa \varGamma^{(1,1)}_{\kappa,\alpha\beta}(\nu=0,\boldsymbol{p}),\\ \partial_\kappa f_{\kappa,\perp}^{D}(\boldsymbol{p}) & ={-}\frac{1}{2(d-1)} \,P_{\alpha\beta}^{{\perp}}(\boldsymbol{p})\partial_\kappa \varGamma^{(0,2)}_{\kappa,\alpha\beta}(\nu=0,\boldsymbol{p}) . \end{aligned} \right\} \end{equation}
After some calculations (Canet et al. Reference Canet, Delamotte and Wschebor2016), one deduces the following flow equations
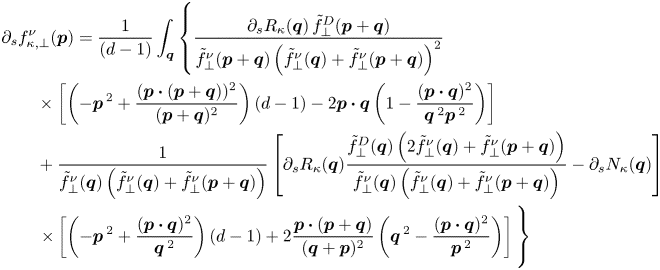 \begin{align} &\partial_s f_{\kappa,\perp}^{\nu}(\boldsymbol{p})= \frac{1}{(d-1)}\int_{\boldsymbol{q}}\left\{\frac{\partial_s R_\kappa(\boldsymbol{q}) \,\tilde{f}_\perp^{D}(\boldsymbol{p}+\boldsymbol{q})}{ \tilde{f}_\perp^{\nu}(\boldsymbol{p} +\boldsymbol{q}) \left(\tilde{f}_\perp^{\nu}(\boldsymbol{q}) + \tilde{f}_\perp^{\nu}(\boldsymbol{p}+\boldsymbol{q})\right)^{2}}\right.\nonumber\\ &\qquad\times \left[\left(-\boldsymbol{p}\,^{2}+\frac{(\boldsymbol{p} \boldsymbol{\cdot} (\boldsymbol{p}+\boldsymbol{q}))^{2}}{(\boldsymbol{p}+\boldsymbol{q})^{2}}\right)(d-1)-2 \boldsymbol{p}\boldsymbol{\cdot} \boldsymbol{q}\left(1-\frac{(\boldsymbol{p}\boldsymbol{\cdot} \boldsymbol{q})^{2}}{\boldsymbol{q}\,^{2} \boldsymbol{p}\,^{2}}\right) \right]\nonumber\\ &\qquad+ \frac{1}{\tilde{f}_\perp^{\nu}(\boldsymbol{q}) \left( \tilde{f}_\perp^{\nu}(\boldsymbol{q}) + \tilde{f}_\perp^{\nu}(\boldsymbol{p}+\boldsymbol{q})\right)} \left[ \partial_s R_\kappa(\boldsymbol{q}) \frac{ \tilde{f}_\perp^{D}(\boldsymbol{q})\left(2 \tilde{f}_\perp^{\nu}(\boldsymbol{q}) + \tilde{f}_\perp^{\nu}(\boldsymbol{p}+\boldsymbol{q})\right)}{\tilde{f}_\perp^{\nu}(\boldsymbol{q}) \left( \tilde{f}_\perp^{\nu}(\boldsymbol{q}) + \tilde{f}_\perp^{\nu}(\boldsymbol{p}+\boldsymbol{q})\right)}- \partial_s N_\kappa(\boldsymbol{q})\right]\nonumber\\ &\left.\qquad\times \left[\left(-\boldsymbol{p}\,^{2}+\frac{(\boldsymbol{p} \boldsymbol{\cdot} \boldsymbol{q})^{2}}{\boldsymbol{q}\,^{2}}\right)(d-1)+2 \frac{\boldsymbol{p}\boldsymbol{\cdot} (\boldsymbol{p}+\boldsymbol{q})}{(\boldsymbol{q}+\boldsymbol{p})^{2}}\left(\boldsymbol{q}\,^{2}-\frac{(\boldsymbol{p}\boldsymbol{\cdot} \boldsymbol{q})^{2}}{\boldsymbol{p}\,^{2}}\right) \right]\vphantom{\frac{2 \tilde{f}_\perp^{D}(\boldsymbol{q}+\boldsymbol{p})}{\tilde{f}_\perp^{\nu}(\boldsymbol{p}+\boldsymbol{q}) \tilde{f}_\perp^{\nu}(\boldsymbol{q})\left( \tilde{f}_\perp^{\nu}(\boldsymbol{q}) + \tilde{f}_\perp^{\nu}(\boldsymbol{p}+\boldsymbol{q})\right)}}\right\} \end{align}
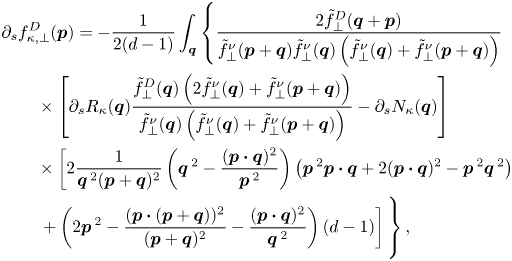 \begin{align} &\partial_s f_{\kappa,\perp}^{D}(\boldsymbol{p}) ={-}\frac{1}{2(d-1)}\int_{\boldsymbol{q}} \left\{ \frac{2 \tilde{f}_\perp^{D}(\boldsymbol{q}+\boldsymbol{p})}{\tilde{f}_\perp^{\nu}(\boldsymbol{p}+\boldsymbol{q}) \tilde{f}_\perp^{\nu}(\boldsymbol{q})\left( \tilde{f}_\perp^{\nu}(\boldsymbol{q}) + \tilde{f}_\perp^{\nu}(\boldsymbol{p}+\boldsymbol{q})\right)}\right.\nonumber\\ &\qquad\times \left[ \partial_s R_\kappa(\boldsymbol{q}) \frac{\tilde{f}_\perp^{D}(\boldsymbol{q})\left(2 \tilde{f}_\perp^{\nu}(\boldsymbol{q}) + \tilde{f}_\perp^{\nu}(\boldsymbol{p}+\boldsymbol{q})\right) }{\tilde{f}_\perp^{\nu}(\boldsymbol{q})\left( \tilde{f}_\perp^{\nu}(\boldsymbol{q}) + \tilde{f}_\perp^{\nu}(\boldsymbol{p}+\boldsymbol{q})\right) }- \partial_s N_\kappa(\boldsymbol{q})\right]\nonumber\\ &\qquad \times\left[2 \frac{1}{\boldsymbol{q}\,^{2} (\boldsymbol{p}+\boldsymbol{q})^{2}}\left(\boldsymbol{q}\,^{2}-\frac{(\boldsymbol{p}\boldsymbol{\cdot} \boldsymbol{q})^{2}}{\boldsymbol{p}\,^{2}}\right) \left(\boldsymbol{p}\,^{2} \boldsymbol{p}\boldsymbol{\cdot} \boldsymbol{q}+2 (\boldsymbol{p}\boldsymbol{\cdot} \boldsymbol{q})^{2}-\boldsymbol{p}\,^{2} \boldsymbol{q}\,^{2}\right)\right.\nonumber\\ &\left.\left.\qquad + \left(2\boldsymbol{p}\,^{2}-\frac{(\boldsymbol{p} \boldsymbol{\cdot} (\boldsymbol{p}+\boldsymbol{q}))^{2}}{(\boldsymbol{p}+\boldsymbol{q})^{2}}-\frac{(\boldsymbol{p} \boldsymbol{\cdot} \boldsymbol{q})^{2}}{\boldsymbol{q}\,^{2}}\right)(d-1)\right]\vphantom{\frac{2 \tilde{f}_\perp^{D}(\boldsymbol{q}+\boldsymbol{p})}{\tilde{f}_\perp^{\nu}(\boldsymbol{p}+\boldsymbol{q}) \tilde{f}_\perp^{\nu}(\boldsymbol{q})\left( \tilde{f}_\perp^{\nu}(\boldsymbol{q}) + \tilde{f}_\perp^{\nu}(\boldsymbol{p}+\boldsymbol{q})\right)}}\right\}, \end{align}
where  $\partial _s\equiv \kappa \partial _\kappa$,
 $\tilde {f}_\perp ^{\nu }(\boldsymbol {p})\equiv f_{\kappa,\perp }^{\nu }(\boldsymbol {p})+ R_\kappa (\boldsymbol {q})$ and
 $\tilde {f}_\perp ^{D}(\boldsymbol {p})\equiv f_{\kappa,\perp }^{D}(\boldsymbol {p})+ N_\kappa (\boldsymbol {q})$. Note that a typo has been corrected in the last line of (B9) compared with Canet et al. (Reference Canet, Delamotte and Wschebor2016).
Appendix C. Next-to-leading-order term in the 2-D NS equation
The large wavenumber expansion underlying the derivation of (7.7) is inspired by the BMW approximation scheme. This scheme can be in principle improved order by order. There are two possible strategies to achieve this. The first one is to increase the order at which the closure using the BMW expansion is performed. Let us consider for instance the flow equation for the two-point function  $\varGamma _\kappa ^{(2)}$. At leading order, the three- and four-point vertices entering this equation are expanded around
 $\boldsymbol {q}=0$. At the next-to-leading order, one keeps the full vertices in the flow equation for
 $\varGamma _\kappa ^{(2)}$, and perform the
 $\boldsymbol {q}=0$ expansion for the higher-order vertices entering the flow equations of
 $\varGamma _\kappa ^{(3)}$ and
 $\varGamma _\kappa ^{(4)}$, and so on. An alternative way to improve the BMW approximation scheme is to include higher-order terms in the Taylor expansion of the vertices for a given order
 $n$, e.g.
 $$\begin{gather} \left.\varGamma^{(n)}_\kappa(\omega,\boldsymbol{q},\varpi_1,\boldsymbol{p}_1,\ldots) \stackrel{\boldsymbol{q}\simeq 0}{\simeq} \varGamma^{(n)}_\kappa(\omega,0,\varpi_1,\boldsymbol{p}_1,\ldots) +\frac{\partial}{\partial \boldsymbol{q}} \varGamma^{(n)}_\kappa(\omega,\boldsymbol{q},\varpi_1,\boldsymbol{p}_1,\ldots)\right|_{\boldsymbol{q}=0} \nonumber\\ \left.+\frac{1}{2} \frac{\partial^{2}}{\partial \boldsymbol{q}^{2}}\varGamma^{(n)}_\kappa(\omega,\boldsymbol{q},\varpi_1,\boldsymbol{p}_1,\ldots)\right|_{\boldsymbol{q}=0} . \end{gather}$$
This second strategy has been implemented to study 2-D turbulence in Tarpin et al. (Reference Tarpin, Canet, Pagani and Wschebor2019). The reason for focusing on 2-D rather than 3-D turbulence is that the 2-D NS action possesses additional symmetries, which can be used to control exactly the derivatives of vertices at  $\boldsymbol {q}=0$.
In two dimensions, the incompressibility constraint allows one to express the velocity field as the curl of a pseudo-scalar field  $\psi (t,\boldsymbol {x})$ called the streamfunction
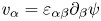 ${{v}}_\alpha = \varepsilon _{\alpha \beta } \partial _\beta \psi$. Formulating the action in term of the streamfunction allows one to simply integrate out the pressure fields, yielding
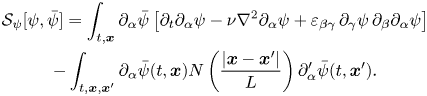 $$\begin{gather} \mathcal{S}_{\psi}[\psi, \bar \psi] = \int_{t,\boldsymbol{x}} \partial_\alpha \bar \psi \left[ \partial_t \partial_\alpha \psi - \nu \nabla^{2} \partial_\alpha \psi +\varepsilon_{\beta\gamma} \,\partial_\gamma \psi \,\partial_\beta \partial_\alpha \psi \right] \nonumber\\ -\int_{t,\boldsymbol{x},\boldsymbol{x}'} \partial_\alpha \bar\psi(t, \boldsymbol{x}) N\left(\frac{|\boldsymbol{x}-\boldsymbol{x}'|}{L}\right) \partial_\alpha' \bar \psi (t, \boldsymbol{x}'). \end{gather}$$
This action possesses all the extended symmetries discussed in § 3.3. In particular, the Galilean transformation reads in this formulation
 \begin{equation} \delta\psi = \varepsilon_{\alpha\beta} x_\alpha \dot\eta_\beta(t) + \eta_\alpha(t)\partial_\alpha \psi, \quad \delta\bar\psi =\eta_\alpha(t)\partial_\alpha \bar\psi , \end{equation}
and the time-gauged shift of the response fields now simply amounts to the transformation
 \begin{equation} \delta\psi = 0, \quad \delta\bar\psi = x_\alpha \bar\eta_\alpha(t), \end{equation}
where  $\boldsymbol {\eta }$,
 $\bar {\boldsymbol {\eta }}$ are the time-dependent parameters of the transformations. Note that these transformations are linear in
 $x$. Thus, in Fourier space, this leads to Ward identity constraining the first derivative of a vertex at one vanishing wavevector. If the zero wavevector is carried by a response stream, one deduces from (C4) the following Ward identity
 \begin{equation} \frac{\partial}{\partial q_{m+1}^{\alpha}} \varGamma_\kappa^{(m,n)}(\cdots,\varpi_{m+1},\boldsymbol{q}_{m+1},\ldots)\Big|_{\boldsymbol{q}_{m+1}=0} = 0. \end{equation}
which is equivalent to (3.34) in terms of the velocity. Similarly, if the zero wavevector is carried by a stream field, the time-gauged Galilean transformation (C3a,b) yields a Ward identity, equivalent to (3.34), which exactly fixes the  $\partial _q$ derivative of this vertex in the stream formulation.
One can study the action (C2) within the FRG formalism. It is clear that the same closure can be achieved in the limit of large wavenumber. In the stream formulation, the zeroth order in the large wavenumber expansion is trivial. This just reflects the fact that the stream and response streamfunctions are defined up to a constant function of time, and the functional integral does not fix this gauge invariance, such that the zeroth order carries no information. One thus has to consider the next term (first  $\boldsymbol {q}$ derivative) in the Taylor expansion of the vertices, which are precisely the ones fixed by the Ward identities. One thus obtains the exact same result as (7.7) expressed in term of the streamfunction. One can derive from it in a similar way the expression of the time dependence for generic
 $n$-point correlation functions in 2-D turbulence. Note that they bare a different form than in three dimensions, due to the different scaling exponents (in particular
 $z$). Contrary to the 3-D case, this result has not been tested yet in direct numerical simulations.
As in three dimensions, the leading-order term in the limit of large wavenumber vanishes at equal times, such than one is left with power laws in wavenumbers with exponents stemming from standard scale invariance (Kraichnan–Leith scaling). However, additional extended symmetries were unveiled for the 2-D action, which can be exploited to compute the next-to-leading-order term (given by the second line of (C1)). At equal times, i.e. integrated over all external frequencies, this term writes
 \begin{align} &\left.\partial_s \int_{\varpi_\ell}{\mathcal{W}}^{(n)}_\kappa\right|_{next\text{-}to\text{-}leading} ={-}\frac{1}{2}\int_{\omega_1,\boldsymbol{q}_1,\omega_2,\boldsymbol{q}_2} H_{\kappa,\gamma\delta}\left(-\omega_1,-\boldsymbol{q}_1,-\omega_2,-\boldsymbol{q}_2\right)\nonumber\\ &\left.\qquad \times \int_{\varpi_\ell}\left[\frac{q_a^{\mu} q_b^{\nu} q_c^{\rho} q_d^{\sigma}}{4!}\frac{\partial^{2}}{\partial q_a^{\mu} \partial q_b^{\nu} \partial q_c^{\rho} \partial q_d^{\sigma}}\frac{\delta}{\delta u_{\gamma}\left(\omega_1,\boldsymbol{q}_1\right)}\frac{\delta}{\delta u_{\delta}\left(\omega_2,\boldsymbol{q}_2\right)}{\mathcal{W}}^{\left(n\right)}_{\kappa} \right]\right|_{\boldsymbol{q}_1=\boldsymbol{q}_2=0} , \end{align}
where  $a,b,c,d$ take values in
 $\{1,2\}$, and we have not used explicitly translational invariance so that the
 $\boldsymbol {q}$ derivatives can be expressed unambiguously. One can show that the only non-vanishing contributions are the ones with two
 $q_1$ and two
 $q_2$. The contributions with four
 $q_1$ vanish when evaluated at
 $\boldsymbol {q}_2=0$ because of the extended symmetry, while the ones with three
 $q_1$ and one
 $q_2$ are proportional to a
 ${\mathcal {D}}_\mu$ operator and vanish when integrated over frequencies. To go further requires us to control second derivatives of vertices. This can partially be achieved in two dimensions because the field theory (C2) exhibits two additional extended symmetries, which correspond to transformations quadratic in
 $x$, and thus yield Ward identities for the second
 $\boldsymbol {q}$ derivative of vertices in Fourier space.
The first new symmetry is a quadratic in the  $x$ shift of the response fields, following
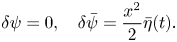 \begin{equation} \delta\psi = 0, \quad \delta\bar\psi =\frac{x^{2}}{2}\bar\eta(t) . \end{equation}
One deduces the following Ward identity for second derivatives of a vertex function evaluated at a vanishing wavenumber carried by a response field:
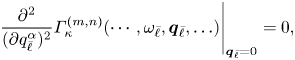 \begin{equation} \left.\frac{\partial^{2}}{(\partial q_{\bar\ell}^{\alpha})^{2}} \varGamma_\kappa^{(m,n)}(\cdots,\omega_{\bar\ell},\boldsymbol{q}_{\bar\ell},\ldots)\right|_{\boldsymbol{q}_{\bar\ell}=0} = 0, \end{equation}
where  $\bar \ell$ is a response field index. Remarkably, the transformation (C7a,b), which reads in the velocity formulation
 \begin{equation} \delta \bar {{v}}_\alpha = \varepsilon_{\alpha\beta\gamma} x_\beta \eta_\gamma(t),\quad \delta \bar {\rm \pi}= {{v}}_\alpha \varepsilon_{\alpha\beta\gamma} x_\beta \eta_\gamma(t), \end{equation}
is also an extended symmetry of the 3-D NS equation, but it has not been exploited yet.
In analogy with the extended Galilean transformation, which can be interpreted as a time-dependent generalisation of space translations, one can write the time-dependent extension of space rotations, which reads in the stream formulation
 \begin{equation} \delta\psi ={-}\dot\eta(t)\frac{x^{2}}{2}+\eta(t)\varepsilon_{\alpha\beta}x_\beta\partial_\alpha\psi , \quad \delta\bar\psi =\eta(t)\varepsilon_{\alpha\beta}x_\beta\partial_\alpha \bar\psi. \end{equation}
This transformation leads to a new extended symmetry of the 2-D action, while it is not an extended symmetry of the 3-D one. It is interesting to notice that time-dependent rotations are also an extended symmetry of the action corresponding to the Kraichnan model in any spatial dimension. As this transformation is also quadratic in  $x$, it leads as well to a Ward identity for the second
 $\boldsymbol {q}$ derivative of a vertex in Fourier space, this time when the
 $\boldsymbol {q}$ wavevector is carried by the field itself
 \begin{equation} \left.\frac{\partial^{2}}{(\partial q^{\alpha})^{2}} \varGamma_\kappa^{(m+1,n)}(\omega,\boldsymbol{q},\omega_1,\boldsymbol{q}_1\cdots)\right|_{\boldsymbol{q}=0} = {\mathcal{R}}(\omega)\varGamma_\kappa^{(m,n)}(\omega_{1},\boldsymbol{q}_{1},\ldots) , \end{equation}
where  ${\mathcal {R}}(\omega )$ is an operator achieving finite shifts by
 $\omega$ of the external frequencies of the function on which it acts, similarly to
 ${\mathcal {D}}_\alpha (\omega )$ in (3.31), at the difference that it also involves a derivative with respect to external wavevectors (see Tarpin et al. Reference Tarpin, Canet, Pagani and Wschebor2019 for details).
Using translation and rotation invariance of  $H_{\kappa,\gamma,\delta }$ in (C6), one can show that there are only two remaining contributions of the form
 \begin{equation} \frac{\partial^{4}}{\partial q_1^{\mu} \partial q_1^{\mu} \partial q_2^{\nu} \partial q_2^{\nu}}\quad {\rm and}\quad \frac{\partial^{4}}{\partial q_1^{\mu} \partial q_1^{\nu} \partial q_2^{\mu} \partial q_2^{\nu}}. \end{equation}
The first type of contributions is controlled by the Ward identities (C8) and (C11). Hence, either they are zero or they are proportional to a  ${\mathcal {R}}$ operator, and thus vanish when integrated over frequencies. However, the second type of contributions, the crossed derivatives, is not controlled by these identities. One can argue that they are nevertheless suppressed by a combinatorial factor. One thus arrives at the conclusion that most of the sub-leading terms in the large wavenumber expansion are exactly controlled by symmetries and vanish, while the remaining terms, which are not controlled by the symmetries, appear small based on combinatorics. This suggests that corrections to standard Kraichnan–Leith scaling of equal-time quantities in the large wavenumber regime, i.e. for the direct cascade, should be small, although it can only be argued at this stage.