Implications
In this study, we identify the basic expression characteristics of chicken Lpin1, including its two transcript isoforms Lpin1-α and Lpin1-δ, the tissue expression pattern and the effect of energy restriction on gene expression, which would make a foundation for further learning about the gene function of chicken Lpin1 and conducting the molecular selection or molecular regulation of chicken-related traits.
Introduction
Lpin1 was discovered as a mutated gene in a fatty liver dystrophic mouse using a positional cloning approach (Peterfy et al., Reference Peterfy, Phan, Xu and Reue2001). It was demonstrated that modulation of Lpin1 expression level (i.e. null, normal and elevated specifically in adipose tissue or skeletal muscle) led to dramatic alterations in mouse adiposity, ranging from 10% to triple the normal amount of adipose tissue mass (Phan et al., Reference Phan, Peterfy and Reue2004; Phan and Reue, Reference Phan and Reue2005; Reitman, Reference Reitman2005; Yao-Borengasser et al., Reference Yao-Borengasser, Rasouli, Varma, Miles, Phanavanh, Starks, Phan, Spencer, McGehee, Reue and Kern2006; van Harmelen et al., Reference van Harmelen, Ryden, Sjolin and Hoffstedt2007). The overexpression of Lpin1 in skeletal muscle or adipose tissue influences fat deposition through diverse mechanisms (Phan and Reue, Reference Phan and Reue2005). Unlike many obesity-related genes, Lpin1 was predominantly expressed in and exerts its actions on peripheral tissues, and thus may be a novel peripheral target gene for the treatment of obesity and/or lipodystrophy (Phan and Reue, Reference Phan and Reue2005; Reitman, Reference Reitman2005).
Recent studies have revealed two molecular functions of Lpin1. First, LPIN1, as well as the related LPIN2 and LPIN3 proteins, acts as Mg2+-dependent phosphatidate phosphatase type-1 (PAP1) enzymes, which catalyze a key step in the synthesis of glycerolipids (Han et al., Reference Han, Wu and Carman2006; Donkor et al., Reference Donkor, Sariahmetoglu, Dewald, Brindley and Reue2007; Harris et al., Reference Harris, Huffman, Chi, Shabanowitz, Hunt, Kumar and Lawrence2007). Second, Lpin1 can also act as a transcriptional coactivator. Through direct interaction with PPARα and PCG-1α, Lpin1 mediates enhanced expression of PPARα target genes involved in fatty acid oxidation in mouse liver (Donkor et al., Reference Donkor, Zhang, Wong, O'Loughlin, Dewald, Kok, Brindley and Reue2009).
Mutations in Lpin1 gene cause mouse lipodystrophy (Peterfy et al., Reference Peterfy, Phan, Xu and Reue2001) and human myoglobinuria (Zeharia et al., Reference Zeharia, Shaag, Houtkooper, Hindi, Delonlay, Erez, Hubert, Saada, Dekeyzer and Eshel2008; Michot et al., Reference Michot, Hubert, Brivet, De Meirleir, Valayannopoulos, Müller-Felber, Venkateswaran, Ogier, Desguerre, Altuzarra, Thompson, Smitka, Huebner, Husson, Horvath, Chinnery, Vaz, Munnich, Elpeleg, Delahodde, de Keyzer and de Lonlay2010). In addition, human Lpin1 polymorphisms have been associated with numerous metabolic traits including insulin and/or glucose levels (Suviolahti et al., Reference Suviolahti, Reue, Cantor, Phan, Gentile, Naukkarinen, Soro-Paavonen, Oksanen, Kaprio, Rissanen, Salomaa, Kontula, Taskinen, Pajukanta and Peltonen2006; Loos et al., Reference Loos, Rankinen, Perusse, Tremblay, Despres and Bouchard2007; Wiedmann et al., Reference Wiedmann, Fischer, Koehler, Neureuther, Riegger, Doering, Schunkert, Hengstenberg and Baessler2008), resting metabolic rate (Loos et al., Reference Loos, Rankinen, Perusse, Tremblay, Despres and Bouchard2007) and systolic blood pressure (Ong et al., Reference Ong, Leung, Wong, Cherny, Sham, Lam, Lam and Cheung2008). Gowri et al. (Reference Gowri, Sengupta, Bertera and Katzenellenbogen2007) suggested that lipid-regulating phosphatase not only had an important role in central metabolic regulation, but also had a new role in uterine function and reproductive biology. The different genotypes of the pig Lpin1 were found to be associated with percentage of pig leaf fat and intramuscular fat (He et al., Reference He, Xu, Zhao, Fan, Yu, Zhu, Li, Peng and Liu2009). However, little is known about Lpin1 gene in chicken at present. Here we cloned chicken Lpin1 coding sequence, studied the tissue expression of chicken Lpin1, evaluated the regulation of Lpin1 expression by energy restriction and conducted the correlation analysis of Lpin1 expression levels with some phenotypic, physiological and biochemical indicators of broilers, which would make a foundation for the further study on the function of chicken Lpin1.
Material and methods
Samples
The tissue samples including lung, spleen, abdominal fat, heart, pectoralis major, brain, liver, pancreas and cartilage tissues were collected from two 40-week-old healthy silkies (one male and one female), two 8-week-old hybrid meat chickens (one male and one female) for the identification of chicken Lpin1 transcripts/tissue expression pattern analysis. The collected tissue samples were deep-frozen in liquid nitrogen, and then stored at −70°C until use. Chickens were from Henan Agricultural University Poultry Breed Resource Conservation Center.
The deposited RNA samples of hepatic and abdominal fat tissues from the 30% energy restriction population were used to study the effect of 30% energy restriction on chicken Lpin1 expression by real-time quantitative reverse transcription PCR (qRT-PCR).
All birds used in this trial were handled in accordance with the guidelines for the Care and Use of Agricultural Animals in Research and Teaching, 3rd edition, 2010 (Association Headquarters, Champaign, IL 61822, USA), and was approved by Animal Care and Use Committee of Henan Agricultural University.
Establishment of 30% energy restriction population
The 30% energy restriction population was established as Chen et al. (Reference Chen, Guo, Huang, Shi, Zhang and Wang2012) described. Briefly, 50 healthy female Arbor Acre broiler chickens with similar weight (average weight of female broilers 330 ± 30 g) were selected at 18 days from one commercial Arbor Acre broiler population. Chicks were randomly allocated to free feeding (FF, n = 25) group and energy restriction (ER, n = 25) group. Chicks were housed individually with 23 h of light per day. From 18 to 48 days, FF group broilers were fed ad libitum with control diet, whereas ER group broilers were only provided 70% energy intake with low energy diet on ratio; other nutrient ingredients’ supply was the same as FF group broilers. The ingredients and nutrient levels of experimental diets were presented in Supplementary material 1. The control diet was prepared referring to 2004 Chinese Feed Standard of Chicken criterion.
Chicks were weighed and harvested at 49 days individually. Abdominal fat pad was excised and weighted. Abdominal fat rate (AFR = abdominal fat pad weight/BW) was calculated. Hepatic and adipose tissue RNA samples were collected and snap-frozen in liquid nitrogen, and then stored at −70°C. About 5 ml blood sample was collected to separate blood serum for the determination of following physiological and biochemical indicators including total cholesterol (CHO), high-density lipids (HDL), low-density lipids (LDL), triacylglycerols (TG), glucose (GLU; Nanjing Jiancheng Bioengineering Institute, Nanjing, P. R. China) using the Hitachi 911 analyzer (Roche, Basel, Switzerland), and insulin level (INS) was determined by the ELISA method with commercially available kits (CUSABIO Biotech, Wuhan, P. R. China).
Total RNA extraction and cDNA synthesis
Total RNA was isolated using Trizol reagent (Invitrogen, Carlsbad, CA, USA) according to the manufacturer's instructions. The quantity and quality of the isolated RNA was determined by GeneQuant pro ultraviolet spectrophotometry (Amersham Pharmacia Ltd, Bucks, UK) and agarose gel electrophoresis, respectively. Isolated total RNAs were dissolved in diethyl pyrocarbonate water and kept at −70°C. one microgram total RNA was subsequently reversely transcribed with PrimeScript® RT reagent kit with gDNA Eraser (Takara, Dalian, P. R. China) according to the manufacturer's instructions. The synthesized first strand cDNA was stored at −20°C.
Cloning of chicken Lpin1 open reading frame (ORF)
The coding sequence of mouse Lpin1-α (NM_172950.3) was used to search for chicken Lpin1-related sequence information from chicken Refseq RNA database and EST database (http://www.ncbi.nlm.nih.gov/blast.cgi). On the basis of gained predicted mRNA sequence (XM_419957.2), eight primer pairs (LP1-8, Supplementary material 2) were designed to clone chicken Lpin1 ORF and conduct sequence variation analysis with the hepatic tissues of two silkies and two hybrid meat chickens. A general touchdown thermal cycling protocol as follows was used to amplify chicken Lpin1 with LP1-8, respectively: 5 min denaturation at 94°C followed by 3 cycles of 1 min at 94°C, 1 min at 65°C, 1 min at 72°C; the annealing temperature was then decreased by 5°C every third cycle and a further 25 cycles were carried out when the annealing temperature reached 55°C; the final extension step was 72°C for 10 min. The PCR products of LP1-8 primer sets were purified with DNA agarose gel purification system (QIAGEN, Hilden, Germany), and directly PCR sequenced by commercial service. RT-PCR amplification of LP9 primer set was finished with LongAmp Taq DNA polymerase (LongAmp Taq kit, NEB, Beijing, P. R. China) according to the manufacturer's instruction. The PCR condition for LP9 primer set was 5 min denaturation at 94°C, followed by 35 cycles of 1 min at 94°C, 1 min at 58°C, 1 min at 72°C; the final extension step was 72°C for 10 min. The PCR amplification product of LP9 primer set was cloned into the pGEM-T vector (Invitrogen) and clones were sequenced by 373A Automated Sequencer (Applied Biosystems, Foster City, CA, USA) with M13 primer.
Tissue expression profile analysis by RT-PCR
The tissue expression profiles of chicken total Lpin1 and Lpin1-α/Lpin1-δ were detected by RT-PCR with LP7 and LP8 primer sets, respectively, the expression of β-actin (L08165.1) was used as a control, the primer sets were presented in Supplementary material 2. PCR amplification was done in a total volume of 15 μl containing 50 ng template cDNA, 1.0 μM of each primer and 1× Go Taq Green Master Mix (Promega, Beijing, P. R. China). A touchdown thermal cycling protocol as above was used to analyze the expression of chicken Lpin1 and β-actin among tissues. Finally, 10 μl of each PCR product was electrophoresed on 1.5% agarose gel. The band intensities were determined using NIH Image 1.61 software (National Institute of Health, Bethesda, MD, USA).
The effect of 30% energy restriction on chicken total Lpin1 expression
First, the SYBR GREEN qRT-PCR method (relative quantitative) was used to detect the effect of 30% energy restriction on chicken total Lpin1 relative expression in hepatic tissues and adipose tissues with LP6 primer set (Supplementary material 2). The β-actin was used as a control to normalize the differences among individual samples. Each sample had three replications for β-actin and objective gene, respectively. The qRT-PCR reactions were performed as two-step reactions in ABI 7700 (Applied Biosystems). It was done in a total volume of 30 μl containing 50 ng template cDNA, 0.4 μM of each primer, 2× Power SYBR GREEN PCR Master Mix (Applied Biosystems), following next parameters: one cycle of 94°C for 5 min, then followed by 40 cycles at 94°C for 30 s, 57°C for 25 s and 72°C for 30 s. The results of objective gene expression were normalized to the housekeeping gene β-actin. Gene expression results were calculated using the delta delta cycle threshold (2−ΔΔCT) method (Livak and Schmittgen, Reference Livak and Schmittgen2001).
Then TaqMan qRT-PCR methods (absolutely quantitative) were used to determine the copy number of total Lpin1 in hepatic tissues of ER and FF chickens. The qRT-PCR primers and the reaction conditions were optimized according to the reference (Gangisetty and Reddy, Reference Gangisetty and Reddy2009). The optimized primers were presented in Supplementary material 2. All reactions were carried out in triplicate with no template control and no-RT sample. The standard curve for each gene was constructed with purified PCR products generated using the specific primers of total Lpin1 gene, template cDNA was quantified using spectrophotometer and serially diluted 10-fold to span the range of predicted CT values that would be obtained from experimental samples. The calculation method of copy number for each template was performed according to the reference (Gangisetty and Reddy, Reference Gangisetty and Reddy2009). The qRT-PCR reactions were performed as two-step reactions in ABI 7700 (Applied Biosystems). qPCR amplification was done in a total volume of 25 μl containing 12.5 μl TaqMan Universal PCR Master mix (Applied Biosystems), 1.0 μl cDNA (1 μg/μl), 260 nM of each specific forward and reverse primer, 250 nM TaqManTM fluorescent probe, the parameters were as follows: 5 min at 94°C for predegeneration, followed by 40 cycles at 94°C for 20 s, 60°C for 1 min.
Statistical analysis
Data were analyzed using SPSS statistics program (version 13.0, Chicago, IL, USA). The unpaired t-test was used to compare the effect of energy restriction on chicken total Lpin1 expression; data were represented as means ± s.e.m. The Pearson correlation coefficients between Lpin1 expression level (detected by TaqMan probe-based qPCR) in hepatic tissues and some traits (including AFR and some physiological and biochemical indicators) were computed by the bivariate correlations procedure with two-tailed test. P < 0.05 was considered significant.
Results
Cloning of chicken Lpin1 ORF
Blast searching chicken Refseq RNA database and EST database (http://www.ncbi.nlm.nih.gov/blast.cgi) with the encoding sequence of mouse Lpin1-α (NM_172950.3), a predicted chicken sequence XM_419957.2 (similar to KIAA0188: LOC421945) was gained. Comparing this predicted chicken sequence with the ORF of human/mouse Lpin1-α, it indicated that the translation start site of chicken Lpin1 encoding sequence should be located at 1051 nt, whereas not at 1 nt of sequence XM_419957. The Chicken Lpin1 coding sequence should be 2709 bp, from 1051 to 3759 nt, possessing 71.4% and 70.20% nucleotide identity with human (NM_145693.1) and mouse (NM_172950.3) Lpin1-α, respectively, 67.9% nucleotide identity with both human (d80010, BM786275.1) and mouse (NM_015763.4) Lpin1-β, respectively, which suggests that sequence XM_419957.2 should contain chicken Lpin1-α ORF. The RT-PCR amplification with eight overlapping primer sets (LP1-8, Supplementary material 2) gained the ORF of chicken Lpin1-α from the hepatic tissues of two silkies and two hybrid meat chickens, and the sequence from one silkie chicken was submitted to GenBank (GenBank accession no. HM473175). By long-range PCR amplification with LP9 primer set (spanning exon 1 and exon 19 of chicken Lpin1-α) and clone sequencing, we further confirmed the expression of chicken Lpin1-α.
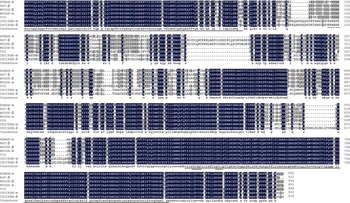
Analysis indicated that chicken Lpin1-α ORF contained 19 exons, spanning about 31-kb genome, and the exon–intron boundary abided by GT–AG rule. It predicted encoding a 902 amino acids protein (ADK89033) with a calculated molecular mass of 99.69 kDa and an isoelectric point of 6.10. The multiple sequence alignment indicated that LPIN1 proteins were conservative among species. The predicted chicken Lpin1-α protein shared 74.42%, 73.68%, 71.09%, 71.31% and 74.59% identity with the counterpart of human-isoform-α (NP_663731.1), mouse-isoform-α (NP_766538.2), mouse-isoform-β (NP_056578.2), rat (NP_001012111.1) and pig (ACF16051.1) LPIN1 proteins, respectively (Figure 1). Some strongly conserved domains were revealed, including the amino-terminal lipin domain (NLIP), a nuclear localization signal and a carboxy-terminal lipin domain (CLIP) containing DXDXT and the LXXIL motif (Figure 1).
The deduced amino acid sequence of the chicken Lpin1 gene was aligned to human-isoform-α (NP_663731.1), mouse-isoform-α (NP_766538.2), mouse-isoform-β (NP_056578.2), rat (NP_001012111.1) and pig (ACF16051.1) protein sequences. Identical acid residues among species were presented. The Lipin_N amino-terminal lipin domain and carboxy-terminal lipin domain were underlined with a uninterrupted line, nuclear localization signal domain was underlined with a dot line, DXDXT and LXXIL motifs were presented in double uninterrupted lines, respectively.

Identification of chicken transcript variant Lpin1-δ
In addition, one alternative splicing form of chicken Lpin1 gene (named as chicken Lpin1-δ, GenBank accession no. JN007385) was obtained by RT-PCR with LP8 primer set from chicken hepatic tissues. With LP9 primer set spanning exon 1 and exon 19 of Lpin1-α, we also identified chicken Lpin1-δ by long-range PCR amplification and clone sequencing. Lpin1-δ isoform was caused by a 48-bp fragment retention of intron 12 in chicken Lpin1-α, which was 441 bp apart from the 3′ boundary of exon 12 and 1601 bp apart from the 5′ boundary of exon 13. Analysis showed that the sequence insertion in chicken Lpin1-δ do not affect the ORF of chicken Lpin1; two transcripts predicted encoding highly similar protein with length variation of 16 amino acids, predicted chicken Lpin1-δ protein (AEX31552.1) shared 98.25% identity with chicken-isoform-α (ADK89033), shared 72.02%, 69.49%, 67.09%, 69.46% and 71.65% identity with the counterpart of human-isoform-α (NP_663731.1), mouse-isoform-α (NP_766538.2), mouse-isoform-β (NP_056578.2), rat (NP_001012111.1) and pig (ACF16051.1) LPIN1 proteins, respectively. Searching EST database of human, mouse and rat, a similar alternative splice variant (CB997204.1) was revealed from the human EST database, which contained a 213-bp intron 12 fragment comparing with human Lpin1-α (NM_145693.1). Searching computational dataset with VISTA Enhancer Browser (http://enhancer.lbl.gov/), an approximately 180-bp conservative element among chicken, human, mouse, rat and dog was identified from intron 12 of chicken Lpin1-α (Supplementary material 3).
Detected coding sequence variation of chicken Lpin1 and the potential effect
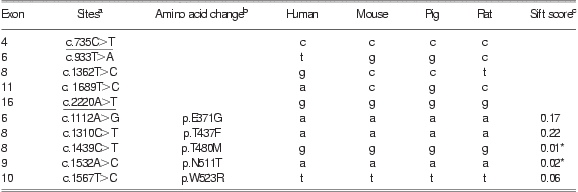
Sequence comparisons among chicken Lpin1 coding sequences of two silkies and two hybrid meat chickens revealed 10 coding single nucleotide polymorphisms (cSNPs; eight new cSNPs), which include five samesense mutations and five missense mutations. c.735C>T, c.1112A>G, c.1439C>T, c.1532A>C and c.1567T>C variation (reference to chicken coding sequence, HM473175) were conservative among five species (Table 1). These conservative variation sites may have potential important function. Sift program (http://sift.bii.a-star.edu.sg/www/SIFT_seq_submit2.html) predicted that c.1439C>T and c.1532A>C substitutions may affect the protein function (Kumar et al., Reference Kumar, Henikoff and Ng2009; Table 1).
The variation sites detected from chicken Lpin1 coding region
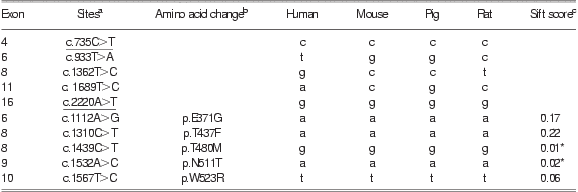
aEach coding sequence variant was named relative to the reference allele found in chicken Lpin1 coding sequence (HM473175). Variants with underline were also detected from genome sequencing plan.
bEach amino acid variant was named relative to the reference allele found in predicted chicken Lpin1 protein sequence (ADK89033).
cAsterisk represents the amino acid substitution was predicted to affect protein function by sift program.
Expression profile of chicken Lpin1
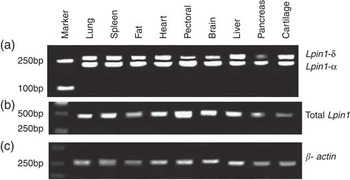
LP6 and LP8 primer sets were used to conduct the tissue expression analysis of chicken total Lpin1 and Lpin1-α/Lpin1-δ in four individuals, respectively. RT-PCR analysis revealed that the total Lpin1, Lpin1-α and Lpin1-δ were expressed in all analyzed tissues (Figure 2). Comparing with other analyzed tissues, chicken total Lpin1 mRNA had a relatively higher expression in the pectoralis major and a lower expression in the pancreas and cartilage (Figure 2b). LP8 primer set could detect the expression of two transcript isoforms Lpin1-δ and Lpin1-α at the same time. It showed that chicken Lpin1-α mRNA had a higher expression in the pectoralis major and a lower expression in the pancreas, whereas chicken Lpin1-δ mRNA had a higher expression in the hepatic and cartilaginous tissue and a lower expression in the pancreas (Figure 2a). Chicken Lpin1-δ/Lpin1-α ratios >1 in hepatic and cartilaginous tissue, whereas chicken Lpin1-δ/Lpin1-α <1 in other analyzed tissues, and chicken Lpin1-δ/Lpin1-α ratios were relatively lower in pancreas, brain and pectoralis major tissues (Figure 2a).
Tissue expression distributions of chicken Lpin1 transcripts among tissues. (a) Lpin1-δ/Lpin1-α; (b) total Lpin1; (c) β-actin.

The effect of 30% energy restriction on chicken total Lpin1 expression
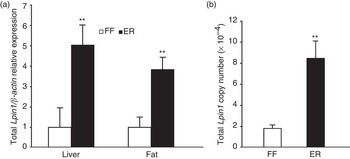
By SYBR GREEN qRT-PCR, it showed that the expression of β-actin between FF group and ER group had no significant difference and could be used as an internal control. The relative expression of chicken total Lpin1 gene mRNA in ER group birds was significantly higher than that of FF group birds in hepatic tissue (P < 0.01) and adipose tissue (P < 0.01; Figure 3a). Absolute qPCR by TaqMan probe also revealed that energy restriction significantly upregulated chicken total Lpin1 level by about fourfold in hepatic tissue (P < 0.01; Figure 3b).
The differential expression of total Lpin1 in liver and abdominal fat tissues between free feeding (FF) group and energy restriction (ER) group by real-time quantitative PCR. Fat, n = 5 for ER and FF group, respectively; liver, n = 20 for ER and FF group, respectively. **P < 0.01. (a) Relative expression of chicken Lpin1/β-actin detected by SYBR GREEN qRT-PCR and (b) absolute expression of chicken Lpin1 in hepatic tissue detected by TaqMan qRT-PCR.

Relationship of chicken total Lpin1 expression levels in hepatic tissue with some traits
In the energy restriction population, some traits including AFR, and serum total CHO, HDL, LDL, TG, GLU and INS level were measured (Chen et al., Reference Chen, Guo, Huang, Shi, Zhang and Wang2012). Conducting the correlation analysis between chicken total Lpin1 expression (absolute qPCR value) and these traits, it was seen that chicken total Lpin1 mRNA expression level was significantly negatively correlated with AFR (P < 0.01), serum HDL (P < 0.05) and total CHO (P < 0.05), whereas chicken Lpin1 gene mRNA expression level had no significant correlation with serum GLU, TG and INS level (Table 2).
The Pearson coefficients between the expression of chicken Lpin1 gene in hepatic tissue with physiological and biochemical indicators of broilers

GLU = glucose; CHO = total cholesterol; TG = triacylglycerols; HDL = high-density lipids; LDL = low-density lipids; INS = insulin; AFR = abdominal fat rate.
aTwo-tailed test: *P < 0.05; **P < 0.01.
Discussion
LPIN1 is a PAP1 enzyme, which is required in the de novo biosynthesis of TG, phosphatidylcholine and phosphatidylethanolamine (Donkor et al., Reference Donkor, Sariahmetoglu, Dewald, Brindley and Reue2007). Here chicken Lpin1 ORF was cloned and its conservative elements were revealed. DXDXT motif located in CLIP conservative region is the characteristic of a superfamily of magnesium-dependent phosphatases (Peterfy et al., Reference Peterfy, Phan, Xu and Reue2001; Han et al., Reference Han, Wu and Carman2006; Donkor et al., Reference Donkor, Sariahmetoglu, Dewald, Brindley and Reue2007), whereas the LXXIL motif mediates interaction with nuclear receptors (Finck et al., Reference Finck, Gropler, Chen, Leone, Croce, Harris, Lawrence and Kelly2006).
Lpin1 gene could generate multiple alternatively spliced mRNA forms. Transcript variants Lpin1-α, -β and -γ have been identified in human and mouse (Peterfy et al., Reference Peterfy, Phan and Reue2005; Han and Carman, Reference Han and Carman2010). It was found that the PAP of Lpin1-α, -β and -γ isoforms were dependent on Mg2+ or Mn2+ ions (Han and Carman, Reference Han and Carman2010). Lpin1-α and Lpin1-β had different and complementary function (Peterfy et al., Reference Peterfy, Phan and Reue2005; van Harmelen et al., Reference van Harmelen, Ryden, Sjolin and Hoffstedt2007; Reue and Zhang, Reference Reue and Zhang2008). Here we identified a novel isoform Lpin1-δ, which has an insertion between coding exons 12 and 13 of chicken Lpin-α, different from the reported transcript variants Lpin1-β and Lpin1-γ of human/mouse, which have an insertion between coding exons 4 and 5, and coding exon 10 and 11 of Lpin1-α sequence, respectively (Han and Carman, Reference Han and Carman2010). The Lpin1-δ-specific sequence consisting of 16 amino acids is located in a non-homologous region and does not alter the conserved NLIP and haloacid dehalogenase-like lipin domains (Han et al., Reference Han, Wu and Carman2006). Elements controlling alternative splicing may be present in introns: the existence of intronic splicing enhancers and silencers has been documented (Hare and Palumbi, Reference Hare and Palumbi2003). The identified conservative element from intron 12 of chicken Lpin1-N may have potential important function in the regulation of Lpin1-δ alternative splicing.
Previous studies revealed that Lpin1 mRNA was abundant in adipose tissue and muscle tissue of humans and mice (Peterfy et al., Reference Peterfy, Phan, Xu and Reue2001; Donkor et al., Reference Donkor, Sariahmetoglu, Dewald, Brindley and Reue2007). Chicken total Lpin1/Lpin1-α also presented high expression in pectoralis major tissue. The high expression levels of Lpin1 mRNA in metabolically active tissues, such as skeletal muscle were in accordance with the roles of Lpin1 in energy metabolism.
Previous studies in vitro and in vivo have linked Lpin1 to the maintenance of metabolic homeostasis (Reue et al., Reference Reue, Xu, Wang and Slavin2000; Phan and Reue, Reference Phan and Reue2005). Ryu et al. (Reference Ryu, Oh, Jo, Hedrick, Kim, Hwang, Park, Han, Choi, Montminy and Koo2009) found that fasting, high-fat diet and db/db mouse enhanced the expression of hepatic Lpin1 transcript and protein. Similar to the fasting effect in mice, our study showed that 30% energy restriction increased the relative expression of chicken total Lpin1 in both adipose tissue and hepatic tissues.
Phan et al. (Reference Phan, Peterfy and Reue2004) showed that Lpin1-deficient mice exhibit normal food intake but reduced fat deposition. Overexpressed Lpin1 in either mouse adipose tissue or skeletal muscle promotes obesity (Phan and Reue, Reference Phan and Reue2005). In contrast, in natural human population Lpin1 levels has been revealed to be negatively correlated with obesity (Yao-Borengasser et al., Reference Yao-Borengasser, Rasouli, Varma, Miles, Phanavanh, Starks, Phan, Spencer, McGehee, Reue and Kern2006; van Harmelen et al., Reference van Harmelen, Ryden, Sjolin and Hoffstedt2007; Tsuchiya et al., Reference Tsuchiya, Takahashi, Yoshizaki, Tanno, Ohhira, Motomura, Tanno, Takakusaki, Kohgo and Okumura2009; Miranda et al., Reference Miranda, Escoté, Alcaide, Solano, Ceperuelo-Mallafré, Hernández, Wabitsch and Vendrell2010), which shows the complicacy of expression regulation for Lpin1 gene. In accordance with the reports from natural human population, in our experiment chicken hepatic Lpin1 gene mRNA expression level presented significantly negative correlation with abdominal adipose deposition (AFR; P < 0.01).
It was reported that Lpin1 mRNA expression had a strong negative correlation with GLU and INS levels in mouse and human, TG levels in human (Suviolahti et al., Reference Suviolahti, Reue, Cantor, Phan, Gentile, Naukkarinen, Soro-Paavonen, Oksanen, Kaprio, Rissanen, Salomaa, Kontula, Taskinen, Pajukanta and Peltonen2006). Lpin1 RNAi in db/db mice had not showed significant effect on plasma TG and INS level (Ryu et al., Reference Ryu, Oh, Jo, Hedrick, Kim, Hwang, Park, Han, Choi, Montminy and Koo2009). Our study showed that chicken Lpin1 gene mRNA expression level was significantly negatively correlated with serum HDL and total CHO level (P < 0.05), whereas had no significant correlation with serum INS, TG and GLU level.
Overall, we identified two transcript isoforms (Lpin1-α and Lpin1-δ) of chicken Lpin1 and conducted their tissue expression analysis by RT-PCR. The qRT-PCR analysis revealed that 30% energy restriction significantly elevated the total Lpin1 mRNA expression level in hepatic and adipose tissues of birds. Chicken total Lpin1 gene mRNA expression level had a significantly inverse correlation with AFR (P < 0.01), serum HDL (P < 0.05) and total CHO (P < 0.05), which shows that chicken Lpin1 may play an important role in modulation of energy metabolism balance as human and mouse Lpin1.
Acknowledgments
The work was supported by the National Natural Science Foundation of China (No. 30771533), Excellent Youth Foundation of Henan Scientific Committee (0612001700) and Innovation Scientists, Technicians Troop Construction Projects of Zhengzhou City (096SYJH16092) and Zhengzhou City Feed and Nutritional Key Lab (111PYFZX153).
Supplementary materials
For supplementary materials referred to in this article, please visit http://dx.doi.org/doi:10.1017/S1751731112001358