


Introduction
The frequency of occurrence and thickness of ice layers in polar and sub-polar ice cores have been used as measures of past summer temperatures (Reference LangwayLangway, 1967; Reference Herron, Herron and LangwayHerron and others, 1981; Reference Koerner and Fisher.Koerner and Fisher, 1990; Reference Alley and Anandakrishnan.Alley and Anandakrishnan, 1995), and calibrations have been proposed which relate a specific change in past summer temperature to a change in the frequency of ice layers or change in the fraction of annual layers occupied by melt-layer ice (Reference Koerner and Fisher.Koerner and Fisher, 1990; Reference Alley and Anandakrishnan.Alley and Anandakrishnan, 1995). However, a comparison between quantitative measures of melt-layer occurrence and an independent indicator of summer temperature, such as July insolation, shows discrepancies which suggest that ice layers may reflect elements of climatic variability more complex than summer temperatures alone. Reference Alley and Anandakrishnan.Alley and Anandakrishnan (1995) noted an abrupt decrease in the occurrence of ice layers in the GISP2 (Greenland Ice Sheet Project 2) ice core from central Greenland at c. 9 ka (early Holocene), despite a Holocene maximum in July insolation at this time. Ice layers may have been present but invisible in the early Holocene ice owing to enclathratization of air bubbles in the GISP2 core (variations in bubble content make the ice layers visible in cores below the firn–ice transition), but Reference Koerner and Fisher.Koerner and Fisher (1990) noted the same absence of melt layers in the early Holocene ice in a core from Ellesmere Island where the total core depth was only 127 m and enclathratization of bubbles did not occur. Koerner and Fisher also noted the discrepancy between ice-layer frequency and July insolation.
We propose here that the frequency and magnitude of melt layers are not simply determined by infiltration of meltwater arising from warm summer temperatures but by the interaction between meltwater input and initial pre-melt) snow conditions, and that the appearance of melt layers in ice- cores contains information about seasonal and intra-seasonal climatic variability as well as summer temperatures.
Field Observations
As an example of the pattern of variability in ice-layer structure under changing conditions of summer infiltration, we present a summary of stratigraphy mapped in August 1991 along a surface traverse following a segment of the EGIG line (Reference HofmannHofmann, 1986) in West Greenland, covering the percolation and soaked faeies above the equilibrium line. Facies terms have been defined in Reference BensonBenson (1962) and in Reference Williams, Hall and Benson.Williams and others (1991). The traverse covered approximately 40 km, (69°5lʹ00ʺ N,47°1630ʺ W to 69°43ʹllʺ N to 48°6ʹ02ʺ W), along which elevations ranged from 1900 m (middle to upper range eif the percolation faeies; to 1640m (lower range of the soaked facies). Measurements were made at intervals of c. 1−3 km of ice-layer location, approximate thickness and lateral variability down to a depth of c. 1.5 m. Full pit profiles of stratigraphy, density, temperature, liquid-water content to c. 2 m depth were made at c. 5 km intervals along the traverse. Full pit results at four locations along the transect are shown in Figure 1.
Stratigraphy in percolation facies at four elevations along the EGIG line, West Greenland, observed at the end of the 1991 melt season.

Density and water-content profiles were made with the Finnish “snow-fork.” dielectric device (Reference Sihvola and Tiuri.Sihvola and Tiuri, 1986). The snow-fork samples a region approximately 2 em in diameter around the probe and the density and water-content values are displayed as points in the figure ratherthan over depth intervals. Aecuraey of the snow fork is nominally ±5% for density in dry snow and ±2% (of void volume) for liquid water and is additionally subject to errors arising from ionic contaminants in the snow. In practice, the snow fork appears to be sensitive only to large variations in water content. Measurements of density and water content as determined by the snow fork are shown in Figure 1. where at the highest site (1900 m) measured liquid-water content is seen to be as high as 2–3% by void volume despite the presence of sub-freezing temperatures as low as −7°C. Experimental and field comparisons of the snow fork with the Denoth dielectric device have been made (Reference Williams, Rikkers, Pfeffer and SommerfeldWilliams and others, 1996) which show that, under controlled conditions, measurements of water content as made by the two devices do not differ by a statistically significant margin. The value of the snow-fork measurements remains an open question but we do not rely on the accuracy of the absolute values determined by the snow fork for the present purpose. Values derived from the snow-fork measurements are not a part of the quantitative modeling presented and we use the values only to investigate the qualitative pattern of density and water content over depth and in comparison to measured stratigraphy and temperature.
The four sites displayed in Figure 1 show a transition from partial infiltration of the current year’s accumulation at the highest site (1900 m) to full wetting of several year’s accumulation at the lowest site (1640 m). At the time of the observations, the summer melt season had essentially concluded, with refreezing of summer-wetted snow complete at 1900 and 1840 m, and in progress at 1790 and 1640 m.
We refer below to “full” wetting; this condition refers to the state in which the snow temperature is everywhere at the melting point and liquid water is present everywhere at some saturation. The liquid-water content throughout the uniformly wetted snow is unknown beyond what is shown by the snow-fork measurements but, in general, heterogeneous saturation and preferred flow paths are known to develop in snow at 0°C (e.g. Reference ColbeckColbeck, 1979; Reference KattelmannKattelmann, 1989; (Reference Conway and BenedictConway and Benedict, 1994). However, the heterogeneity is less than in sub-freezing snow and, most importantly for the present discussion, heterogeneous flow paths within uniformly wetted snow do not produce ice layers since no sub-freezing snow is present adjacent to highly saturated layers to provide a heat sink for released latent heat of freezing.
The stratigraphy at 1900 m shows the classical pattern of the percolation facies: partial wetting of the current year’s accumulation by propagation of a uniform wetting front (15–60 cm depth) and unwetted snow from the current year below the depth of full infiltration (60–125 cm). The fully infiltrated snow between 15 and 60 cm is characterized by large melt-freeze grain clusters and R5 hardness. The snow between 60 and 125 cm is smaller-grained, softer (R4) and shows some evidence of faceting. Within the 60–125 cm unit are several large ice layers delivered by pipes (observed) from wet layers higher in the snow during the melt season (the 60–125 cm unit is “unwetted” in the sense that it was not exposed to full infiltration; water was delivered to this unit but only in isolated pipes and ice layers). The previous year’s summer surface lies at 150 cm, at the base of an ice layer (145–150 cm) produced by the current summer’s melt. Ice layers of various sizes are abundant throughout the stratigraphy.
At 1840 m, a largely identical pattern to 1900 m is shown: full wetting from 5 to 70 cm, unwetted accumulation with ice layers and pipes between 70 and 126 cm, with the previous year’s summer surface and fully wetted accumulation below (126–210cm). As at 1900 m, ice layers are abundant throughout the stratigraphy. Note also that the thicker-ice layers at both sites are concentrated in the lower unwetted units, while the upper fully wetted units contain more numerous but smaller layers. This is because the lower thicker-ice layers are formed by delivery from pipes, while the upper layers are mostly formed by delivery from full infiltration. The distinction between layers formed by these two processes has also been discussed by Reference Pfeffer and Humphrey.Pfeffer and Humphrey (1996) and will be discussed further below.
The stratigraphic picture changes at 1790 m. Full wetting extends at this site to the complete depth of the current year’s accumulation (soaked facies). The previous year’s summer surface was not clear at this site but the refrozen wetted snow between 90 cm and the base of the pit at 190 cm is inferred to be at least in part full wetting from the previous year. Small ice layers are evidently rare or absent at this site, with ice layering confined mostly to a small number of very large and discontinuous ice layers, lenses and pipes. Refreezing at this site has not commenced but the refreezing process cannot produce ice layers after the time of observation from the conditions at the time of observation; the fully wetted snow has created a steady-state (but not necessarily homogeneous) hydraulic pathway lor water and no mechanism other than isolated refreezing at depth can create a hydraulic barrier to flow on which to build up a saturated layer to form an ice layer. Isolated freezing cannot occur from the conditions at the time of observation either, since in its isothermal state, no isolated heat sink exists in the fully wetted snow to freeze water along a distinct horizon.
The lowest site, at 1640 m, show s even greater development of the uniformly wetted conditions seen at 1790m. Only one isolated ice lens was found, at 40 cm, and a small ice layer at 55 cm. Otherwise, the snow was homogeneously wet and free from any features of internal refreezing down to the pit depth of 200 cm (and as seen in a core below the pit, was wet to 270 cm depth). Surface refreezing from 0 to 28 cm occurred rapidly during a cold spell of several days duration.
For the purposes of the present analysis, the striking aspect of the variations in stratigraphy along the traverse is that internal ice layers are a more common element of the higher colder sites, where infiltration of summer melt is more limited than at lower warmer sites. This observation is not entirely compatible with the assumption made in paleoclimatic interpretations that increased ice-layer frequency, or fraction of mass in ice layers, is an indicator of greater meltwater input during anomalously warm summers.
These observations show how infiltration and refreezing change in character across a spatial gradient in climate, which is not identical to but is to a large degree analogous with how they may be expected to change in a temporal gradient in climate. We are assuming that we can infer the general character of the climatic gradient along the traverse from 1900 to 1640 m from existing mass-balance observations (e.g. Reference Ohmura and Reeh.Ohmura and Reeh, 1991; Reference Letréguilly, Huybrechts and Reeh.Letréguilly and others, 1991). Data are available for direct determination of the spatial gradient in energy balance in this region (Reference Steffen, Box and Abdalati.Steffen and others, 1996), although an analysis of these data is beyond the scope of the present work.
Analysis
We consider next the details of heat transfer and water flow at a stratigraphic barrier, the interaction between infiltration and refreezing of meltwater at a stratigraphic fine-to-coarse transition, and investigate what conditions promote the development of discrete internal ice layers vs infiltration across the boundary. Reference Wankiewicz, Colbeck and RayWankiewicz (1979) has summarized the effects of stratigraphy on water flow through a snowpack and has discussed the hydrology of stratigraphic boundaries which retard, accelerate or have no effect on flow. Among those boundaries which retard flow are line-to-coarse transitions, where fine-grained snow overlies coarse-grained snow. The physical cause of the impedance stems from the behavior of unsaturated hydraulic conductivity at low water content, where fine-grained porous material becomes less conductive than coarse-grained material owing to the dominance of capillary effects in the smaller voids of the line-grained material. This effect has been discussed for snow by Reference Wankiewicz, Colbeck and RayWankiewicz (1979) and by Reference Marsh and CorapciogluMarsh (1991), and is also well known in the soils literature (see, e.g. Reference CoreyCorey, 1977, fig. 4.7). While other stratigraphic boundaries are present in the snowpack considered here, we concentrate on fine-to-coarse transitions, because our experience here and elsewhere in Greenland (PfefTer and Humphrey, 1996) indicates that these are probably the primary formation sites for ice layers in the percolation faeies of Greenland. The tendency for ice layers to form at fine-to-coarse transitions has been noted by Reference WakahamaWakahama (1968), although Reference Marsh and Woo.Marsh and Woo (1984) reported that in their observations all stratigraphic boundaries acted as impeding horizons.
Qualitatively, the formation of an ice layer at a stratigraphic boundary depends on the freezing process at the boundary interface occurring rapidly enough to create an impermeable (or very reduced permeability) ice layer before sufficient water has accumulated to force flow across the barrier. Liquid water is added on the fine (upper) side of the transition as flow from above feeds water to the interface and is simultaneously subtracted by refreezing. Latent heat released during refreezing is conducted to colder snow adjacent to the site of refreezing and reduces the temperature gradient driving refreezing. Water flow is also influenced by the refreezing process through reduction of void space and intrinsic permeability.
In the following analysis, we consider only the one-dimensional problem of water crossing a boundary from finegrained to coarse-grained material. However, stratigraphic boundaries in snow are highly heterogeneous and the infiltration and refreezing process produces correspondingly heterogeneous results along boundaries and a complex three-dimensional structure of ice layers, pipes and water pathways. In general, refreezing culminating in the production of a locally impermeable ice layer can be expected to occur over some fraction of the area of a sub-freezing impeding boundary, with break-through of water across the boundary occurring over the remaining area. The relative size of the permeable and impermeable areas depends upon the heterogeneity of grain-scale hydrological characteristics of the impeding boundary and upon the processes which we are modeling here. The observed proportions of permeable and impermeable areas (e.g. Reference BensonBenson, 1962; Reference Marsh and Woo.Marsh and Woo, 1984; Reference Echelmeyer, Harrison, Clarke and Benson.Echelmeyer and others, 1992) range from negligible ice-layer formation (isolated ice glands) to negligible break-through (continuous massive ice layers).
Following formation of ice layers on parts of an impeding boundary, water draining on to impermeable parts of the boundary is diverted downslope (or laterally) until it encounters a place where water flow across the boundary is established. In this way, that part of the boundary occupied by ice layers forms a catchment area for adjacent drainage across the boundary, allowing substantial water flux past the boundary in a limited number of vertical drainage channels (pipes). Conditions which strongly favor the predominance of ice-layer formation over break-through result in a large fraction of the impeding boundary developing into an impermeable ice layer but, at the same time, focuses a large flux of water on to the small fraction of area where drainage across the boundary has been established. High-flux vertical drainage channels have a greater capacity to penetrate cold snow than uniform infiltration (Reference Marsh and Woo.Marsh and Woo, 1984; Reference Pfeffer and Humphrey.Pfeffer and Humphrey, 1996) and result in deeper but more heterogeneous infiltration of melt.
Consequently, the formation of a single ice layer, to which the modeling presented here applies, results ultimately not in sealing off the snowpack below the layer but in infiltration which is deeper and more heterogeneous than a uniform wetting-front advance. The number and variety of slraligraphic boundaries influences the number of potential sites for ice-layer formation but Arctic snowpacks typically contain a very large number of distinct stratigraphic units as a consequence of wind transport and deposition, and availability of impeding boundaries is not a limiting factor.
Infiltration
Under unsaturated, two-phase (water and air) conditions, where inertial effects are negligible, water flux u w(with dimensions of LT −1) is given by the Darcy equation:

where k w is the unsaturated permeability, µ w is the viscosity of water at 0°C, p c is the capillary pressure, ρ w is density of water (at 0µC), g is gravity, and z is the vertical coordinate. The unsaturated permeability k w can be expressed in terms of intrinsic permeability k and capillary pressure as

where k w, pd, n and λ are parameters which are characteristic of the given porous medium. The intrinsic permeability k has been determined experimentally for snow as a function of density and grain-size by Reference ShimizuShimizu (1970). For the exponent n we use Colbeck and Davidson’s (1973) value of 3.0, which we hold fixed. The parameters p d (air-entry pressure) and λ (Brooks–Corey parameter) have been measured by Wankicwicz (1976) for some different snow types but without good control on the characteristic grain-size of the snow. In order to have values of p d and λ which are measured for well-defined grain-sizes, we use values determined experimentally for sands of appropriate grain-size (Reference Illangasekare, Yates and Armbruster.Illangasekare and others, 1995; personal communication from G. Walser, 1997) to represent fine-grained and coarse-grained snow. These values are shown in Table 1. The value of p d for the coarse-grained side (represented by #30 sand) is higher than the range of values given for snow by Reference WankiewiczWankiewicz (1976), who reported maximum values (from measurements of two snow samples) of −650 Pa. We investigated the effects of uncertainty in the values of p d in the numerical calculation; these results are discussed below.
Sand hydrologic parameters adopted for fine- and coarse-grained snow

The capillary pressure p c associated with the unsaturated hydraulic conductivity required to maintain a steady flux uw under a given pressure gradient is greater in magnitude (more negative) in fine-grained snow than in coarsegrained snow. In order to preserve continuity of pressure across the fine-to-coarse transition, a pressure gradient exists where saturation rises in water accumulated on the fine (upper) side of the interface. The gradient in saturation approaching the transition can be calculated assuming steady flow using a method described by Reference CoreyCorey (1977, p. 147); we take a simplified approach here by assuming that the water accumulating at the interlace is initially stationary, so the pressure gradient is simply αg. From this, the depth of the gradient zone is

where p c,l and p c,2 refer to capillary pressure in the fine and coarse layers, respectively, and are calculated in terms of the transmitted flux u w:

The capillary pressure p e is calculated separately in the fine and coarse layers using corresponding values for p d, k and λ.
The total water required to establish the saturation gradient is

where ϕ is the bulk snow porosity, S r is the irreducible saturation, taken to be 7% pore volume for all snow types (Reference Colbeck and Davidson.Colbeck and Davidson, 1973) and p d and λ take on values for fine-grained snow (represented by #30 sand (Table 1)).
The time required to fill the saturation gradient can be determined in terms of the water-input rate to the interface and the rale of loss of water by refreezing at the interface. Under steady conditions in the snow above the impeding interface, the rate of water input to the interface is equal to the rate of surface meltwater production, u
input, (with dimensions of LT
−1), which we treat as a parameter in calculations. The rate of accumulation of liquid water  at the interface is equal to the waler-input rate minus the rate of local refreezing:
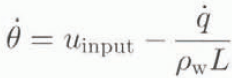
where  is the heat release associated with freezing at the interface, ρ
w is the density of water and L is the latent heat of fusion. The time required for sufficient water to accumulate to establish the saturation gradient and allow flow across the transition, or time to break-through, t
B, can then be calculated if the input and loss rates u
input and
 are known.
Refreezing
The rale of refreezing at the line-to-coarsc transition is determined by calculating the time-varying heat flux conducted away from a boundary held at 0°C into a medium of initial uniform sub-freezing temperature −T. This is done for two geometries: one in which heat is conducted away from the freezing interface on one side only (corresponding to freezing at the edge of a uniformly infiltrating vxctting front) and another in which heat is conducted away from the site of freezing into cold snow above and below the wet layer (corresponding to freezing of water injected along a fine-to-coarse transition from a pipe source). For one-sided freezing, the heat flux (with dimensions of EL −2 T −1) as a function of distance z from the 0°C boundary and time t following imposition of 0°C at the boundary is (e.g. Reference Carslaw and Jaeger.Carslaw and Jaeger, 1959):

where ρ is the snow density, c is the heat capacity of ice, k is the density-dependent thermal conductivity of snow, K is the thermal diffusivity of snow and T is the positive magnitude of the initial sub-freezing snow temperature. The accumulated heat conducted away from the interface (at z = 0) is then

If q F is the amount of heat release involved in the refreezing of an amount of ice sufficient to create an impermeable (or substantially reduced permeability) horizon, then the time t F to the creation of an impermeable horizon, or the “freeze-off” time, is

For two-sided conduction, with heat being conducted into sub-freezing snow on both sides of the wet layer, the heat flux is

where the subscripts 1 and 2 refer to the fine- and coarsegrained snow layers, respectively. The accumulated heat conducted away from the interface is

and the time to freeze-off is

Note that for the special case, where the snow density and temperature are the same on both sides of the interface, the time to two-sided freeze-off reduces to

or one-fourth of the time for one-sided freeze off. The rate of freezing is faster for two-sided freeze-off, because the area across which heat is transferred is doubled and with the heat flux distributed over twice the area, the temperature gradient is reduced more slowly.
The total latent-heat release required to achieve an impermeable horizon remains to be determined. We estimate what minimum vertical extent of ice will stop or substantially slow the liquid-infiltration process by considering an ice layer of thickness D consisting of ice at density ρimp . This layer releases an amount of heat equal to

where L is the latent heat of fusion and ρ 1 is the initial snow density in the fine-grained layer where the ice forms. We chose ρ imp to be the pore close-off density of 0.83 Mg m−3 and treat D as a parameter in the calculations.
Model Calculations
We calculated the time to break-through t B, and the time to freeze-off, t F, based on the theory described above, for values of ρ, grain-size and T describing the fine-grained and coarse-grained layers, and for a range values of the parameters u input and D. Break-through of water across the stratigraphic horizon is the final result of the combined processes if t B < t F; alternatively, an ice layer is the result if t F < t B. The results of the calculations are shown in Figure 2, in the form of nomograms indicating regions of the parameter space in which either break-through or freeze-off dominates. Each of the six graphs in Figure 2 shows a region of T − ρ parameter space subdivided by a family of curves corresponding to selected values of a third parameter. The path of the curve for any one value of the third parameter divides the T − ρ space into a region where break-through dominates (t F < t F) above each curve and a region where freeze-off dominates (t F < t B) below each curve. Figure 2a–d shows break-through vs freeze-off for combinations of T, ρ and the minimum ice-layer thickness D; Figure 2e and f shows break-through vs freeze-off for combinations of T, ρ and water-input rate u input. Figure 2a, c and e shows results for one-sided freezing and Figure 2b, d and f shows results for two-sided freezing.
Nomograms displaying model results. Temperature–density parameter spaces are divided by curves for selected values of a third parameter into regions where infiltration dominates freezing (“break-through”) above the curve, and regions where freezing dominates infiltration (“freeze-off”) below the curve. The third parameter values shown are minimum impermeable-layer thickness D and rate of water input uinput. Panels labeled “one-sided freezing” give results for uniform infiltration encountering an horizon with sub freezing snow below; panels labeled “two-sidedfreezing” give results for water injected from a pipe source along an horizon with sub freezing snow above and below.

The maximum and minimum times to culmination of the break-through/freeze-off process for each of the six nomograms are shown in Table 2. The times should be compatible with the time-scale of the infiltration process in Nature, where steady infiltration is unlikely to occur for time periods greater than 24 hours, since the production of surface mell is strongly forced by daily cycles in temperature and solar radiation. As can be seen in Table 2, the maximum times for panels 2e and fare greater than 24 hours, although times greater than 24 hours occur in only 13% of the cal-culated outcomes for these two cases. In these cases, at least, a more realistic treatment in future calculations can be achieved by cycling the water input and allow refreezing to continue without infiltration for a part of the 24 hour period.
Miniinuin and maximum times (h) to break-through or freeze-off for the six nomograms (a)–(f) in Figure 2

We choose ranges of 1–5 mm for D and 1 × 10⁻¹ to 5 × 10 cms−1 for u input. The minimum ice-layer thickness D is not well constrained by observations. We chose the range of values 1–5 mm in part, because it represents thicknesses equal to several grain diameters (and, roughly, void diameters) and also because pipes are observed to descend from ice layersas small as c. 5 mm, indicating that ice layers of this size are diverting water laterally. We have noted that D represents only the thickness at which the water-flow process is substantially interrupted; the freezing process mav continue past this point and the final ice-layer thickness may be substantially greater than D. The range of water input is chosen to bracket a typical value for melt rate (3 × 10⁻⁵ cm s−1) at a mid-latitude Greenland site within the percolation facies, based on simple surface-energy balance considerations.
In Figure 2a and b, the density ρ 1 of the fine-grained (upper) side of the interface is varied, while the density ρ 2 of the coarse-grained (lower) side is held fixed at 0.35 Mg m−3. The temperature variation refers to the lower cold side of the interface only for one-sided freezing in Figure 2a and to the temperature of both sides of the interface in two-sided freezing. The paths of minimum ice-layer thickness D follow nearly straight lines in T − ρ space, with greater values of D placing greater demands on the freezing process and, as would be expected, displacing the brcak-through/freeze-off boundary downward and expanding the region of break-through. The variable density in the fine layer (ρ 1) affects the break-through/freeze-off process non-linearly in the amount of water required to cross the stratigraphic boundary (Equation (5)), but, more dominantly and linearly, in the amount of ice initially present on the upper side of the boundary. This dominance causes the paths of D to be straight, while the corresponding paths in the other panels can be seen to be curved. Comparison of Figure 2a (one-sided freezing) and b (two-sided freezing) shows the effect of the greater rate of freezing for the two-sided process. For example, at T = −15°C and ρ 1 = 0.30 Mgm−3, one-sided freezing can lead to freeze-off only if a 3 mm ice layer is sufficient to create an impermeable horizon, while two-sided freezing can lead to freeze-off, even if the minimum requirement for impermeability is greater than 5 mm.
Figure 2c and d shows break-through vs freeze-on for the same ranges of T and D but with the density ρ 1 of the finegrained (upper) side of the interface held fixed at 0.35 Mg m−3 and the density ρ 2 of the coarse-grained (lower) side varied. In this case, the paths of the minimum ice-layer thickness D are curved, reflecting the dominance of the non-linearity of ρ 2 in the calculation of the amount of water required to cross the stratigraphic boundary. Beyond this feature, the most significant difference between the curves for variable ρ 1 (Fig. 2a and b) and those for variable ρ 2 (Fig. 2c and d) is the small counter-clockwise rotation of the curves in Figure 2c relative to those in Figure 2a. The curves in Figure 2c are depressed below the values in Figure 2a for ρ 2 below 0.35 (the fixed value in Figure 2a) and are elevated for ρ 2 above 0.35. The change is due to the dependence of thermal conductivity on density: lower thermal conductivity at lower density slows the freezing process and expands the region of break-through, while higher thermal conductivity at increased density speeds the freezing process and expands the region of freeze-off.
Figure 2e and f shows the effect of varying the water input rate. In this case. ρ 1 and ρ 2 are set equal and varied together. Increased rates of water input u input expand the region of break-through in T − ρ space, as would be expected, but not without limit: the effect of an increase in u input is greater at lower values of u input. This is because “input is rate-limiting at low rates of water input but not fully rate-controlling, as expressed in Equation (6). The relatively close spacing of the curves for different values of u input indicate that this parameter is not an especially effective control on the break-through/freeze-off process. For example, in Figure 2f, the break-through/freeze-off boundary for u input = 2 × 10⁻⁵ cm s−1 lies at T = −8.5°C for ρ = 0.30 Mg m−3. A doubling of u input to 4 × 10⁻⁵ cm s−1 displaces the break-through/freeze-off boundary downward to T = −1°C for the same density. Leaving u inpnt fixed at 2 × 10⁻⁵cm s−1 and reducing density accomplishes the same displacement of the break-through/freeze-off boundary (from −8.5° to −11°C) for a density change of only 13% from 0.30 to approximately 0.26 Mg m−3. The doubling of u input is a significant variation in energy balance, while a 13% change in density is well within observed intra-seasonal variability.
The air-entry pressure p d and its contrast across the fine-to-coarse transition is among the most important hydrological parameters to be specified for the break-through/freeze-off process, but il is probably the least well-known from measurements in snow. We calculated the effect on the results of 10% variations in p d for both the fine and coarse sides of the interface. Representative results are shown in Figure 3. The solid curves are the result (from Fig. 2e) for one-sided freeze-off, with ρ 1 = ρ 2 = 0.35 Mg m−3 and U input = 3 × 10⁻⁵ cm s−1. The shaded area surrounding the single curves in Figure 3a (variation of p d for the fine-grained material) and Figure 3b (for the coarse-grained material) show the range of displacement of the curve for a 10% increase and decrease in p d Note that the direction of displacement of the curve is opposite in Figure 3a and b: this is consistent with the fact that variations resulting in a reduction in contrast across the interface result in an expansion of the region of break-through in T − ρ space, while an increase in contrast will expand the region of freeze-off The displaced curves still the within a part of the T − ρ space relevant to the present investigation. We also repeated the calculations with p d for the fine-grained material reduced to −650 Pa (Wankiewicz’s reported maximum value); this resulted in a somewhat greater expansion of the region of break-through than shown in Figure 3 but the line dividing break-through from freeze-off still lies within a relevant part of the space. All parameters relating various hydrological properties to water content are intrinsically very difficult to measure in a controlled fashion in snow, because of thermodynamic influences on grain-size, water content and capillary pressure. Better values of p d as a function of grain-size would be very desirable to improve this analysis but how such measurements will be performed is unclear.
Nomograms showing the effect of 10% variations in air-entry pressure. (a) shows the effect of variations of pd in the finegrained (upper) side of the stratigraphic horizon, while (b) shows the effects of variations in the coarse-grained (lower) side. The solid curve is for one-sided freeze-off, with ρ1 = ρ2 = 0.35 Mg m−3 and Uinput = 3 × 10⁻⁵ cm s−1. The shaded areas show how the curve separating break-through from freeze-off is displaced by the variations in pd.

All the nomograms in Figure 2 show in a general way the expected pattern of refreezing dominating breakthrough for conditions of colder initial temperature and greater density. Variations in minimum impermeable layer thickness D and input rate u input displace the break-through/freeze-off boundary towards break-through when the variations act to place greater demands on the freezing process or case demands on the break-through process and displace the boundary towards freeze-off for variations acting in the opposite sense. The region of the T − ρ − D − u input parameter space containing the break-through/freeze-off boundaries also brackets values of the parameters observed and inferred for the percolation faeies. However, the relationships between break-through, freeze-off and the parameters considered is complex and, in particular, does not show simply that break-through dominates freeze-off under conditions of increased meltwater input without regard to other parameters. The model results support the hypothesis developed above that the distribution of ice layers observed over a part of the percolation faeies along the EGIG line is in part a consequence of the close competition between the processes of break-through and freeze-off. Evidently, an increased frequency of occurrence of ice layers al one site relative to another, or at one site relative to the same site at a different time, may be the consequence of (keeping other model parameters fixed): (1) greater meltwater input (the cause typically assumed in paleoclimalic interpretations); (2) colder initial conditions possibly due to a colder winter or earlier onset of spring melt); or (3) greater initial density in either the fine-grained or coarse-grained layer. While variations in minimum impermeable layer thickness D have a significant effect, this parameter has been varied only because the most realistic value is not known. It is unlikely that this is an “environmental” variable with a well-defined value which changes in space and time in response to environmental forcing. To the extent that the value might vary as a function of, say, grain type or grain age, the change in value would most likely affect the heterogeneity of break-through along stratigraphic fine-to-coarse transitions and influence other quantities such as typical inter-pipe spacing which have influences on the development of ice layers which are not dealt with here.
From the perspective of applications to paleoclimate analyses, the most significant conclusion, derived from the model results, and supported by the EGIG-Iine observations, is that increased frequency of ice layers will not be a consequence of uniform warming in summer and winter (best seen in the transition in ice-layer frequency with descending elevation along the EGIG line) but is most likely a consequence of an increased contrast between initial snow temperature (a measure of winter temperature) and summer melt rate (a measure of summer temperature). The contrast may arise from an increase in summer temperature, together with a constant winter temperature, or a decrease in winter temperature with a constant summer temperature, or both (increased seasonal amplitude in temperature), or from a change in the time of onset of spring melting with winter and summer average temperatures remaining unchanged.
Conclusions
Observations in the percolation faeies between 1650 and 1900 m in West Greenland indicate that the relationship between frequency of occurrence of ice layers in the snowpack and climate (and summer temperatures in particular) is more complex than typically assumed in the paleoclimatic interpretation of ice layers in ice cores taken from relatively wet sites. The process of ice-layer formation was studied analytically by modeling the competition between infiltration of water across a stratigraphic boundary in layered porous media and the loss of water by refreezing. In the absence of definite measurements of the Brooks–Corey parameter λ and entry pressure p d for snow of different grain-sizes, values were adopted from measurements in sand. Despite the uncertainty in the specific values of the model calculations using parameter values from sands, the results demonstrate the principles and facilitate the discussion of how ice layers originate. Better experimental values of hydrological parameters for snow of different grain-sizes will improve the present calculations, as will direct experimental or field observations of the freezing process at impeding horizons in layered snowpacks. However, the essential physical phenomena controlling the combined processes of infiltration and refreezing at a fine-to-coarse transition are well-represented. Model results agree qualitatively with the conclusions from the Greenland observations and indicate that increased frequency of ice layers in snow is the product of greater temperature contrast between winter conditions and summer conditions. The result has implications for paleoclimate interpretations of ice cores from regions experiencing moderate summer melt rales and has the potential to give new information on temperature seasonality.
Acknowledgements
The authors thank D. B. Bahr for assistance in the Greenland field work, as well as R. Braithwaite and the Geological Survey of Greenland for logistical support, field collaboration and many helpful discussions. We also wish to thank the Swiss Federal Institute of Technology for their logistical support and M. Stober for providing GPS coordinates of EGIG-line positions. The manuscript was improved by comments from two anonymous reviewers. This work was supported by DOE grant No. DE-FG02-90ER61078 and ARO grant No. DAAHO4-96-2-0033.



