


1. Introduction
Two- and multicomponent systems of nonlinear reaction–diffusion equations have well-known applications to mobile interacting reagents and cells in chemical kinetics, biological morphogenesis, some biomedical processes and population ecology [Reference Kuang, Nagy and Eikenberry26, Reference Murray30, Reference Murray31, Reference Okubo and Levin32, Reference Waniewski40]. Understanding of the dynamical behaviour of such systems has been developed largely from stability theory of steady states and bifurcation theory, reduction to travelling waves and numerical simulations. There are very many works devoted to these topics (see, the books cited above and, e.g., recent papers [Reference Alhasanat and Ou1, Reference Lam, Salako and Wu27] and references therein).
On the other hand, a relatively small number of papers are devoted to the search for exact solutions of the systems of nonlinear reaction–diffusion equations arising in the applications mentioned above. To the best of our knowledge, the main attention in this direction was paid to the diffusive Lotka–Volterra (DLV) system, for which several exact solutions in explicit forms were constructed [Reference Chen, Hung, Mimura and Ueyama7, Reference Cherniha and Davydovych8, Reference Cherniha and Davydovych9, Reference Cherniha and Dutka15, Reference Hung25, Reference Rodrigo and Mimura37], many of which are summarised in the book [Reference Cherniha and Davydovych10] and the recent review [Reference Cherniha and Davydovych13]. There are also a few studies devoted to finding exact solutions of direct generalisations of the DLV system arising in real-world applications [Reference Cherniha and Davydovych11, Reference Cherniha and Davydovych12, Reference Cherniha and Davydovych14, Reference Pliukhin35]. All the known solutions of the DLV system and its generalisations can be divided into two classes. The first one consists of travelling plane waves which make up an important class of solutions that are obtainable via the straightforward reduction to systems of ordinary differential equations (ODE). The second class consists of exact solutions obtained from classical or nonclassical (Q-conditional) symmetry reductions. It should be pointed out that all the exact solutions presented in the works cited above were found after restricting the dependent density variables to (1+1)-dimensional time-space domains. To the best of our knowledge, there are no known exact solutions of the DLV-type systems in
 $N\ge2$
space dimensions.
For mathematical modelling, some processes in biology and ecology, the variable diffusivity should be used. The porous Fisher equation is a typical example of a scalar field model in that case [Reference Murray30]. In such a case, the corresponding reaction–diffusion system is more complicated, and the problem of constructing exact solutions is highly non-trivial, especially if one considers a real-world model in (1+2)- or higher dimensional time space. Some examples in (1+1)-dimensional time space are summarised in books [Reference Cherniha and Davydovych10, Reference Polyanin and Zaitsev36]. In this paper, we concentrate on the systems with variable diffusivities in (1+2)-dimensional time space. That is particularly appropriate for population densities of the many species whose range of movement in the vertical direction is relatively insignificant.
General reaction–diffusion systems with nonlinearity in both reaction and diffusion offer more general possibilities for their solving via symmetry-based approaches. One pathway to explore those is to examine if known nonclassical and conditional symmetries of scalar equations can be extended to coupled vector systems.
The notions of conditional and nonclassical symmetries, originating most prominently in the works of Bluman and Cole [Reference Bluman and Cole2], Fushchych [Reference Fushchych20, Reference Fushchych, Serov and Chopyk21], Olver [Reference Olver and Rosenau33], Winternitz [Reference Levi and Winternitz28] and their co-authors, eventually opened up the possibility of new reductions and solutions to practical partial differential equations that could not be obtained by Lie’s classical algorithm. Notably, techniques like the method of differential constraints of Yanenko [Reference Sidorov, Shapeev and Yanenko38], the direct reduction method of Clarkson and Kruskal [Reference Clarkson and Kruskal18] and some others (see for details Chapter 5 of book [Reference Cherniha, Serov and Pliukhin17]), which are not based on symmetries, also can help in constructing new non-Lie solutions for nonlinear PDEs arising in real-world applications.
In [Reference Goard and Broadbridge22], we found a class of scalar nonlinear reaction–diffusion equations in 2+1 dimensions with a simple nonclassical symmetry that enables reduction to a pair of separated linear equations.
 \begin{equation}\frac{\partial\theta}{\partial t}=\nabla\cdot[D(\theta)\nabla\theta]+R(\theta).\end{equation}
In terms of the Kirchhoff flux potential
 \begin{eqnarray}\mu &=& \int _{\theta_j}^\theta D(\theta) d\theta, \end{eqnarray}
 \begin{eqnarray}\frac {1}{D(\theta(\mu))}\frac{\partial\mu}{\partial t}&=&L\mu+R(\theta(\mu)),\end{eqnarray}
where L is the 2D Laplacian operator. A solution of the form
 \begin{equation}\mu=e^{At}F({\bf x});\;\;\;LF({\bf x})+\kappa F=0,\end{equation}
satisfying a Helmholtz equation is compatible with (1.1) if and only if the nonlinear diffusivity and nonlinear reaction term are related by
 \begin{equation}R(\theta)=\kappa\mu+\frac{A\mu}{D}.\end{equation}
If
 $D(\theta)$
is known, then the compatible
 $R(\theta)$
follows by direct integration as in (1.2). In many applications, it is more important to specify
 $R(\theta)$
after which (1.5) must be solved as a differential equation for
 $\mu(\theta)$
; subsequently,
 $D(\theta)=\mu'(\theta)$
. In practice, exact pairs
 $(D_{(n)},R_{(n)})$
are obtained by a small number of iterations of the converging contraction map
 \begin{equation}D_{(n+1)}=\frac{A\int D_{(n)} d\theta}{R-\kappa\int D_{(n)} d\theta};\;\;D_{(0)}=-A/\kappa ,\end{equation}
after which
 $R_{(n+1)}$
is obtained from
 $D_{(n+1)}$
as in (1.5).
In practice, this device works in any number of spatial dimensions and the Laplacian L may be generalised to any linear differential operator acting on smooth functions of
 ${\bf x}\in \mathbb R^n$
. In [Reference Broadbridge, Bradshaw-Hajek and Triadis3], we produced the only known exact solutions of temperature with Arrhenius combustion and diffusion in two and three dimensions. In [Reference Broadbridge and Bradshaw-Hajek4], we produced most of the very few known exact solutions for a diffusing population with the Verhulst logistic growth term or for a diffusing new competitive gene through a diploid population with cubic Huxley growth that arises from the Mendelian diploid inheritance. In [Reference Broadbridge, Daly and Goard5], using the Kirchhoff operator
 $L=\nabla^2-\alpha \frac{\partial}{\partial z}$
, we solved for water content in unsaturated soil subject to plant root uptake. In [Reference Broadbridge, Triadis, Gallage and Cesana6], we took L to be a fourth-order Cahn–Hilliard diffusion operator to solve for phase bands in a solid/liquid mixture. In [Reference Hajek and Broadbridge23], we took L to be a variable-coefficient diffusion operator to solve for calcium diffusion on the spherical surface of a fertilised egg.
Now we begin to extend this formalism to isotropic coupled reaction–diffusion equations. We are primarily interested in two coupled systems including those with cross-diffusion that have various applications such as coupled heat and mass transfer, population ecology and activator/inhibitor enzymes for embryo morphogenesis. However, the same approach applies to any number of coupled equations.
In Section 2, the nonclassical reduction method is developed for two coupled reaction–diffusion equations. Nonclassical reductions allow for a much more general class of reaction terms, and the method can be generalised on the multi-component systems in a straightforward way.
In Section 3, exact oscillatory-in-time solutions with spatial dependence are provided for a cross-diffusion pursuit model with reaction terms that have similar properties to those of the classic DLV predator–prey system. In this case, the flux potentials are additively separable. The original Lotka–Volterra system was a pair of coupled ODE [Reference Lotka29, Reference Volterra39], not allowing for spatial variability in population densities. The extension of modified Lotka–Volterra systems to a pair of partial differential equations has been well studied. However, exact solutions with non-trivial variation in both space (especially in 2D case) and time have been elusive.
In Section 4, another system of the modified Lotka–Volterra class, with multi-variate diffusion coefficients, is solved in the case of monotonic time-dependent populations. This model follows from flux potentials that are multiplicatively separable.
Finally, in the conclusion, the progress is recapped, unsolved problems are identified and future investigations are suggested.
2. Two coupled reaction–diffusion equations
Let us consider the two-component system of reaction–diffusion equations
 \begin{equation}\frac{\partial\theta_j}{\partial t}=\frac{\partial}{\partial x^m}\left[{D_j}^k(\theta)\frac{\partial\theta_k}{\partial x^m}\right]+R_j({\bf \theta});\quad j,k=1,2;\; m=1,...,N.\end{equation}
Hereafter
 $\theta=(\theta_1,\theta_2)$
is an unknown vector function, and
 ${D_j}^k$
and
 $R_j$
are given smooth functions and repeated indices will be summed. We also assume that the diffusion matrix
 $D=({D_j}^k)$
is nonconstant and invertible, i.e. the nonconstant matrix
 $D^{-1}$
does exist.
The flux density
 $ {\bf J}^p$
of each population labelled
 $p=1,2$
will be assumed to be the gradient of a potential function,
 \begin{eqnarray}{\bf J}^p&=&-\nabla \mu_p(\theta_1,\theta_2)\end{eqnarray}
 \begin{eqnarray}&=&-\frac{\partial \mu_p}{\partial \theta_q}\nabla\theta_q\end{eqnarray}
 \begin{eqnarray}\quad\, &=&-D_p\;^q(\theta)\nabla\theta_q.\end{eqnarray}
The condition for
 $d\mu_p$
to be an exact differential is simply
 \begin{equation*}\frac{\partial }{\partial \theta_k}\frac{\partial \mu_p}{\partial \theta_j}-\frac{\partial }{\partial \theta_j}\frac{\partial \mu_p}{\partial \theta_k}=0\end{equation*}
which is equivalent to
 \begin{equation}\frac{\partial}{\partial \theta_k}D_p\;^j=\frac{\partial}{\partial \theta_j}D_p\;^k.\end{equation}
In terms of the flux potentials, the system of reaction–diffusion equations is
 \begin{equation}{(D^{-1})_q}^p\frac{\partial\mu_p}{\partial t}=\frac{\partial \theta_q}{\partial t}=\nabla^2\mu_q+R_q({\bf\theta}({\bf \mu})).\end{equation}
Such a general system may be either parabolic or hyperbolic in character. The latter case occurs when the diffusion matrix has pure imaginary eigenvalues. The only known fully integrable example is
 \begin{eqnarray}\nonumber\frac{\partial u}{\partial t}=-\frac{\partial^2 v}{\partial x^2}+s(u^2+v^2)v,\\[5pt]\frac{\partial v}{\partial t}=\frac{\partial^2 u}{\partial x^2}-s(u^2+v^2)u.\end{eqnarray}
In terms of the complex wave function
 $\psi=u+iv$
, this is equivalent to the nonlinear Schrödinger equation,
 \begin{equation*}i\frac{\partial\psi}{\partial t}=-\frac{\partial^2\psi}{\partial x^2}+s|\psi|^2\psi.\end{equation*}
Beyond the integrable 2-vector equation in one space dimension, there is a conditionally integrable vector equation with any number N of independent spatial variables, for which an exact time-dependent solution can be constructed from any solution of the linear matrix Helmholtz equation in N-dimensional space.
Beginning with a single scalar equation, wherein all indices p and q in the above are 1, (1.5) is the relation between nonlinear reaction rate and nonlinear diffusivity that allows the reaction diffusion equation to have a nonclassical symmetry with invariant surface condition [Reference Goard and Broadbridge22]
 \begin{equation*}\mu_t=A\mu .\end{equation*}
A reduced relationship among invariants
 $\mu e^{-At}$
and
 $\bf x$
then results in (1.4). It becomes apparent that this algebraic construction still applies when
 $\mu=(\mu_1,\mu_2)$
is a vector, R is a vector, A is a constant square matrix and
 $\kappa$
is extended to a constant square matrix M.
 $e^{At}$
is defined in the usual way as a Taylor series
 \begin{equation*}e^{At}=I+\sum_{n=1}^\infty \frac{(tA)^n}{n !}\end{equation*}
after which we can take matrix components. For example, if A is skew symmetric, then
 $e^{At}$
is orthogonal. The system of coupled reaction–diffusion equations is
 \begin{equation}D^{-1}\frac{\partial \mu}{\partial t}=L\mu+{\bf R}.\end{equation}
For the purposes of the current study, L is the Laplacian operator but in future it may be generalised to any linear differential operator on vector-valued functions of vector x. Now suppose that (2.1) allows the reduction
 \begin{eqnarray}\mu_j={(e^{At})_j}^kF_k({\bf x});\end{eqnarray}
 \begin{eqnarray}\nabla^2F_k({\bf x})+{M_k}^jF_j({\bf x})=0,\end{eqnarray}
i.e.
 \begin{eqnarray}\mu=e^{At}{\bf F}({\bf x}),\end{eqnarray}
 \begin{eqnarray}\nabla^2{\bf F}({\bf x})+M{\bf F}({\bf x})=0,\end{eqnarray}
where A and M are constant matrices. Following that reduction,
 \begin{eqnarray}\nonumber D^{-1}Ae^{At}{\bf F}&=&\nabla^2e^{At}\bf{F}+{\bf R}\\[5pt]\nonumber&=&e^{At}\nabla^2{\bf F}+{\bf R}\\[5pt]&=&-e^{At}M{\bf F}+{\bf R}.\end{eqnarray}
From here, we need to also assume the commutation property
 $[A,M]=0$
, after which (2.13) reduces to a constraint among the modelling functions
 $D(\mu)$
and
 $R(\mu)$
,
 \begin{equation}D^{-1}A{\mu}=-M{\mu}+{{\bf R}}.\end{equation}
Given that constraint, the system of reaction–diffusion equations is compatible with
 $\mu_t=A \mu$
, which may be regarded as the invariant surface condition of a nonclassical symmetry generated by
 \begin{equation} \Gamma=\frac{\partial}{\partial t} +A_1^j\mu_j\frac{\partial}{\partial\mu_1}+A_2^j\mu_j\frac{\partial}{\partial\mu_2} \equiv \frac{\partial}{\partial t} +(A\mu)\frac{\partial}{\partial\mu},\end{equation}
where
 $ \mu=(\mu_1, \mu_2)$
and
 $ \frac{\partial}{\partial\mu}=\Big(\frac{\partial}{\partial\mu_1},\frac{\partial}{\partial\mu_2}\Big)$
. It can be checked that having the matrix A satisfying (2.14), the second prolongation of
 $\Gamma$
leaves invariant the system of PDEs consisting of (2.6) together with the vector invariant surface condition. So, operator (2.15) is the nonclssical (Q-conditional) symmetry. On the other hand, this operator does not satisfy the classical Lie criteria to be a Lie symmetry. It can happen only for systems of the form (2.6) in exceptional cases. For example, assuming that the matrix D is diagonal, all such systems can be identified from paper [Reference Cherniha and King16] (see cases 3 and 6 in Table 1 therein). It can be noted that all those reaction–diffusion systems possess inappropriate structure for real-world applications.
In general, sets of nonclassical symmetries do not form a Lie algebra and they cannot be integrated to a Lie group. However, in this case of a one-parameter symmetry, invariant solutions are of the form
 $\mu=e^{At}{\bf F}(x)$
and they are certainly invariant under
 \begin{equation*}\bar\mu=e^{\epsilon A}\mu=\mu+\epsilon A\mu+O(\epsilon^2);\;\;\bar t=t+\epsilon;\;\;\;\;\bar {\bf x}= {\bf x}. \end{equation*}
Of course that transformation has no nontrivial action unless it acts on the wider class of non-invariant solutions.
Solutions for the flux potentials
 $\mu_p(x,t)$
can be obtained by solving the linear Helmholtz system (2.12). Solutions
 $\theta_q(x,t)$
of the reaction–diffusion system can be obtained from the flux potentials provided the Jacobian matrix
 $\partial \mu_p/\partial \theta_q$
is invertible. That Jacobian is simply the diffusivity matrix
 $D_p^{\; q}$
.
Given the flux potential functions
 $\mu_p(\theta)$
and the consequent diffusivity functions
 ${D_j}^k(\theta)$
, the partnering reaction terms
 $R_j({\bf\theta})$
can be determined explicitly from the constraint. On the other hand if the two reaction terms are specified, then (2.14) is a system of two first-order partial differential equations for the partnering potentials
 $\mu_p(\theta_k)$
that in general will be difficult to solve exactly. Even in the scalar case, the ODE for partnering D from R is a difficult Abel equation.
We first consider
 $A_1^{\;2}=-A_2^{\;1}=1$
and
 $A_1^{\;1}=A_2^{\;2}=0$
as that matrix A would generate interesting oscillations in time as it has eigenvalues
 $\pm i$
. For example, phytoplankton and zooplankton populations have been observed to oscillate [Reference Huisman and Weissing24].
A second case of interest would be a diagonal matrix A with negative eigenvalues. This might represent an ecosystem susceptible to species extinction. In this reduction method, one must find the commutant of A, i.e. the set of all matrices M such that
 $MA-AM=0$
. Then construct the most general form of allowable reaction vectors
 \begin{equation*}{\bf R}=D^{-1}A\mu+M\mu.\end{equation*}
Notably, there are many practical applications to heat and mass transport when D has positive eigenvalues (e.g. [Reference Fulford and Broadbridge19]).
3. Oscillatory predator–prey dynamics with spatial structure
The simplest way to satisfy (2.5) is to restrict
 ${D_j} ^k$
to depend on
 $\theta_k$
only. Then
 \begin{equation}\mu_p=\sum_q\int _{\theta_{q0}}^{\theta_q} {D_p}^q(\bar\theta_q) d\bar\theta_q.\end{equation}
When considering 2
 $\times$
2 matrices, it is most convenient to use a real basis of Pauli spin matrices including
 \begin{equation*}I=\left(\begin{array}{c@{\quad}c}1 & 0\\[5pt]0 & 1\end{array}\right),\;\sigma_1=\left(\begin{array}{c@{\quad}c}0 & 1\\[5pt]1 & 0\end{array}\right),\;i\sigma_2=\left(\begin{array}{c@{\quad}c}0 & 1\\[5pt]-1 & 0\end{array}\right),\;\sigma_3=\left(\begin{array}{c@{\quad}c}1 & 0\\[5pt]0 & -1\end{array}\right).\end{equation*}
Using that basis it can easily be shown that for any non-singular matrix
 $A\ne m_0I$
, every member M of the commutant of A must be of the form
 \begin{equation}M=m_0I+bA\end{equation}
with
 $m_0,b\in \mathbb R.$
Skew symmetric A will have pure imaginary eigenvalues. This will lead to sinusoidal oscillations among the Kirchhoff variables
 $\mu_j$
. In this section, it will be assumed that
 $A=ai\sigma_2$
,
 $a>0$
. Since
 $i\sigma_2$
is a square root of
 $-I$
,
 $e^{At}=\cos (at)I +\sin(at)A$
so that
 \begin{eqnarray}\nonumber\mu_1(x,t)=F_1(x)\cos at+F_2(x)\sin at,\\[5pt]\mu_2(x,t)=-F_1(x)\sin at+F_2(x)\cos at.\end{eqnarray}
Although solutions
 $\mu_j$
oscillate through positive and negative values, population densities
 $\theta_i$
cannot take negative values. Therefore, the fixed point at
 $\mu_i=0$
must correspond to positive-valued populations
 $\theta_i=k_i$
(hereafter the index
 $i=1,2$
).
Individuals of intelligent species do not move aimlessly but they respond to locations of other species in their food chain. Consider a predator–prey system in which the flux densities of predators and prey are, respectively
 \begin{equation}{\bf J}^1=-\nabla\mu_1;\;\;\mu_1=d_{12}(\theta_2^{\lambda_2}-k_2^{\lambda_2})/\lambda_2\end{equation}
and
 \begin{equation} {\bf J^2}=-\nabla\mu_2;\;\;\mu_2=d_{21}(\theta_1^{\lambda_1}-k_1^{\lambda_1})/\lambda_1\end{equation}
with
 $\lambda_j>0,\;k_j>0,\; d_{12}<0$
and
 $d_{21}>0$
. This means that predators will migrate towards higher densities of prey, whereas prey will migrate away from higher densities of predators.
This leads to a power-law cross-diffusion matrix
 \begin{equation} D=\left(\begin{array}{c@{\quad}c}0 & d_{12}\theta_2^{\lambda_2-1}\\[5pt]d_{21}\theta_1^{\lambda_1-1} & 0\end{array}\right).\end{equation}
Choose
 $M=0$
and
 $A=i\sigma_2$
. The consistency relations (2.14) for the nonclassical reduction require
 \begin{equation}\left(\begin{array}{c}R_1\\[5pt]R_2\end{array}\right)=\frac{1}{d_{12}d_{21}}\left(\begin{array}{c@{\quad}c}0 & d_{12}\theta_1^{1-\lambda_1}\\[5pt]d_{21}{\theta_2}^{1-\lambda_2} & 0\end{array}\right)\left(\begin{array}{c}\mu_2\\[5pt]-\mu_1\end{array}\right).\end{equation}
In order to have non-singular reaction terms
 $R_j$
that depend on both populations,
 $\lambda_j\in (0,1).$
A particular amenable model occurs when
 $\lambda_1=\lambda_2=\frac 12$
, leading to the system
 \begin{eqnarray}\nonumber\frac{\partial \theta_1}{\partial t}=2d_{12}\nabla^2 \theta_2^{1/2}+2\frac{d_{12}}{d_{21}}k_2^{1/2}\theta_1^{1/2}-2\frac{d_{12}}{d_{21}}\theta_1^{1/2}\theta_2^{1/2},\\[5pt]\frac{\partial \theta_2}{\partial t}=2d_{21}\nabla^2 \theta_1^{1/2}-2\frac{d_{21}}{d_{12}}k_1^{1/2}\theta_2^{1/2}+2\frac{d_{21}}{d_{12}}\theta_2^{1/2}\theta_1^{1/2}\end{eqnarray}
(we remind the reader that it was assumed earlier
 $d_{12}<0$
and
 $d_{21}>0$
). The reaction terms here are comparable to those of the standard Lotka–Volterra predator–prey system which has
 $R_1=-p_1\theta_1+s_1\theta_1\theta_2$
for the predator and
 $R_2=p_2\theta_2-s_2\theta_1\theta_2$
for the prey. After the transformation
 $\phi_i=\sqrt \theta_i$
, the steady states for
 $\phi_i(x)$
are exactly the same as those of the standard diffusive Lotka–Volterra system. While the stability status of those steady states will be the same, the growth and decay rates of perturbations will be significantly different. For the standard Lotka–Volterra model, in the absence of predators, the prey population has unrestricted exponential growth due to a constant logarithmic growth rate
 $\frac{\partial\theta_2}{\partial t}/\theta_2=p_2$
. Although in the current power-law model, in the absence of predators the prey population still has no bounding carrying capacity, growth in this case is more realistic as the logarithmic growth rate approaches zero as
 $\theta_2$
increases:
 \begin{equation}\frac{1}{\theta_2}\frac{\partial\theta_2}{\partial t}={2}\frac{|d_{21}|}{|d_{12}|}k_1^{1/2}\theta_2^{-1/2}.\end{equation}
With
 $M=0$
,
 $F_j(x)$
can be any harmonic functions (see (2.12)). Having the correctly-specified harmonic functions, the functions
 $\mu_j( x,t)$
are then given explicitly by (3.3). Therefore, the functions
 $\theta_j$
can be found as the explicit functions of (x, t):
 \begin{eqnarray}\nonumber\theta_1(x,t)&=&\left(\frac{\mu_2}{2d_{21}}+ k_1^{1/2} \right)^2,\\[5pt]\theta_2(x,t)&=&\left(\frac{\mu_1}{2d_{12}}+ k_2 ^{1/2}\right)^2.\end{eqnarray}
The variables may be made dimensionless by choosing length scale
 $\ell_s=k_2^{-1/2}$
(mean separation between prey at equilibrium) and time scale
 $t_s=a^{-1}$
(period of oscillation divided by
 $2\pi$
). Then in terms of dimensionless variables,
 \begin{eqnarray*}\tilde\mu_1=2\tilde d_{12}\left[\tilde\theta_2^{1/2}-1\right]\\[5pt]\tilde\mu_2=2\tilde d_{21}\left[\tilde\theta_1^{1/2}-\left(\frac{k_1}{k_2}\right)^{1/2}\right],\end{eqnarray*}
with
 $\tilde\mu_m=a^{-1}\mu_m$
,
 $\tilde d_{ij}=a^{-1}k_2^{1/2}d_{ij}$
and
 $\tilde\theta_i=\theta_i/k_2$
.
3.1. Example of an exact solution describing the prey–predator interaction
Now we present an example, which describes the prey–predator interaction based on the nonlinear model (3.8). Obviously,
 $(k_1, k_2)$
is a steady-state point of (3.8). It can be checked that it is a center similarly to the case of the standard predator–prey system. For simplicity, we assume
 $k_1/k_2=1$
, then specify this point as
 $(\tilde\theta_1,\tilde\theta_2)=(1, 1)$
in what follows and set
 $-\tilde d_{12}=\tilde d_{21}=1/2$
, i.e. after neglecting the tilde in the dimensionless form of (3.8), we examine the system
 \begin{eqnarray}\nonumber\frac{\partial \theta_1}{\partial t}=-\nabla^2 \theta_2^{1/2}-2\theta_1^{1/2}+2\theta_1^{1/2}\theta_2^{1/2},\\[5pt]\frac{\partial \theta_2}{\partial t}=\nabla^2 \theta_1^{1/2}+2\theta_2^{1/2}-2\theta_2^{1/2}\theta_1^{1/2}.\end{eqnarray}
Let us specify also the domain, in which two populations interact as
 \begin{equation*}\Omega=\left\{ (t,x_1,x_2) \in [0,+ \infty )\times(0, \pi)^2\right\}.\end{equation*}
Assuming the zero flux conditions on the boundaries, excepting the piece
 $x_2=0$
, where the densities of both populations can be artificially regulated as periodic functions in time, we arrive at the boundary conditions
 \begin{eqnarray}\nonumber & x_1 &=0 \;:\; \frac{\partial \theta_1}{\partial x_1}=0, \;\;\frac{\partial \theta_2}{\partial x_1}=0, \\[5pt]&x_1&=\pi \;:\; \frac{\partial \theta_1}{\partial x_1}=0, \;\; \frac{\partial \theta_2}{\partial x_1}=0,\qquad\qquad \end{eqnarray}
 \begin{eqnarray} \quad \nonumber & x_2 &=0\;:\; \, \frac{\partial \theta_1}{\partial x_2}=0, \;\; \frac{\partial \theta_2}{\partial x_2}=0, \\[5pt]\nonumber&x_2&=\pi\;:\; \, \theta_1 = (\!-\!f_1\sin t+f_2\cos t + 1)^2,\\[5pt] &\;\;& \;\;\;\;\;\;\;\; \theta_2 = (f_1\cos t +f_2\sin t+ 1)^2,\end{eqnarray}
where
 $f_1(x_1)$
and
 $f_2(x_1)$
are given functions.
Remark 1. The reaction–diffusion system (3.11) in terms of the functions
 $\mu_1$
and
 $\mu_2$
takes the form
 \begin{eqnarray}\nonumber(1-\mu_1)\frac{\partial \mu_1}{\partial t}=-\frac{1}{2}\nabla^2 \mu_2+\mu_2(1-\mu_1),\\[5pt](1+\mu_2)\frac{\partial \mu_2}{\partial t}=-\frac{1}{2}\nabla^2 \mu_1-\mu_1(1+\mu_2),\end{eqnarray}
and its nonclassical symmetry reads as (see (2.15))
 \begin{equation*}\frac{\partial}{\partial t} +\mu_2\frac{\partial}{\partial\mu_1} -\mu_1\frac{\partial}{\partial\mu_2}.\end{equation*}
The latter is purely nonclassical symmetry because system (3.14) does not admit
 $\mu_2\frac{\partial}{\partial\mu_1} -\mu_1\frac{\partial}{\partial\mu_2}$
as a Lie symmetry (it can be easily checkeed by straightforward calculations).
In order to construct the exact solution of (3.11) that satisfies the boundary conditions (3.13), we need to solve the linear boundary value problem
 \begin{eqnarray}\nabla^2 F_1=0, \, \nabla^2 F_2=0,\end{eqnarray}
and
 \begin{eqnarray}\nonumber x_1=0\;:\;\, \frac{\partial F_1}{\partial x_1}=0, \, \frac{\partial F_2}{\partial x_1}=0, \,x_1=\pi\;:\;\, \frac{\partial F_1}{\partial x_1}=0, \, \frac{\partial F_2}{\partial x_1}=0, \\[5pt]x_2=0\;:\;\, \frac{\partial F_1}{\partial x_2}=0, \, \frac{\partial F_2}{\partial x_2}=0, \,x_2=\pi\;:\;\, F_1 = f_1(x_1), \, F_2 = f_2(x_1).\end{eqnarray}
It can be done using the classical Fourier method. As a result, we arrive at the exact solution
 \begin{eqnarray}F_1= \sum^\infty_{n=0} \frac{a_{1n}}{\cosh (n\pi)} \cos(nx_1)\cosh (nx_2), \, F_2= \sum^\infty_{n=0} \frac{a_{2n}}{\cosh (n\pi)} \cos(nx_1)\cosh (nx_2),\end{eqnarray}
where
 $a_{1n}$
and
 $a_{2n}$
are the Fourier coefficients for the functions
 $f_1$
and
 $f_2$
, respectively. Thus, the explicit expressions for the functions
 $\theta_1$
and
 $\theta_2$
are derived, using formulae (3.3), (3.10) and (3.17).
There are interesting cases when the infinite series degenerate to just one or two term(s) in (3.17). We could set, for example,
 $f_j=\cos(jx_1), j=1,2$
, therefore the expressions in (3.17) take the form
 \begin{eqnarray} F_1= \frac{\cosh(x_2)}{\cosh(\pi)} \cos(x_1), \, F_2= \frac{\cosh (2x_2)}{\cosh(2\pi)} \cos(2x_1). \end{eqnarray}
Thus, inserting the functions
 $F_1$
and
 $F_2$
into (3.3) and using the substitution (3.10), we arrive at the exact solution of the boundary-value problem (3.11)–(3.13)
 \begin{eqnarray}\nonumber\theta_1 = \Big(1 - \frac{\cosh(x_2)}{\cosh(\pi)} \cos(x_1)\sin t+ \frac{\cosh (2x_2)}{\cosh(2\pi)} \cos(2x_1)\cos t \Big)^2 \\[5pt]\theta_2 = \Big(1 - \frac{\cosh(x_2)}{\cosh(\pi)} \cos(x_1)\cos t- \frac{\cosh (2x_2)}{\cosh(2\pi)} \cos(2x_1)\sin t \Big)^2. \end{eqnarray}
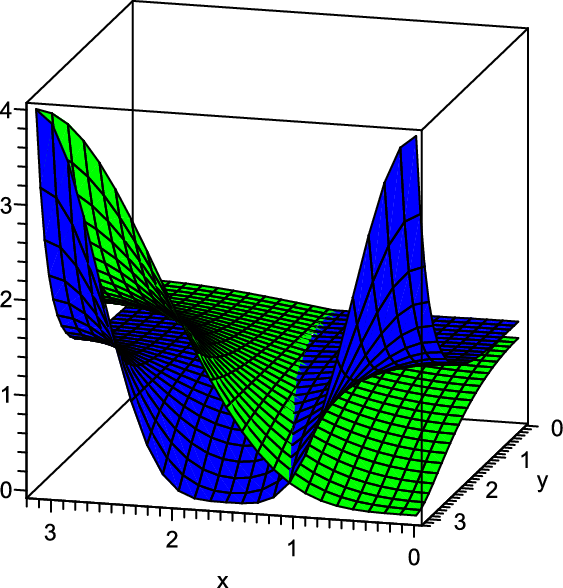
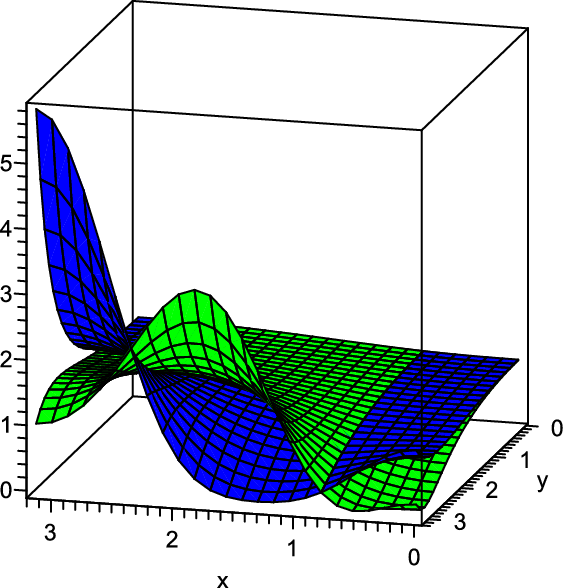
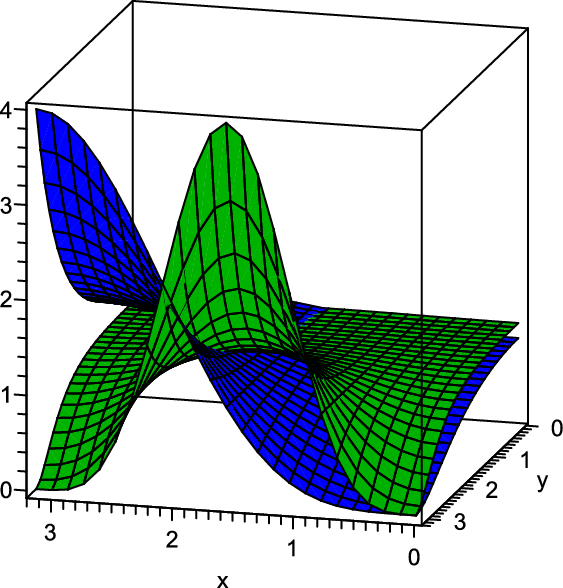
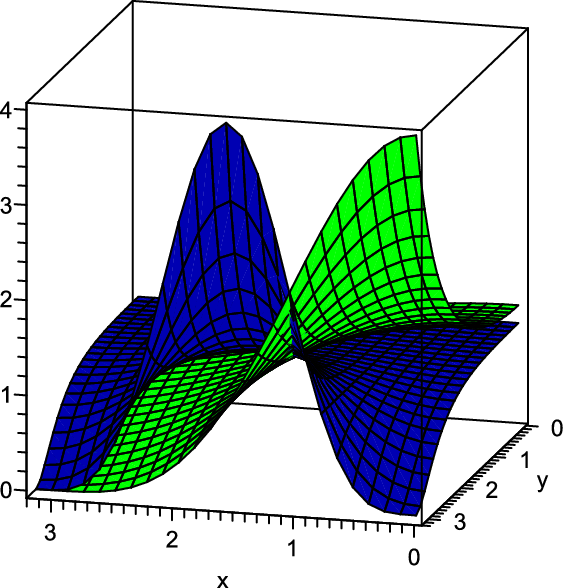
We present the densities
 $\theta_1$
and
 $\theta_2$
in Figures 1, 2, 3 and 4 for the time instants
 $t=0, \ t=\frac{\pi}{4}, \ t=\frac{\pi}{2}$
and
 $t=\pi$
, respectively. The blue surface represents the predator density
 $\theta_1$
, while the green one is for the prey density
 $\theta_2$
.
The exact solution (3.19). The blue and green surfaces represent the non-dimensional predator density
 $\theta_1$
and the non-dimensional prey density
 $\theta_2$
, respectively. Here
 $t=0$
,
 $x=x_1, \ y=x_2$
.

The exact solution (3.19). The blue and green surfaces represent the non-dimensional predator density
 $\theta_1$
and the non-dimensional prey density
 $\theta_2$
, respectively. Here
 $t=\frac{\pi}{4},$
 $x=x_1, \ y=x_2$
.

The exact solution (3.19). The blue and green surfaces represent the non-dimensional predator density
 $\theta_1$
and the non-dimensional prey density
 $\theta_2$
, respectively. Here
 $t=\frac{\pi}{2}$
,
 $x=x_1, \ y=x_2$
.

The exact solution (3.19). The blue and green surfaces represent the non-dimensional predator density
 $\theta_1$
and the non-dimensional prey density
 $\theta_2$
, respectively. Here
 $t=\pi$
,
 $x=x_1, \ y=x_2$
.

3.2. Species trajectories in the Lagrangian formulation of mass transport equations
In the Lagrangian formulation of mass transport equations, the trajectories
 ${\bf x}(t)$
of material particles following the flow, satisfy the system of ODE
 \begin{equation*}\frac{d{\bf x}}{dt}=\frac{{\bf j}({\bf x},t)}{\theta_i({\bf x},t)},\end{equation*}
where j is the mass flux density and
 $\theta_i, \ i=1,2$
are the mass densities. The vector field
 $\frac{\bf j}{\theta_i}$
has the dimensions of velocity, and it is regarded as the local average velocity of a small parcel of matter, in this case a fish. In the current example, since j depends explicitly on time, the flow lines that are integral curves will not be the same as the streamlines at constant t.
In this continuum model, the flow lines of small compact assemblies of fish follow a system of non-autonomous nonlinear differential equations (see equations (3.4)–(3.5))
 \begin{eqnarray}\hbox{Species 1:}\;\;\frac{d{\bf x}}{dt}=\frac{-\nabla\mu_1}{(1+\mu_2)^2},\end{eqnarray}
 \begin{eqnarray}\hbox{Species 2:}\;\;\frac{d{\bf x}}{dt}=\frac{-\nabla\mu_2}{(1-\mu_1)^2}.\end{eqnarray}
In order to illustrate the oscillatory nature of the flow lines, with
 ${\bf x}(t)=(x_1(t),x_2(t))$
, we consider the example
 \begin{eqnarray}\mu_1=\alpha e^{-x_1}\sin (x_2+t),\end{eqnarray}
 \begin{eqnarray}\mu_2=\alpha e^{-x_1}\cos (x_2+t),\end{eqnarray}
with
 $\alpha=0.35$
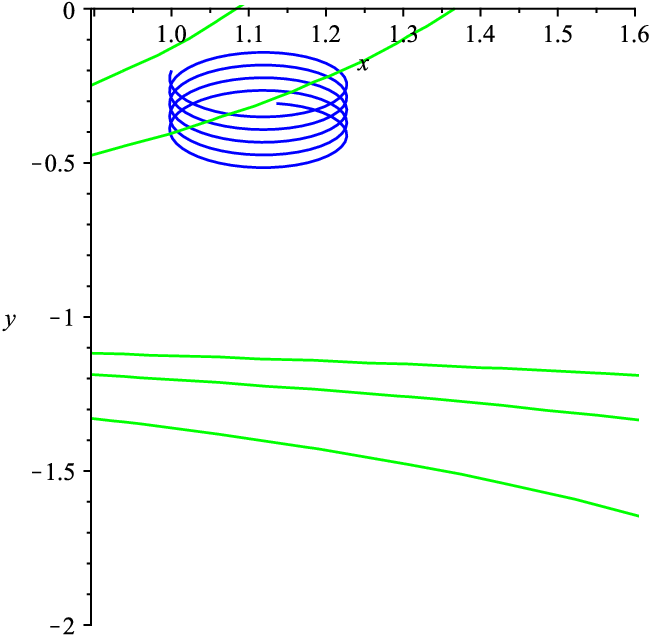
. A time integrated flow line for Species 2, along with some contours for Species 1 density at a particular time, are shown in Figure 5 (the notations
 $x=x_1, \ y=x_2$
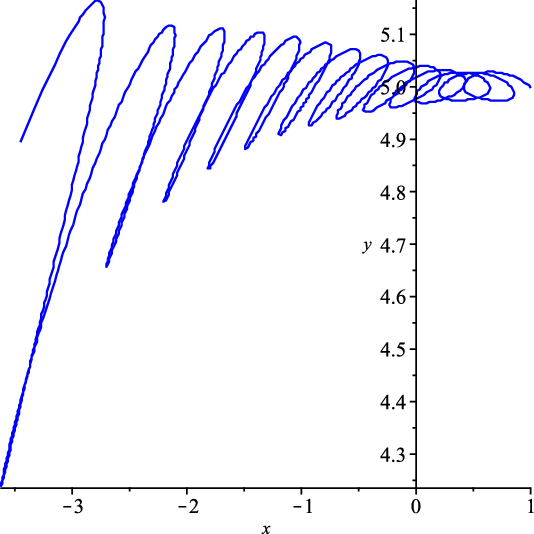
are used in this and the following figures). At each time, the flux vector for predator/prey is normal to the contour line for prey/predator. However those contours are changing in time, resulting in temporal oscillations in the directions of flux vectors. An integrated flow path for Species 1 is shown in Figure 6.
At
 $t=7\pi/3$
, contours of prey Species 2 (in green)
 $\theta_2$
= 0.9, 0.924, 1.01, 1.02,1.04 with flow line of predator Species 1 (in blue) from t = 0 to 30, initial value
 $(x,y)=(1,-0.2)$
.


Finally, we construct a simple example in which
 $F_1$
and
 $F_2$
are the standard velocity potentials of point vortices at locations (0, 0) and (1, 0). Although the separation between the vortices is constant, in the construction of exact solutions, the flux vector of each species oscillates between that controlled by
 $F_1$
and that controlled by
 $F_2$
. Then we take the simple harmonic functions
 \begin{eqnarray}F_1(x_1,x_2)=\frac 1\pi\tan^{-1}\frac {x_1}{x_2},\end{eqnarray}
 \begin{eqnarray}F_2(x_1,x_2)=\frac 1\pi\tan^{-1}\frac{x_1-1}{x_2}.\end{eqnarray}
Then Species 1 (predator) flow lines are the integral curves of the ODE system
 \begin{eqnarray}\nonumber\frac{dx_1}{dt}=\pi\left[\frac{-x_2\cos t}{x_1^2+x_2^2}-\frac{x_2 \sin t}{(x_1-1)^2+x_2^2}\right]\left[\cos t\tan ^{-1}\frac{x_1-1}{x_2}-\sin t \tan ^{-1}\frac {x_1}{x_2} +\pi\right]^{-2},\\[5pt]\frac{dx_2}{dt}=\pi\left[\frac{x_1\cos t}{x_1^2+x_2^2}+\frac{(x_1-1)\sin t}{(x_1-1)^2+x_2^2}\right]\left[\cos t\tan ^{-1}\frac{x_1-1}{x_2}-\sin t\tan ^{-1}\frac {x_1}{x_2} +\pi\right]^{-2}.\end{eqnarray}
Similarly the Species 2 (prey) flow lines satisfy
 \begin{eqnarray}\nonumber\frac{dx_1}{dt}=\pi\left[\frac{-x_2\cos t}{(x_1-1)^2+x_2^2}+\frac{x_2\sin t}{x_1^2+x_2^2}\right]\left[\sin t\tan ^{-1}\frac{x_1-1}{x_2}+\cos t \tan^{-1}\frac {x_1}{x_2} -\pi\right]^{-2},\\[5pt]\frac{dx_2}{dt}=\pi\left[\frac{-x_1\sin t}{x_1^2+x_2^2}+\frac{(x_1-1)\cos t}{(x_1-1)^2+x_2^2}\right]\left[\sin t\tan^{-1}\frac{x_1-1}{x_2}+\cos t \tan ^{-1}\frac{x_1}{x_2} -\pi\right]^{-2}.\end{eqnarray}
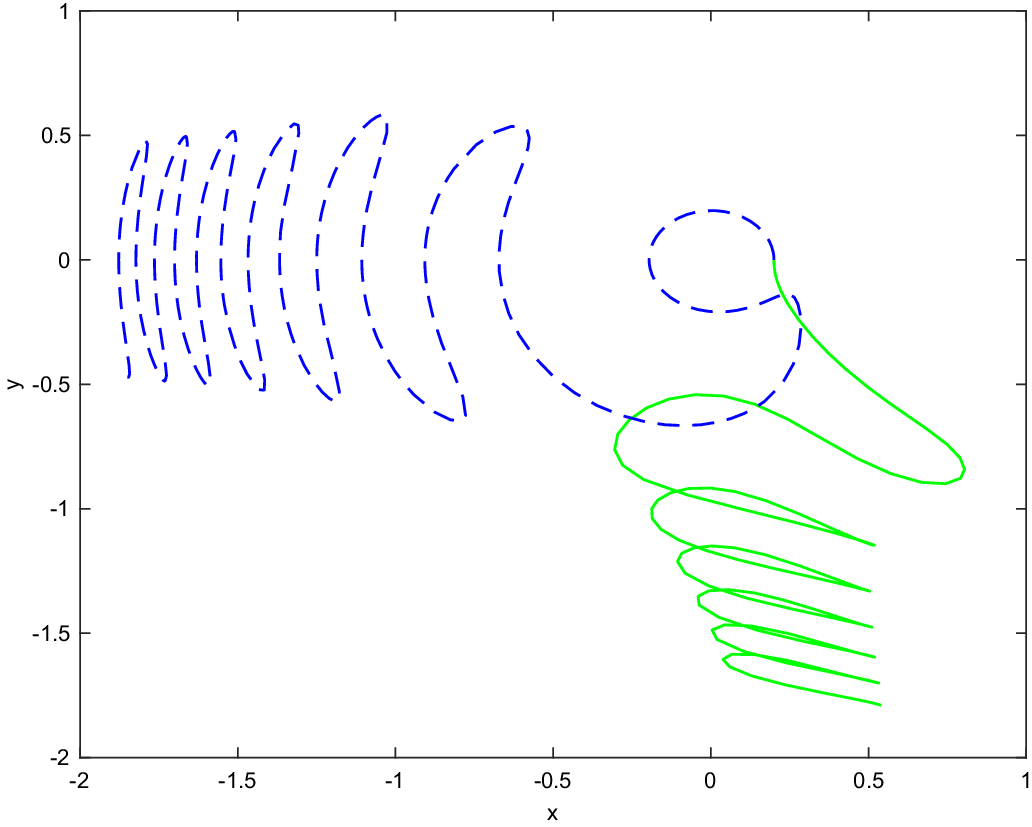
An example of a flow line for each species is given in Figure 7. They were obtained by the ODE solver ODE45 of MATLAB2020b.


4. Solutions with exponential approach to equilibrium point
The previous section began by considering additively separable flux potential functions
 $\mu_i(\theta_1,\theta_2)$
. Meaningful models can also be based on multiplicatively separable potential functions. Choose length scale
 $\ell_s=k_2^{-1/2}$
as before, and time scale
 $t_s=1/|a_2|$
which is the exponential decay time of the prey. Assume that all variables have been non-dimensionalised by using those scales. Consider
 \begin{equation}\tilde\mu_i(\tilde{\theta}_1,\tilde{\theta}_2)=H_i(\tilde\theta_1)G_i(\tilde\theta_2)\;;\;\;i=1,2.\end{equation}
In the following example, we choose
 \begin{eqnarray}\nonumber H_1(\tilde\theta_1) &=& \nu_1\tilde\theta_1^{1/2};\quad G_1(\tilde\theta_2)=1-\tilde\theta_2^{1/2},\\[5pt]H_2(\tilde\theta_1)&=&\tilde\theta_1^{1/2}-\left(\frac{k_1}{k_2}\right)^{1/2};\quad G_2(\theta_2)=\nu_2\tilde\theta_2^{1/2},\end{eqnarray}
where
 $\nu_1>0$
and
 $\nu_2>0$
are dimensionless free parameters. Consider diagonal matrices
 \begin{eqnarray}\tilde A=\left(\begin{array}{c@{\quad}c}a_1/|a_2| & 0\\[5pt]0 & -1\end{array}\right),\end{eqnarray}
 \begin{eqnarray}\;\tilde M=k_2^{-1}\left(\begin{array}{c@{\quad}c}m_1 & 0\\[5pt]0 & m_2\end{array}\right).\end{eqnarray}
The diffusion matrix is
 \begin{equation} \tilde D= \frac{1}{2}\left(\begin{array}{c@{\quad}c}\nu_1\tilde\theta_1^{-1/2}[1-\tilde\theta_2^{1/2}] & -\nu_1\tilde\theta_1^{1/2}\tilde\theta_2^{-1/2}\\[5pt]\nu_2\tilde\theta_1^{-1/2}\tilde\theta_2^{1/2} &\nu_2 \tilde\theta_2^{-1/2}[\tilde\theta_1^{1/2}-(\frac{k_1}{k_2})^{1/2}]\end{array}\right).\end{equation}
The flux densities of the two species are
 \begin{eqnarray}\tilde {\bf J^1}=-\tilde\nabla \tilde\mu_1=\nu_1[\tilde\theta_2^{1/2}-1]\tilde\nabla \tilde\theta_1^{1/2}+\nu_1\tilde\theta_1^{1/2}\tilde\nabla \tilde\theta_2^{1/2},\end{eqnarray}
 \begin{eqnarray}\tilde{\bf J^2}=-\tilde\nabla\tilde\mu_2=\nu_2\left[\left(\frac{k_1}{k_2}\right)^{1/2}-\tilde\theta_1^{1/2}\right]\tilde\nabla\tilde\theta_2^{1/2}-\nu_2\tilde\theta_2^{1/2}\tilde\nabla \tilde\theta_1^{1/2}.\end{eqnarray}
The cross-diffusion terms indicate that Species 1 is the predator and Species 2 is the prey. Species 2 avoids regions of relatively high densities of Species 1, whereas Species 1 is attracted towards regions of relatively higher density of Species 1. In the neighbourhood of
 $\theta=(0,0)$
, the self-diffusion coefficients are positive for the predator and negative for the prey. This may correspond to herding or schooling of prey when predators are scarce.
Now from the constraint (2.14), reduction to the vector linear Helmholtz equation will be possible when
 \begin{eqnarray}\tilde R_1=\tilde m_1\nu_1\tilde\theta_1^{1/2}(1-\tilde\theta_2^{1/2})+2\tilde\theta_1(\tilde\theta_1^{1/2}-\tilde k_1^{1/2})\frac{\tilde a_1(1-\tilde\theta_2^{1/2})-\tilde\theta_2^{1/2}}{\tilde\theta_1^{1/2}+(\tilde k_1\tilde \theta_2)^{1/2}-\tilde k_1^{1/2}},\end{eqnarray}
 \begin{eqnarray}\tilde R_2=\tilde m_2\nu_2\tilde \theta_2^{1/2}(\tilde\theta_1^{1/2}-\tilde k_1^{1/2})-2\tilde\theta_2(1-\tilde\theta_2^{1/2})\frac{(\tilde\theta_1^{1/2}-\tilde k_1^{1/2})+\tilde a_1\tilde\theta_1^{1/2}}{\tilde\theta_1^{1/2}+(\tilde k_1\tilde \theta_2)^{1/2}-\tilde k_1^{1/2}}.\end{eqnarray}
Now we choose
 $m_1<0$
and
 $m_2<0$
so that these reaction functions have several fundamental features in common with those of the Lotka–Volterra system and with those of the pursuit model of the previous section:
(i) the extinction point
 $\theta=(0,0)$
is a uniform fixed point of the system,
(ii) there is exactly one interior uniform fixed point, namely
 $\tilde\theta=(\tilde k_1,1)$
,
(iii) a low prey population has positive (negative) growth when the predator population is below (above) some critical value
 $\tilde k_1$
,
(iv) a low predator population has positive (negative) growth when the prey population
 $\tilde\theta_2$
is above (below) the critical value 1.
This model has the advantage of having an additional fixed point on the zero-predator boundary. In the absence of any predators, the prey population has logistic production rate
 \begin{equation*}\tilde R_2=-\tilde m_2\nu_2 \tilde k_1^{1/2}\tilde\theta_2^{1/2}\left[1+\frac{2}{\tilde m_2 \tilde k_1^{1/2}}\tilde\theta_2^{1/2}\right] =|\tilde m_2|\tilde k_1^{1/2}\tilde\phi_2\left[1-\frac{\tilde\phi_2}{\tilde\theta_c^{1/2}}\right],\end{equation*}
where
 $\phi_2=\sqrt\theta_2$
and the carrying capacity in dimensions
 $L^{-2}$
is
 $\theta_c=\frac{m_2^2 k_1}{4k_2^2}$
.
Now in the neighbourhood of fixed point
 ${\bf \theta}={\bf 0}$
, up to leading order
 $ { \theta_j}^{1/2}$
,
 \begin{eqnarray}\tilde R_1\approx \nu_1\tilde m_1\tilde\theta_1^{1/2}<0,\end{eqnarray}
 \begin{eqnarray}{\tilde R_2}\approx -\nu_2\tilde m_2 \tilde k_1^{1/2}\tilde\theta_2^{1/2}>0.\end{eqnarray}
This implies that with uniform populations, the zero fixed point will be a saddle point. The predator approaches extinction due to lack of prey but the prey have a positive net growth rate.
In the neighbourhood of fixed point
 $(\theta_1,\theta_2)=(k_1,k_2)$
, to leading order in
 $ \theta_j^{1/2}-{ k_j}^{1/2}$
,
 \begin{eqnarray}\tilde R_1\approx |\tilde m_1|\nu_1\tilde k_1^{1/2}(\tilde\theta_2^{1/2}-1){-}2 \tilde k_1^{1/2}(\tilde \theta_1^{1/2}-\tilde k_1^{1/2})\end{eqnarray}
 \begin{eqnarray}\tilde R_2\approx -|\tilde m_2| (\tilde\theta_1^{1/2}-\tilde k_1^{1/2})+2\tilde a_1 (\tilde\theta_2^{1/2}-1).\end{eqnarray}
If
 $a_1$
and
 $a_2$
were zero, the leading terms in
 $R_j$
would lead to this fixed point being a center for uniform population dynamics, just as in the original Lotka–Volterra system. More generally, we allow
 $a_1$
and
 $a_2$
to be negative, resulting in the fixed point being a stable focus for uniform population dynamics, with some inward spiralling orbits due to the cyclic behaviour governed by the
 $m_j$
terms. We avoid positive values of
 $a_j$
that would lead to unbounded dynamics in the region
 $\theta_j>k_j$
. When one considers the dependence of populations on both space and time, small perturbations about the fixed point will satisfy a system of linear partial differential equations, not just a system of linear ODE. We can actually construct some exact solutions of the full nonlinear system that approach the fixed point. The system (2.12) consists of two independent modified Helmholtz equations for which exact solutions are readily available.
In order to construct some exact solutions and provide their possible biological interpretation, we specify some simple parameter values as follows:
 $\nu_1=\nu_2=1$
,
 $\tilde m_1=\tilde m_2=-1$
,
 $\tilde k_1=1$
and
 $\tilde a_1=-1 $
(i.e. equilibrium population densities are equal and exponential decay rates are equal).
Having chosen simple values for the dimensionless parameters, the subsequent solution is for illustrative purposes only and it will be convenient to suspend the tilde notation. Henceforth, the reaction terms (4.8)–(4.9) take the form
 \begin{eqnarray} R_1=\theta_1^{1/2}(\theta_2^{1/2}-1)-2\frac{\theta_1(\theta_1^{1/2}-1)}{\theta_1^{1/2}+\theta_2^{1/2}-1},\end{eqnarray}
 \begin{eqnarray}R_2=-\theta_2^{1/2}( \theta_1^{1/2}-1)-2\frac{\theta_2(\theta_2^{1/2} -1)}{\theta_1^{1/2}+\theta_2^{1/2}-1}.\end{eqnarray}
The non-zero fixed point is (1,1). Exact solutions of the relevant boundary-value problem are now constructed as in Section 3. Notably, the diagonal diffusivities vanish at the steady-state point (1,1) (see (4.5).)
Three of the sides of a rectangular domain will be assumed to be barriers to flow in the normal direction n, so that
 ${\bf n}\cdot\nabla\theta_1={\bf n}\cdot\nabla\theta_2=0$
on each side.
The remaining side will have time-dependent boundary conditions with populations approaching their steady-state values:
 $\theta_1 \to 1, \, \theta_2\to1$
. These boundary conditions are specified as
 \begin{eqnarray}\nonumber x_1=0&:& \, \frac{\partial \theta_1}{\partial x_1}=0, \;\;\frac{\partial \theta_2}{\partial x_1}=0, \\[5pt] x_1=\pi &:& \, \frac{\partial \theta_1}{\partial x_1}=0, \;\; \frac{\partial \theta_2}{\partial x_1}=0,\qquad\qquad\qquad\qquad\qquad \end{eqnarray}
 \begin{eqnarray} \qquad\qquad\qquad \nonumber x_2=0&:& \, \frac{\partial \theta_1}{\partial x_2}=0, \;\; \frac{\partial \theta_2}{\partial x_2}=0, \\[5pt]\nonumber x_2=\pi &:& \, \theta_1=\displaystyle \frac{1}{4}\left[ {1 +e^{- t} (f_1+f_2) \pm \sqrt{[1 +e^{- t} (f_1+f_2)]^2 - 4e^{- t} f_1}} \right ]^2, \\[5pt] x_2=\pi&:& \, \theta_2=\displaystyle \frac{1}{4}\left[ {1 -e^{- t} (f_1+f_2) \pm \sqrt{[1 -e^{- t} (f_1+f_2)]^2 + 4e^{- t} f_2}} \right ]^2,\end{eqnarray}
where
 $f_1( x_1)$
and
 $f_2( x_1)$
are given functions.
In the following, since we are considering solutions in the neighbourhood of the non-zero interior fixed point, we choose the larger root for
 $\theta_1$
(with the + sign alternative). Now we have that
 \begin{equation} \mu_1=\theta_1^{1/2}(1-\theta_2^{1/2}),\;\;\;\mu_2=\theta_2^{1/2}(\theta_1^{1/2}-1), \end{equation}
as well as
 \begin{equation} \mu_1 = e^{- t} F_1( x_1, x_2), \ \ \mu_2 = e^{- t} F_2( x_1, x_2), \end{equation}
where
 \begin{eqnarray} \nabla^2 F_1 -F_1=0, \, \nabla^2 F_2-F_2=0.\end{eqnarray}
The relevant boundary conditions in terms of
 $F_1$
and
 $F_2$
are
 \begin{eqnarray}\nonumber x_1=0&:& \frac{\partial F_1}{\partial x_1}=0, \, \frac{\partial F_2}{\partial x_1}=0, \\[5pt] x_1=\pi&:& \frac{\partial F_1}{\partial x_1}=0, \, \frac{\partial F_2}{\partial x_1}=0, \end{eqnarray}
 \begin{eqnarray} x_2=0&:& \frac{\partial F_1}{\partial x_2}=0, \, \frac{\partial F_2}{\partial x_2}=0, \end{eqnarray}
 \begin{eqnarray} x_2=\pi &:& F_1 = f_1( x_1), \ \ F_2 = f_2( x_1).\ \end{eqnarray}
We solve for
 $F_1$
and
 $F_2$
using the classical Fourier method. As a result, we arrive at the exact solution
 \begin{eqnarray}F_1=\frac{\alpha_0}{2} +\sum^\infty_{n=1} \alpha_n \cos n x_1 \ \cosh(\sqrt{n^2+1} x_2),\end{eqnarray}
where
 $\alpha_n \cosh(\sqrt{n^2+1} \pi) = {2\over \pi} \int_0^\pi \cos nx_1 \ f_1( x_1) \ dx_1.$
Similarly,
 \begin{eqnarray}F_2= \frac{\gamma_0}{2}+\sum^\infty_{n=1} \gamma_n \cos n x_1 \ \cosh(\sqrt{n^2+1} x_2),\end{eqnarray}
where
 $\gamma_n \cosh(\sqrt{n^2+1} \pi) = {2\over \pi} \int_0^\pi \cos nx_1 \ f_2( x_1) \ dx_1.$
Equating (4.18) and (4.19) we have that
 \begin{equation} \theta_1-\theta_1^{1/2}(1+e^{- t}F_1+e^{- t} F_2)+e^{- t}F_1=0, \end{equation}
so that
 \begin{equation} \theta_1=\frac{1}{4}\left[{(1+e^{- t}F_1+e^{- t} F_2)+ \sqrt{(1+e^{- t}F_1+e^{- t} F_2)^2-4e^{- t}F_1}}\right ]^2.\end{equation}
Similarly,
 \begin{equation} \theta_2=\frac{1}{4}\left[{(1-e^{- t}F_1-e^{- t} F_2)+ \sqrt{(1-e^{- t}F_1-e^{- t} F_2)^2+4e^{- t}F_2}}\right ]^2.\end{equation}
Remark 2. If
 $f_1( x_1)= f( x_1)$
and
 $f_2( x_1)=-f( x_1)$
, then
 $\displaystyle \theta_1( t, x_1,\pi)= \theta_2( t, x_1,\pi)= \frac{1}{4}\left (1+ \sqrt{1-4e^{- t}f}\right )^2.$
In order to build from a simple example, we begin with initial uniform values at the open boundary,
 $\theta_1( x_1,\pi, 0)=\frac 12$
and
 $\theta_2( x_1,\pi,0)=\frac 32$
. This corresponds to a predator population initially below its steady value and a prey population initially above its steady value. From (4.18), this corresponds to negative boundary values for
 $F_i$
,
 $f_1( x_1)=(\sqrt 2-\sqrt 3)/2$
and
 $f_2=(\sqrt 3-\sqrt 6)/2$
. From the solution, it can be seen that the populations asymptotically approach their steady-state values 1 everywhere. Since there is no variation in the
 $x_1$
direction, this is so far a one-dimensional problem. It can be made a two-dimensional problem simply by adding other Fourier components in
 $f_i$
. We consider the example with
 \begin{equation*}{f_1(x_1)}=-\frac{1}{2}(\sqrt 3-\sqrt 2)\Big(1+\frac{1}{2}{\cos(2 x_1)}\Big);\;\;{f_2( x_1)}=\left(1-\frac{\sqrt 6}{2}\right){f_1( x_1)}.\end{equation*}
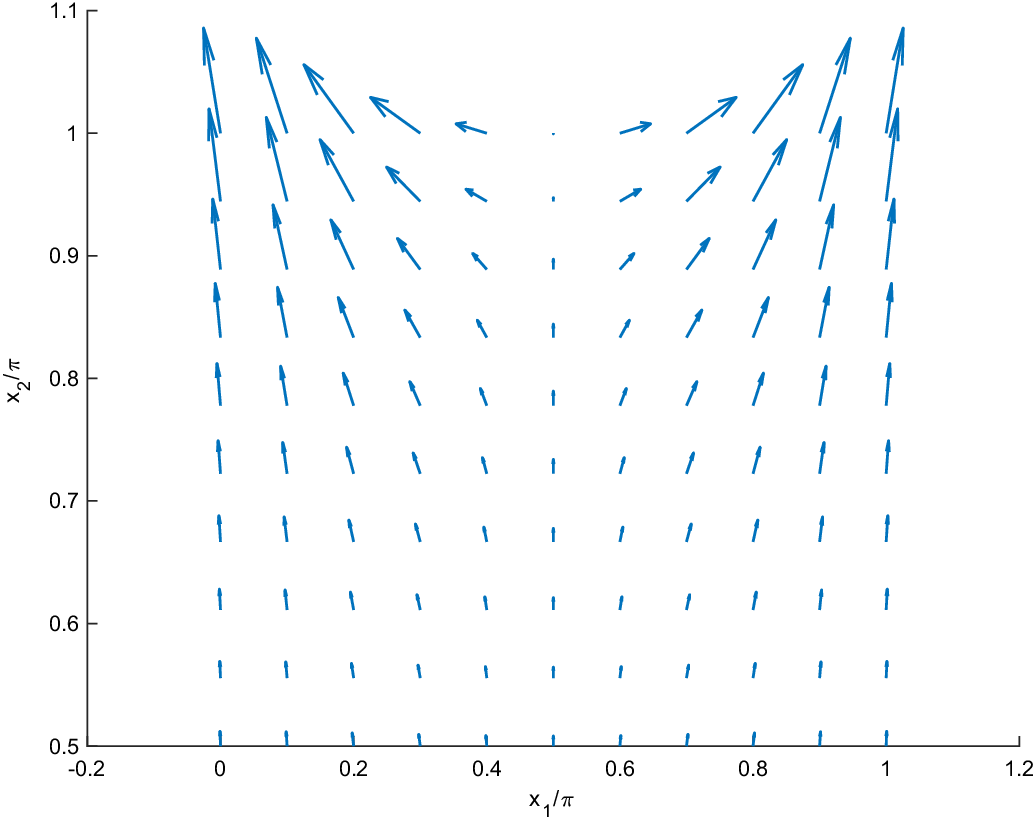
The initial flux vector of the predator in the upper half of the square domain is depicted in Figure 8. In the lower half, fluxes are close to zero. Individuals of the predators and prey initially escape out of the open end of the square holding pen towards the corners. The flux approaches zero as the predator density approaches its steady value 1 from below and the prey density approaches its steady value 1 from above. With
 $m_i<0$
,
 $\mu_i$
satisfies the modified Helmholtz equation. Exact solutions can also be constructed by substituting a pure imaginary valued wave number in many solutions of the usual Helmholtz equation that occurs in acoustic scattering theory (e.g. [Reference Philip34]).
Initial flux vector field for a predator in a square holding pen with one side open.

5. Conclusion
Here we have demonstrated a highly unusual circumstance of a conditionally integrable system of two nonlinear partial differential equations in one time and N space dimensions. Via a nonclassical symmetry, that nonlinear system reduces to a linear system of two coupled Helmholtz equations in N space dimensions. From there we can construct an infinite dimensional linear space of solutions that depend on both space and time, which is a proper sub-manifold within the larger infinite dimensional manifold of solutions of the original nonlinear system.
For purposes of illustration, this paper has focused on coupled nonlinear reaction-diffusion equations in two space dimensions. The technique requires the original nonlinear system to be augmented by one of a 4-parameter set of possible side conditions that relate the nonlinear diffusion matrix to the nonlinear source vector. Exact solutions of diffusive predator–prey systems have been constructed, some that decay towards extinction and some that oscillate or spiral around an interior fixed point. The conditionally integrable systems are closely related to the standard DLV system, but they have some additional features that are advantageous. For example, unlike the standard predator–prey system, the nonclassical reduction method makes available a wide variety of exact solutions that vary in both space and time. For example, when constructing solutions that are oscillatory in time, a different solution can be constructed from any pair of solutions of Laplace’s equation, not necessarily conjugate harmonic pairs. We have explicitly calculated fluxes and densities, analogous to the so-called Euler picture of fluid mechanics. From the Euler picture, we have constructed the alternative Lagrange picture that is a system of nonlinear non-autonomous ODE. Their integral curves, obtained numerically here, are sample paths of individual elements of the predator and prey populations, down to the individual or small group level. These are analogous to the flow lines in fluid mechanics, as opposed to the stream lines that are vector fields that are frozen at a particular time.
Many solutions might be attained by such methods as conformal mapping and classical scattering techniques that apply to the Laplace and Helmholtz systems that are obtained by reduction.
From an imposed nonlinear diffusivity matrix, (2.14) gives a direct construction of compatible source terms in a conditionally integrable model. Unlike in the nonclassical symmetry reduction of a scalar PDE, as yet we know of no simple method to solve (2.14) to obtain a partner diffusion matrix from imposed reaction functions. That is an important problem whose solution would lead to insight on a wide range of physical applications.
As we have previously seen in applications to scalar equations, the target nonlinear PDEs may potentially involve not only reaction and diffusion terms but also convection terms and higher order diffusion. The incorporation of meaningful convection terms in conditionally integrable coupled vector reaction diffusion systems has not been investigated.
Conflict of interests
The authors declare that they have no conflicts of interest relevant to this article.
Acknowledgements
This work is in celebration of the mathematical career of George Bluman whose scientific works, advice and friendship have greatly influenced us.