I. INTRODUCTION
In our previous work,Reference Peng, Berta and Speyer1 the oxidation resistances of ZrB2 containing SiC, TaB2, and TaSi2 additives were studied using isothermal thermogravimetry (TG) at 1200, 1400, and 1500 °C. Higher concentrations of SiC in ZrB2–SiC mixtures resulted in improved oxidation resistance (up to ∼60 mol% SiC) and thinner glassy surface layers, as well as thinner interior layers of ZrO2 mixed with SiO2 and porosity. No layers of ZrB2 depleted of SiC were observed. For low concentrations of SiC, ZrO2 dendrites/needles were observed dispersed in the glassy surface layer. It was interpretedReference Speyer2 that as borosilicate liquid phase formed, soluble zirconia precipitated out in this form as boron oxide volatilized out of the liquid at its surface, consistent with the observations of Karlsdottir.Reference Karlsdottir, Halloran and Grundy3 This zirconia precipitate increased the permeability of oxygen through the glassy layer, facilitating more extensive oxidation and a relatively thick glassy layer. With higher concentrations of SiC, the solubility of zirconia in the more silica rich borosilicate liquid was diminished, ultimately resulting in a thinner glassy layer forming. Small concentrations of TaB2 (3.32 mol%) enhanced the oxidation resistance. TaB2 formed a complete solid solution with ZrB2, the oxidation of which formed a comparatively fine debris of ZrO2 and TaC, which appeared to resist wicking of interpenetrating (boro)silicate liquid phase away to the glassy/liquid surface layer. Higher concentrations of TaB2 resulted in substantially degraded oxidation resistance by facilitating solution and precipitation of zirconia in the glassy surface layer.
Opila et al.Reference Opila and Halbig4 studied ZrB2–20 vol% SiC compositions exposed to cyclic oxidation at 1627 °C. The microstructure consisted of a surface silicate glassy oxide coating, followed by a region of ZrO2 dispersed in silica, which in turn was above a region of ZrB2 depleted of SiC. This region was argued to have resulted from active oxidation of SiC to form SiO(g).Reference Rezaie, Fahrenholtz and Hilmas5 FahrenholtzReference Fahrenholtz6 showed via a thermodynamic volatility diagram that SiC will oxidize to SiO(g) and CO(g) at lower oxygen partial pressures than ZrB2 oxidizes to ZrO2(s) and B2O3(l). Opeka et al.Reference Fahrenholtz6 have suggested that formation of SiO(g) could build up to pressures exceeding ambient, facilitating rupture of the protective glass layer, resulting in a cyclic protective/nonprotective scale forming sequence. In low oxygen partial pressures, formed by CO(g)/CO2(g) mixtures, ZrB2 oxidized to ZrO2(s) and a volatile boron oxide, and SiC oxidized to carbon monoxide and SiO(g). This left a nonprotective (porous) ZrO2 scale.Reference Rezaie, Fahrenholtz and Hilmas8
Studies on the oxidation resistance of ZrB2–SiC two-phase mixtures at temperatures above 1500 °C are limited. Oxidation heat treatments based on zirconia heating elementsReference Han, Hu, Zhang and Meng9, Reference Han, Hu, Zhang, Han and Meng10 or self-heated ribbonsReference Karlsdottir and Halloran11 have been used for the range 1700–1900 °C. Karlsdottir et al. found that after oxidation heat treatment at 1700 °C for 15 min, a thin outermost silica layer formed, followed by a columnar zirconia layer with embedded silicate liquid phase, followed by a SiC-depleted ZrB2 zone, in turn followed by an unreacted core. Han et al.Reference Han, Hu, Zhang and Meng9 found that the oxidation resistance of a ZrB2-20 vol% SiC composition at 1900 °C for 1 h exceeded compositions with either 10 or 30 vol% SiC. Hu et al.Reference Hu, Zhang, Han, Luo and Du12 have shown that (10 vol%) TiB2 or TaB2 additions to ZrB2-20 vol% SiC had markedly detrimental effects on 1800 °C oxidation resistance. With temperatures at and above ∼2000 °C, arc-jet heating has been used to evaluate the ablation resistances of ultrahigh temperature ceramics (UHTCs).Reference Zhang, Hu, Han and Meng13–Reference Monteverde and Savino15 At 2300 °C, a ZrB2–20 vol% SiC composition was unable to resist the simulated aerothermal load.Reference Zhang, Hu, Han and Meng13 Below 2200 °C the oxide scales are similar to those oxidized under static air furnace conditions. Above this temperature, no distinct silica layer was observed, and the outermost layer was composed of a zirconia scale.Reference Zhang, Hu, Han and Meng13 An oxyacetylene torch has also been used to evaluate the resiliance of a ZrB2–SiC composite to the gasous environment created by the torch at a temperature of 2200 °C.Reference Han, Hu, Zhang, Meng and Han16 The testing results are similar to those of arc-jet testing, however a more distinct SiC-depleted zone was observed.
In our previous work, as well as many others, the temperature limitations of commercially available thermogravimetric analyzers (TG) in an oxidizing environment has limited in situ characterization of oxidation resistance to ∼1500 °C. In this work, for selected compositions, that range was expanded to 1900 °C through the use of a zirconia heating element furnace with a water-cooled analytical balance coupled beneath it.
II. EXPERIMENTAL PROCEDURE
Commercially available powders were used for raw materials. The major crystalline phase(s), grade, and suppliers are listed for each powder in Table I. The particle sizes of commercially available TaB2 were deemed too large for pressureless sintering. Hence, sedimentation-based selection was used to obtain finer particles: Powders were dispersed in ethanol using an ultrasonicator (FS-14 Solid State Ultrasonicator, Fisher Laboratory Equipment Division, Pittsburgh, PA) for 10 min. The mixture was allowed to settle in ethanol for 1 h. The top 7 cm (of a total column height of 14 cm) of fluid was then extracted using a pipette. On the basis of laser particle size analysis (model LS 13 320, Beckman Coulter, Fullerton, CA), decanted particles had a d 50 of 1.1 μm. The decanted suspensions were dried in a beaker on a hot plate.
Raw material characteristics.

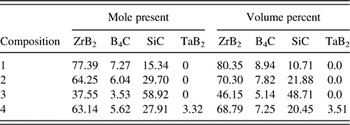
The compositions of synthesized powder mixtures are given in Table II. The powder mixtures were suspended in methanol, and mixed in a ball mill for 24 h, using B4C as media. These powders were then dried in air in a free convection oven at 75 °C. The powders were then ball-milled again in water with dissolved polyvinyl alcohol (PVA, Celanese Ltd., Dallas, TX), polyethylene glycol (PEG, Alfa Aesar, Ward Hill, MA), and Darvan 821A (R.T. Vanderbilt Company Inc., Norwalk, CT), using B4C as media for 8 h. PVA functioned as a binder with PEG functioning as a plasticizer, and Darvan 821A served as a dispersing agent. The highly viscous suspension after this milling step was dried in a free convection oven at 75 °C, and then sieved using a 60-mesh screen.
Sample compositions.

Approximately 400 mg of powder were uniaxially pressed into cylindrical pellets using a maximum pressure of 117 MPa, holding for 1 min. The pellets were loaded into latex encapsulants which were in turn evacuated. These were cold isostatically pressed (CIP) in a water/oil mixture at 345 MPa for 1 min. This was followed by a binder removal heat treatment of 0.25 °C/min to 500 °C under a flowing argon atmosphere. Fifteen pellets were fabricated for each composition.
These pellets were fired in a graphite tube furnace (model M11, Centorr Vacuum Industries Inc., Nashua, NH) under flowing argon, using graphite setters. The furnace was initially evacuated to ∼4 Pa (roughing pump) and backfilled with argon. The typical heating schedule was 50 °C/min to 2100 °C, soaking for 1 h, and then cooling at 40 °C/min to room temperature. The pellets were then hot isostatically pressed (HIP; American Isostatic Press, Columbus, OH) at 1800 °C for 30 min under an argon gas pressure of 207 MPa. The densities of unfired pellets were determined from measured dimensions and mass; the densities of pressureless sintered and post-HIPed pellets were determined using Archimedes’ method. All HIPed specimens were 100% dense based on theoretical densities calculated from the rule of mixtures.
All of the surfaces of the post-HIPed samples were ground away using 320-grit SiC grinding paper (Buehler, Lake Bluff, IL), and the resulting pellet dimensions were measured with calipers, from which surface areas were calculated. Pellets were ∼5.3 mm in diameter and 3–4 mm in height. The oxidation behaviors were then investigated using TG. An analytical balance (model AX205, Mettler-Toledo, Inc., Columbus, OH) with a measurement precision of 0.01 mg was fully encased in a water-cooled aluminum enclosure. The enclosure had a coupling extending from its top that mated with a water-cooled coupling attached to the base of the furnace, which was sealed to and supported a stabilized zirconia tube with a 4.7 cm inner diameter. This tube extended upward through the hot zone of the furnace and continued through the top of the furnace for an additional 35.5 cm into the ambient air. Loose refractory alumina fiber rested at the top of the tube to minimize air turbulence within the tube, which would otherwise disturb the balance reading. A mass flow controller (model GFC 17, Aalborg, Orangeburg, NY), attached to a cylinder of compressed dry air controlled air flow into the enclosure and then through the zirconia tube which in turn extended through the furnace. The furnace (model DT-36-VT 2000 °C vertical tube furnace, Deltech, Inc., Denver, CO) was of cylindrical shape, mounted (cylindrical axis) vertically. Outer radial positions of the furnace were heated using uniformly spaced MoSi2 U-tube heating elements. These were partially insulated from radial positions toward the furnace center by shaped stabilized zirconia bricks. Along still more inner radial positions of the furnace, six symmetrically placed rod-type stabilized zirconia heating elements extended vertically through the furnace. Two independent proportional–integral–derivative (PID) control systems were used, one which brought the furnace temperature up to ∼1300 °C via the MoSi2 elements, at which point power was additionally applied across the semiconducting zirconia elements. The hot zone of the furnace was ∼10 cm along the axial direction, with another 40.5 cm of length extending from the edges of the hot zone to the axial extremes of the furnace. Raising the hot-zone temperature from room temperature to 1900 °C required ∼ 2 days. The furnace was brought to isothermal soak temperatures of 1500, 1600, 1700, 1800, and 1900 °C and held at each of those temperatures while isothermal oxidation experiments were performed on all compositions. Data were collected on a personal computer through rapid polling (using Microsoft Visual Basic 4.0, Microsoft Corp., Redmond, WA) through RS232 communications.
A brass tripod with set-screw feet (for orientation adjustment) was fabricated and placed on the balance stage. Inserted into this was a stabilized yttria-stabilized zirconia (McDaniel Advanced Ceramic Technologies, Beaver Falls, PA) hollow tube (6.3 mm outer diameter, 61 cm long). Placed at the top of the hollow tube were stabilized zirconia crucibles, consisting of a bottom stem, which could be inserted into the stabilized zirconia tube, and a cylindrically shaped partially hollowed cylindrical container. These were fabricated by uniaxially pressing 2-cm cylinders of stabilized zirconia powder (8 mol% Y2O3 stabilized ZrO2, d 50 = 0.5 μm; Inframat Advanced Materials, Manchester, CT) mixed with binder at 125 MPa. These were subsequently loaded into latex bags that were evacuated and sealed, and were then CIPed at 345 MPa. These functioned as blanks for computer numerical control (CNC) machining (model DSLS 3000, Taig Micromill, Chandler AZ) into the aforementioned crucible shape. Binder was extracted from the green parts in static air at a heating rate of 0.5 °C/min to a soak temperature 500 °C, and held for 4 h. These parts were then fired in the same furnace as the oxidation experiments using soak temperatures in the range 1600–1800 °C for 1 h. Specimens for oxidation experiments were placed into these crucibles (on top of zirconia chips lining the bottom of the crucible) so that the axial direction of the disks was horizontal, leaving a portion of the disk within the crucible, and a larger proportion extending above the upper lip of the crucible.
The analytical balance and its enclosure, with the specimen mounted above it, were raised using a foot-pedal-based jack system into the hot zone of the furnace. Specimens were elevated over ∼5 min to raise the sample quickly to its soak temperature, while minimizing the propensity for thermal shock of the stabilized zirconia crucibles and supporting tube. Air flow rate upward through the tube was maintained at 0.1 l/min. Specimen weight change was based on the weight measured by the balance while the specimen was at room temperature. Weight change data during the period of elevating the balance was omitted because the balance measurement was unstable. To evaluate repeatability, 2–3 thermogravimetric oxidation heat treatments were performed on each composition at each soak temperature. Displayed traces are those considered most representative.
TGs show a buoyancy effectReference Speyer17 in which the condensed phases of the specimen, and the structure that holds it up, applies an upward force based on the mass of gas which is displaced (Archimedes principle). As the furnace is heated, this gas expands and the displaced mass decreases, giving the impression of a weight gain on the TG trace. This mass change can be calculated assuming an ideal gas (air), a constant temperature in the hot zone of the furnace, and a linear temperature gradient extending from the edge of the hot zone to the point of exit of the furnace, which is assumed to be at room temperature. For the specimen, crucible, and the hot-zone portion of the hollow tube the crucible is mounted on, the buoyancy mass m was calculated based on
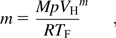
where M is the molar mass of air, p is atmospheric pressure, V H is the volume of the specimen, crucible, and support tube (1032.31 mm3), R is the gas constant, and T F is the hot zone absolute temperature. For the hollow stabilized zirconia tube extending through the linear temperature gradient, the bouoyant mass was calculated based on
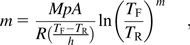
where A is the cross-sectional area of the tube, T R is the absolute room temperature, and h is the height of the portion of the furnace associated with the linear temperature gradient going from room temperature to the hot-zone temperature. The mass of displaced gas at a given hot-zone temperature minus the mass of displaced gas at room temperature was calculated.
Crystalline phases in the samples were identified using x-ray diffraction (XRD; model X’Pert PRO Alpha-1, PANalytical, Almelo, The Netherlands). Scans were recorded at room temperature over a 2θ range of 10–80° at a scan rate of 0.01°/s. XRD of oxidized specimens were taken from cross sections formed via a diamond wafering blade.
Specimens were directly photographed with a digital camera after cross sections were made via a diamond-impregnated wafering blade. Microstructures of oxidized samples were investigated using scanning electron microscopy (SEM; LEO 1530, Carl Zeiss SMT, Inc., Thornwood, NY) and energy dispersive spectrometry (EDS; Oxford Pentafet detector with ultrathin window, Oxford Instruments, Oxfordshire, UK). For displayed micrographs, specimen cross sections were fractured surfaces formed via impact, with the oxidized surfaces mounted on the SEM stub to be parallel with the beam axis. Specimens were coated with gold (sputtering for 2 min) to form a conductive surface. For measurement of layer thicknesses, specimens were cut perpendicular to the oxidized surfaces using a diamond-impregnated wafering blade, and then imaged in the SEM. Separate measurements of the top, sides, and bottom layer thicknesses were recorded. Side thickness measurements were generally averages of measurements from the left and right sides.
III. RESULTS
Initial experiments were performed using an alumina gas flow tube and either alumina stages or crucibles to hold the specimens. Oxidation heat treatment in this study at and above 1700 °C showed substantial reaction of specimens with their containers. For that reason, the furnace was reconstructed so that no alumina was present in the hot zone. All results that follow correspond to oxidation under that configuration.
Phases identified from XRD of oxidized specimen cross sections were ZrB2, SiC, and ZrO2. For compositions in which TaB2 was a batch additive, no distinct TaB2 phase was detected, but a shift in 2θ positions of ZrB2 peaks imply the formation of a ZrxTa1–xB2 solid solution. Trace amounts of ZrC were detected for the composition with ∼60 mol% SiC after oxidation heat treatments at 1600 and 1700 °C. Trace amounts of ZrC were also detected for the composition with ∼3 mol% TaB2 after oxidation heat treatment at 1800 °C.
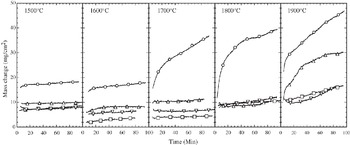
Figure 1 shows TG traces of the compositions exposed to temperatures ranging from 1500 to 1900 °C. At 1500 and 1600 °C, all compositions are roughly grouped together with the exception of ∼15 mol% SiC, which showed a higher initial weight gain, but roughly equal rate of weight gain with time as the other specimens. This was not the case for 1700 to 1900 °C heat treatments; the ∼15 mol% SiC composition gained weight at a comparatively rapid rate, though the rate slowed over the 10–30 min time span. At 1900 °C the ∼30 mol% SiC and ∼28 mol% SiC and ∼3 mol% TaB2 specimens showed a constant and remarkably small weight gain over the evaluated time span. The ∼60 mol% SiC specimen showed an initial rapid rate of weight gain that decreased at longer times. The thermograimetry trace shown for the specimen with ∼60 mol% SiC was altered from the original, which displayed periodic spikes from the popping of bubbles, after which an instantaneous downward shift in mass was recorded. For the trace displayed in Fig. 1, the spikes were deleted and subsequent data were adjusted upward to align with the data before the spikes.
Compilation of TG traces for various isothermal exposures to flowing dry air at the indicated temperatures. Circle: 15.34 mol% SiC; square: 29.74 mol% SiC; upward triangle: 58.92 mol% SiC; downward triangle: 27.91 mol% SiC–3.32 mol% TaB2. In this figure, symbols are used only to identify traces; each TG trace is made up of ∼1000 data pairs.

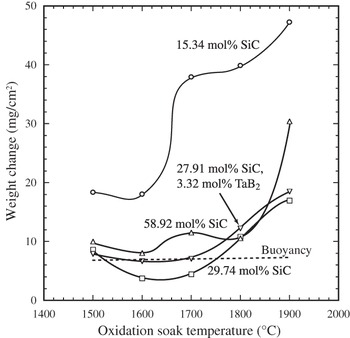
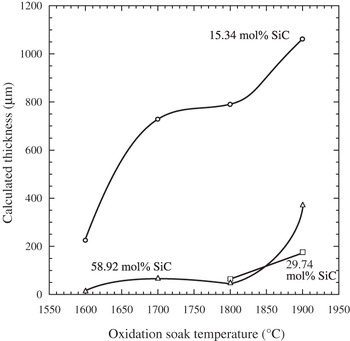
The results of buoyancy calculations are shown in Fig. 2. Also shown in this figure is a summary of the results in Fig 1 by comparing the mass change after 100 min of exposure at the various soak temperatures. Accounting for buoyancy effects, a weight loss for the specimen with ∼30 mol% SiC occurred after heat treatments at 1600 and 1700 °C. Using the weight loss (per unit surface area) in Fig. 2, the thickness of a ZrO2/SiO2 oxide coating was calculated (Fig. 3) on the basis of on equations developed in the Appendix. Weight losses used in the calculation were based on the differences between measured values after 100 min and the weight change associated with buoyancy for a given temperature.
Weight change of various compositions exposed to flowing air at various temperatures after 100 min of oxidation. Extrapolated values were used for oxidations that were completed before 100 min. Experimental data are not corrected for buoyancy effects, which are separately displayed in the figure (dashed line).

Oxide coating thicknesses based on measured weight losses.

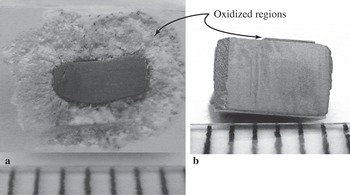
The oxidation resistances of all specimens except ∼15 mol% SiC are remarkably good. The substantial difference between oxidation resistances of specimens with ∼15 mol% SiC and ∼30 mol% SiC is visually apparent when the oxidation scale was examined in cross section (Fig. 4). With ∼15 mol% SiC [Fig. 4(a)] the extensive oxidation product layer is mostly zirconia (based on EDS analysis of this region of the specimen in the SEM) with a small concentration of silica, in the region nearest to unreacted ZrB2/SiC. The specimen with ∼30 mol% SiC [Fig. (4b)] shows comparatively impressive oxidation resistance, with only a thin (∼0.1 mm) reaction product layer (the makeup of which is discussed subsequently) covering an unaltered interior.
Cross sections (via diamond wafering blade) of specimens heat-treated at 1800 °C for ∼90 min. (a) 15.34 mol% SiC and (b) 27.91 mol% SiC. The ruled lines are 1 mm apart. The specimen in (a) was mounted in the crucible in the furnace such that the bottom of the part is out of the page, and the top extends into the page. The reaction layer in (b) is not uniform as portions of it snapped off as the displayed axial cross-section was being cut.

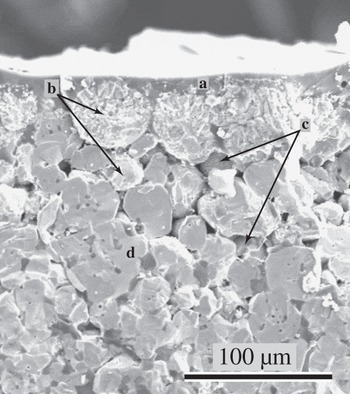
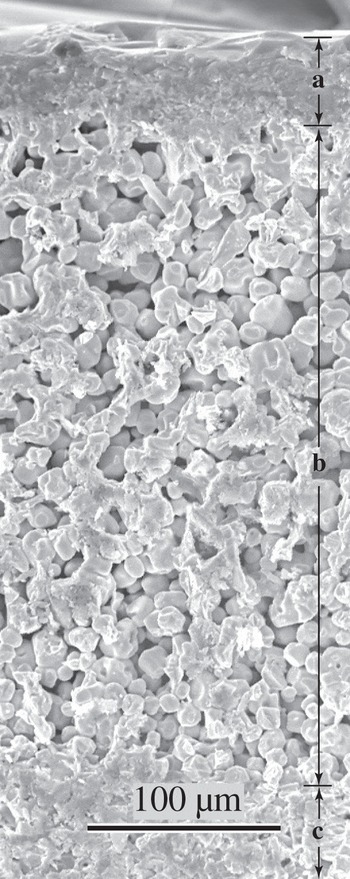
Figure 5 shows a cross-sectional fracture surface of near-surface regions of the ∼15 mol% SiC specimen oxidized at 1600 °C. An amorphous silica-containing layer (a) with embedded zirconia coats the specimen surface. Boron is unreliably detected with the available EDS so the extent to which the amorphous layer contained boron oxide has not been established. Slightly (∼10 μm) below this layer are fragmented zirconia particles (b), making up collective shapes correlating to ZrB2 grains appearing in the specimen interior. The zirconia regions were distinguished from ZrB2 by presence/absence of oxygen peaks in EDS data, and the tendency for bright spots from charging effects on the nonconductive ZrO2 regions. Pores (c) (of shapes similar to SiC grains seen in the specimen interior) reside in the region of transition from ZrO2 to ZrB2 grains. The specimen interior (d) consists of ZrB2 lighter shaded grains and darker shaded SiC grains.
Approximately 15 mol% SiC specimen oxidized at 1600 °C for ∼90 min.

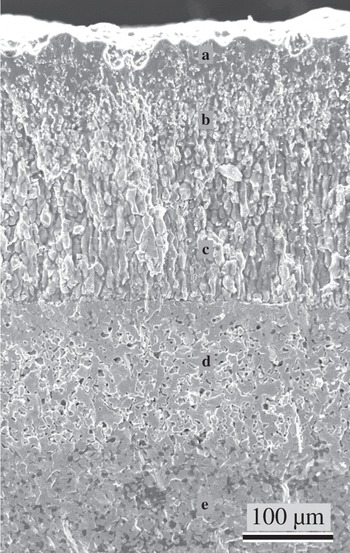
As shown in Fig. 6, the ∼15 mol% SiC specimen heat-treated at 1800 °C showed distinct layers of oxidation products penetrating from the surface inward: a zirconia-embedded silica-containing glass surface layer (a), a region of high concentration of ZrO2 particles infused with silica-containing glass (b), a region in which zirconia particles with no surrounding liquid/glass phase are elongated in the direction orthogonal with the surface (c). A transition along a distinct interface is then observed to ZrB2 grains with pores taking the place of what was once SiC grains (d). The most interior region consists of the original ZrB2–SiC matrix (e). The ∼15 mol% SiC oxidized at 1700 °C showed similar layers, though of diminished thicknesses. The microstructure in Fig. 6 came from the top portion of the specimen.
Approximately 15 mol% SiC specimen oxidized at 1800 °C for ∼90 min.

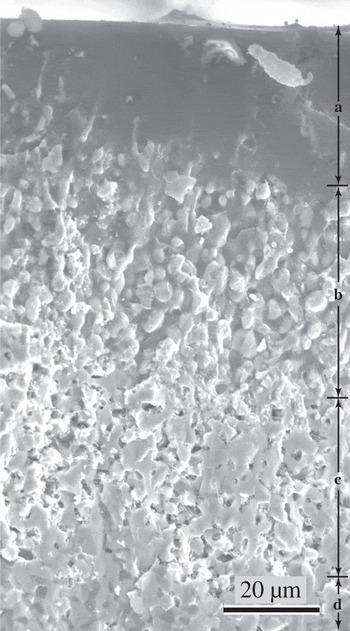
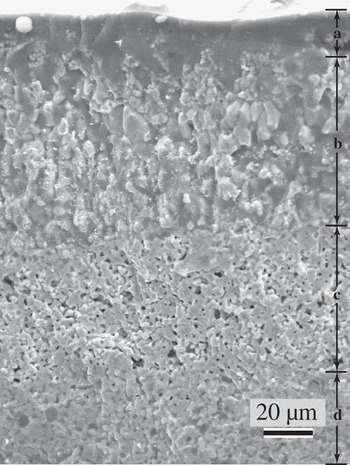
Increasing the SiC content from 15 to 30 mol% produces a microstructure with a separate silicate glassy layer largely devoid of zirconia, and layers similar to that previously described underneath, with the exception that there was no zone of elongated ZrO2 and porosity (Fig. 7). At 1900 °C (Fig. 8), the specimen with ∼30 mol% SiC developed a glassy silica-containing surface layer (a), within which the amount of embedded zirconia is difficult to determine. At greater depths, this transitions through a sharp boundary to a broad zone of ZrB2 (b), which is devoid of SiC. These particles have rounded from their appearance as grains in the original two-phase matrix, surrounded by porosity. Still deeper, at another sharp boundary, the original ZrB2/SiC matrix can be seen (c).
Approximately 30 mol% SiC specimen oxidized at 1700 °C for ∼90 min. Marked regions: (a) glassy region adjacent to the surface; (b) zirconia particles immersed in silicate glass; (c) ZrB2 regions depleted of SiC; (d) untransformed ZrB2–SiC.

Approximately 30 mol% SiC specimen oxidized at 1900 °C for ∼90 min.

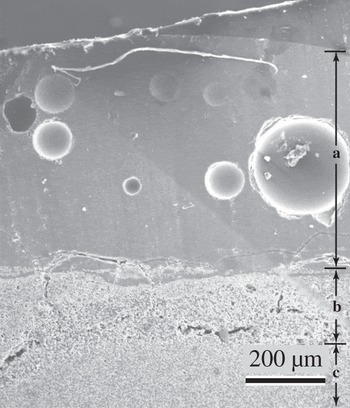
The microstructure of ∼60 mol% SiC oxidized at 1700 and 1800 °C is similar to ∼30 mol% SiC oxidized at the same temperatures, though the relative depths of the SiC-depleted ZrB2 zones are thinner, and the zone of ZrO2 surrounded by glass is more dilute in ZrO2. After heat treating this composition at 1900 °C, bubbles are observed in the glassy silica-containing layer (Fig. 9).
Comparatively low magnification of ∼60 mol% SiC specimen oxidized at 1900 °C for ∼90 min. (a) Glassy layer with imbedded bubbles. (b) ZrB2 with regions that had SiC replaced by porosity. Cracks/fissures in this layer are interpreted to have resulted from stresses via differences in coefficient of thermal expanions during cooling. (c) Untransformed ZrB2–SiC.

In our previous work at 1200–1500 °C, addition of TaB2 to specimens oxidized at 1600 °C changed the appearance of the layer of ZrO2 embedded in glass to one in which the crystalline phases appear more fragmented. That effect was not as visually apparent for oxidation heat treatments at 1700–1800 °C; however, these specimens showed somewhat thinner layers of glass-infused zirconia and SiC-depleted ZrB2, as compared to specimens without TaB2 additions, but similar SiC content. After oxidation at 1900 °C (Fig. 10), the region of ZrB2 depleted of SiC was substantially thinner than the case in which TaB2 was not added (Fig. 8).
Approximately 28 mol% SiC and ∼3 mol% TaB2 specimen oxidized at 1900 °C for ∼90 min. Letter markers correspond to the same region types as in Fig 7.

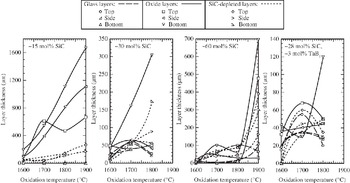
There was clear visual evidence of the flow of silicate glassy phase onto the ZrO2 chips on which specimens were resting, as well as down onto the bottom of the zirconia crucible. Figure 11 shows the temperature variation in thicknesses of the glassy surface layers, the oxide ZrO2/silicate liquid layers beneath them, and the SiC-depleted ZrB2 regions still further into specimen interiors. For ∼15 mol% SiC composition, distinct glass layers were not apparent. The layers of predominantly ZrO2 were coarser than the SiC-depleted layers; both layers generally coarsened with increasing soak temperatures. The ZrO2 layer became generally coarser in going from top to bottom of the specimen. For the ∼30 mol% SiC specimens, the thickness of the layer at the specimen bottom was again coarser than the sides or top. Glassy surface layers were apparent, whose thickness did not vary substantially with soak temperature. The composition with ∼60 mol% SiC showed a substantial increase in layer thicknesses in going from 1800 to 1900 °C soaking temperatures. Layer thicknesses were generally least coarsened for the compositions with ∼28 mol% SiC and ∼3 mol% TaB2. For both ∼30 mol% SiC and the composition with ∼28 mol% SiC and ∼3 mol% TaB2, glassy layer thicknesses appeared to decrease slightly in going from 1700 to 1800 °C soak temperatures.
Thicknesses of various layers, as measured in the SEM, of oxidation-altered ZrB2-based ceramics.

IV. DISCUSSION
Up through oxidation temperatures of 1600 °C, all evaluated compositions developed a passivating glassy surface layer along with an oxide layer beneath it, which were protective for the evaluated time period. Starting at 1700 °C, the composition with ∼15 mol% SiC lacked enough SiC to form an adequate volume of silica/borosilicate glass for passivation.
The silicate liquid phase was drawn into the crucible either by gravity, or by capillary action at the contact points. The capillary removal mechanism would imply preferential removal of liquid in close proximety, which is near the bottom of the specimen. This in turn would make this region more vulnerable to oxidation; the coarser oxide layers were observed in these regions.
The ∼15 mol% SiC specimen shows a slowing of weight gain after ∼30 min to a near-linear weight gain with time (Fig. 1). If oxidation were occurring through a diffusion-resistive layer that was coarsening with time, TG traces with a more continuous parabolic shape would have been expected. It is interpreted that initial parabolic behavior changed to a linear weight gain as the formation of silica liquid through oxidation was matched by its capillary extraction.
Calculated oxide layer thicknesses from weight loss data were within the spread of the three measured (top, middle, bottom) thicknesses of the oxide portion of the microstructure (Fig. 11). Compared to the total thicknesses of all the characteristic layers, the calculated thicknesses were roughly lower. The differences may be attributable to the inaccuracy of assumptions in the buoyancy calculations (e.g., linear temperature gradient), development of porosity (e.g., vapor pressure within the specimen pushing liquid toward the surface), and/or preferential oxidation of SiC in interior regions near unaltered ZrB2–SiC (which was not accounted for in the calculation).
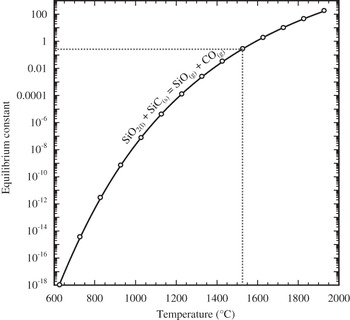
Figure 12 is a plot of equilibrium constants as a function of temperature for differing versions of the oxidation of SiC and ZrB2, showing that all indicated reactions are highly favorable. The equilibrium constants are so large at all temperatures, a buildup of product gas partial pressures to and exceeding ambient would not stop reactants from going toward products. It is reasonable to assume that in the gaseous environment within the SiC-depleted ZrB2 region, the partial pressure of oxygen is substantially lower than the ambient, because it is being consumed through oxidation and its supply is limited by diffusion through layers closer to the surface. In the reduction of metal oxides, plots such as Fig. 12 can be used to specify the  for which certain metals will oxidize while other metal oxides will reduce. In this case, however, the equilibrium constants do not represent the same ratio of partial pressures, making such evaluations difficult.
Equilibrium constant versus temperature as calculated by the expression ΔG°rxn = – RT ln k p where ΔG°rxn is the standard (1 bar) Gibbs energy of reaction, R is the gas constant, T is absolute temperature, and k p is the equilibrium constant.  ,
 ,
 ,
 , for the highest to lowest traces, respectively. Standard Gibbs energies of reactions were based on the Gibbs energies of formation of compoundsReference Clase18.

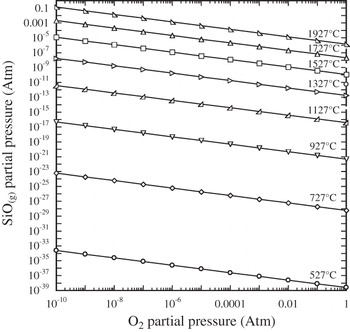
The SiC-depleted ZrB2 zone is seen ubiquitously for oxidation temperatures of 1700 °C and above. Figure 13 shows the stability of reaction product SiO2(l) in contact with reactant SiC(s). If it assumed that a pressure within the SiC-depleted ZrB2 layer cannot exceed atmospheric (since a bubble would otherwise form and burst), and equimolar amounts of SiO and CO gaseous products form, as shown in Fig. 13, SiO2(l) will react with SiC to form vapor phases above ∼1525 °C. Thus, for temperatures above this, any SiO2 which forms immediately reacts with the SiC in contact with it to form gas phases that escape from the reaction zone. In contrast, oxidation of ZrB2 forms B2O2 vapor and a zirconia scale; this scale impedes subsequent oxidation of the ZrB2 beneath it. Hence, available oxygen preferentially attacks constantly exposed SiC, rather than neighboring ZrB2 grains (protected by even a thin layer of ZrO2). This analysis is consistent with the observation that SiC-depleted ZrB2 regions are not visually apparent until oxidation temperatures of 1700 °C were used. The same result would be expected if the immediate oxidation product of SiC was SiO(g) rather than SiO2(l). Figure 14 shows that SiO(g) production is favored by high temperatures and low oxygen partial pressures. The extent to which SiO2(l) spontaneously decomposes to SiO(g) depends on the rate of escape of SiO(g) through the layers closer to the specimen exterior.
Equilibrium constant versus temperature for the indicated equilibria. For this reaction, k p = p COp SiO.

SiO(g) partial pressure as a function of oxygen partial pressure and temperature for the equilibria: SiO2(l) = SiO(g) + (1/2)O2(g).

The formation of bubbles in the specimen with ∼60 mol% SiC oxidized at 1900 °C, implying the formation of vapor pressures exceeding ambient, may be attributed to a number of contributing factors. Gaseous products of oxidation, e.g., CO(g) and B2O2(g) are not thought to be a major contributor because these gases form only in equimolar quantities to the amount of oxygen consumed, and the oxygen partial pressure in these buried layers is interpreted to be quite low. Only if the diffusion of these gaseous products through layers closer to the surface is significantly hindered as compared to the diffusion of oxygen, would significant partial pressures of these reaction products form. A more significant contributer would be the volatilization of B2O3(l) whose equilibrium vapor pressure is ∼0.3 atm at 1900 °C. The high concentration of SiC would imbue relatively close proximity of SiC and SiO2(l) (because there is a vast SiC source near the surface, its consumption to form the passivating glass/liquid layer does not require much penetration into the specimen interior), and the lower viscosity of the fluid at this temperature would facilitate liquid migration to contact interior SiC, facilitating reaction. These condensed phase to gaseous phase reactions would form copious amounts of SiO(g) and CO(g).
V. CONCLUSIONS
The minimum SiC content for passivization in pore-free ZrB2–SiC mixtures is between 15 and 30 mol% SiC. The passivating near-surface microstructure for isothermal heat treatments at and above 1700 °C consists of consecutive layers of a silicate liquid/glass, ZrO2 infused with liquid/glass, ZrB2 devoid of SiC, and then an unaltered ZrB2–SiC microstructure. When more rapid oxidation is observed, a layer of zirconia and porosity is observed, which can be quite extensive. Use of ∼6 mol% TaB2 along with the ∼28 mol% SiC resulted in what appeared to be thinner oxide passivating layers and equally good oxidation resistance. Bubbles observed in the glassy layer and their periodic bursting implied from TG in the 60 mol% SiC specimen heat-treated at 1900 °C indicate the buildup of product gases and/or condensed phase vapors that exceeded ambient pressure. The selective removal of SiC from near-surface ZrB2–SiC microstructure was proposed to be the result of reaction products of SiC oxidation being unprotective to yet-unreacted SiC, as compared to reaction products of ZrB2.
ACKNOWLEDGMENTS
This project was funded by the Air Force Office of Scientific Research, Contract FA9550-04-1-0140. The authors would like to express their appreciation for the helpful suggestions and support of their contract monitor, Dr. Joan Fuller. The authors are grateful to Professor Jeffrey Furgus of Auburn University for the use of his zirconia heating element furnace.
APPENDIX
For the reactions

and

it is assumed that boron oxide forms as an escaping gas and silica forms as a liquid/glass. These reaction stoichiometries dictate that the number of moles of ZrO2 formed are equal to the number of moles of ZrB2 consumed,  , and similarly
 . Note that the latter equality holds even if the reaction produced CO as opposed to CO2.
Let ΔM be the measured mass change after 100 min exposure to a given oxidation temperature. Then:

where  and M SiC are the masses of zirconium diboride and silicon carbide converted, respectively, and
 and
 are the masses of zirconia and silica produced, respectively. Letting W be the molar mass:

We define X SiC as the mole fraction of SiC in the original ZrB2–SiC composition, thus:

Let ρ be the density and V′ be the volume of oxide formed:
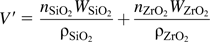
Given a disk geometry for the partially oxidized specimen of diameter d and height h, with a uniform oxide coating thickness of T:

The diameter d and height h of the disk vary during oxidation because the densities of the consumed phases and the corresponding formed oxide phases are not the same. Let ΔV be the volume of products formed minus the volume of reactants consumed; that is, the change in volume of the disk. Recognizing the equivalence of moles of ZrB2/ZrO2 and SiC/SiO2:

If the dimensions of the disk before oxidation are d 0 and h 0, then after partial oxidation, the change in volume is
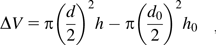
Assuming that the thickness of oxide scale forming on all surfaces is the same, the change in linear dimensions from oxidation in the axial and radial directions would then be the same: d – d 0 = h – h 0, thus:

Equation (A2) (inserting into Eq. (A1) and the definition of mole fraction) may be used to determine the volume of oxide formed. Inserting this into Eq.(A3), along with calculated values of d and h from Eqs. (A4) and (A5) will yield T through numerical solution.