

Introduction
Heat stress is an important constraint to wheat productivity that affects different growth stages, especially seedling, anthesis and grain filling. Growth rate is accelerated due to increased plant temperature, which reduces the opportunity for photosynthesis since the life cycle is truncated, while both heat and drought stress may also inhibit growth directly at the metabolic level. Physiological traits are often identified as having contributed to improved yield potential under the stress condition. High stomatal conductance (SC) permits leaf cooling through evapotranspiration; this, along with higher leaf chlorophyll content and stay-green, is associated with heat tolerance (Reynolds et al., Reference Reynolds, Balota, Delgado, Amani and Fischer1994). Other complementary traits such as canopy temperature (CT), normalized difference vegetative index (NDVI) and chlorophyll fluorescence (Fv/Fm) have been reported to be associated with yield under the heat stress condition (Reynolds et al., Reference Reynolds, Balota, Delgado, Amani and Fischer1994; Hazratkulova et al., Reference Hazratkulova, Sharma, Alikulov, Islomov, Yuldashev, Ziyaev, Khalikulov, Ziyadullaev and Turok2012; Sharma et al., Reference Sharma, Andersen, Ottosen and Rosenqvist2012).
In India, a substantial wheat area is heat stressed due to delayed planting caused mostly by long duration paddy varieties in rice–wheat cropping areas (Joshi et al., Reference Joshi, Mishra, Chatrath, Ferrara and Singh2007). According to Nagarajan (Reference Nagarajan2005), heat stress, especially at the terminal stage, is seen as a major reason for India having fallen well short of anticipated production. Breeding efforts under the national breeding programme and in active collaboration with CIMMYT, Mexico, succeeded in providing varieties adapted to different agroclimatic regions in India. The last 30 years have witnessed an unprecedented level of international wheat germplasm exchange and the development of a greater degree of genetic relatedness among successful cultivars all over the world. Proactive identification of potentially useful traits such as stay-green, SC and chlorophyll content among a wide range of parental germplasm may contribute to improving yield potential, and also broaden the genetic base to heat stress tolerance.
The use of molecular markers for the evaluation of genetic diversity of wheat has recently received a great deal of attention from wheat researchers. Genetic diversity in wheat was characterized using morphological traits (Sonmezoglu et al., Reference Sonmezoglu, Bozmaz, Yildirim, Kandemir and Aydin2012). Simple sequence repeats (SSRs) or microsatellites have become important genetic markers in a wide range of crop species, including wheat because of higher level of polymorphism, and are abundant, dispersed throughout the genome (Li et al., Reference Li, Wang, Sun and Han2009).
Characterization of potential parents for adaptive mechanisms to abiotic stress has resulted in strategic crossing among parents that encompass as many target traits as possible and early generation selection of bulks for the development of cultivars and advance breeding lines in CIMMYT, Mexico and in University of Sydney, Australia. The objective of this study was to analyse the genetic variability present in these exotic germplasm, which includes parents and lines selected from advance breeding lines, crosses and progenies, along with indigenous wheat germplasm for physiological traits linked to heat tolerance and to classify them based on phenotypic scores and SSR markers. The present study will help to understand the genetic distances associated with physiological traits among the germplasm in question and to selectively reduce the number of genotypes for subsequent cycles, and also to plan strategic crossing programmes to introgress targeted traits for heat tolerance into Indian varieties.
Materials and methods
Plant materials
A set of 92 bread wheat (Triticum aestivum L.) genotypes were used for the present study. This set included 59 wheat lines obtained from CIMMYT (the International Maize and Wheat Improvement Center), Mexico, under the Generation Challenge Programme (GCP) project ‘Molecular breeding and selection strategies to combine and validate quantitative trait loci for improving water-use efficiency and heat tolerance of wheat in India’. In addition, 33 lines of cultivated varieties, advanced breeding lines and some commercial varieties released in India and abroad were added to form a set of 92 genotypes (Supplementary Table S1, available online).
Phenotypic screening
Field trials were carried during 2012–13 and 2013–14 in the Experimental farm of Indian Agricultural Research Institute, New Delhi. Heat stress was imposed through staggered sowing. Timely sowing (15th November sowing) was non-stress and late sowing (6th January sowing) resulted in heat stress at post-reproductive stages. The trial was conducted in a randomized block design with two replications. The gross plot size of the timely-sown experiment was 1.38 m × 3.0 m with rows at 23 cm apart, whereas for very late-sown experiments, the gross plot size was 1.08 m × 3.0 m with a row-to-row spacing of 18 cm. The standard cultivation practices prescribed for wheat under irrigated conditions were followed precisely.
Physiological traits such as CT (°C) were measured at the early boot stage (Zadok's 39) and 10 d after anthesis using an infrared thermometer. SC was recorded on flag leaves at the late boot stage (Zadok's 49-50) using a leaf porometer (SC-1; Decagon Devices, Inc., Pullman, WA, USA). Fv/Fm was measured on flag leaves at the late boot stage using a chlorophyll fluorescence meter (Hansatech, King's Lynn, Norfolk, UK). GreenSeeker (Trimble, Inc., Westminster, CO, USA) was used to measure the NDVI at early milk (Zadoks 73), dough (Zadok's 85-87) and maturity (Zadok's 90). Chlorophyll content was assessed on flag leaves at the early milk stage using a Minolta SPAD-502 chlorophyll meter. Morphological traits such as flag leaf area (cm2) were measured after complete heading using a leaf area meter, and plant height (cm) and spike length (cm) were measured after the grain filling stage. Fifty spikes were randomly selected and assembled from each plot to estimate grain yield per spike (GYPS) and thousand-kernel weight (TKW) (g).
Molecular marker analysis
Genomic DNA was extracted from young and fresh leaf tissues collected from 1-month-old plants, ground to fine powder using liquid nitrogen and used for DNA isolation using the modified CTAB (cetyl trimethyl ammonium bromide) method (Saghai-Maroof et al., Reference Saghai-Maroof, Soliman, Jorgensen and Allard1984). The isolated DNA was quantified and diluted to the concentration of 40–50 ng/μl and stored at − 20°C. PCR was conducted in a 20 μl reaction containing 1 × PCR buffer, 200 mM dNTPs, 0.25 μl of primer, 2 mM MgCl2, 1 unit of Taq polymerase and 50 ng of template DNA. PCR amplification was performed using an Applied biosystems 1000 thermocycler following the PCR protocol: initial denaturation at 94°C for 4 min, 35 cycles at 94°C for 1 min, annealing temperature at X°C (depending on the primer pair) for 1 min, 72°C for 1 min and final extension step at 72°C for 6 min. Amplified products were resolved on 4% agarose gel (Agarose SFR™; AMRESCO®, Solon, OH, USA) at 4 V/cm in 1 × TAE buffer, and fragment sizes were calculated by interpolation from the migration distance of marker fragments of 100 bp DNA ladder (Invitrogen, Carlsbad, CA, USA) depending on the primers.
A total of 131 SSR markers, based on their distribution across the 21 chromosomes (Somers et al., Reference Somers, Isaac and Edwards2004), with at least two SSRs per chromosome were selected and used. Primer sequences for the majority of the SSR markers were obtained from the GrainGenes website (http://www.wheat.pw.usda.gov/ggpages/SSR).
Data analysis
The heat susceptibility index (HSI) for grain yield was determined by using the following formula proposed by Fischer and Maurer (Reference Fischer and Maurer1978):
 $$\begin{eqnarray} HSI = (1 - ( X _{s}/ X _{n}))/SI, \end{eqnarray}$$
 $$\begin{eqnarray} SI = 1 - Y _{s}/ Y _{n}, \end{eqnarray}$$
where X s is the GYPS under stress of each genotype; X n is the GYPS under non-stress of each genotype; SI is the stress intensity; Y s is the mean GYPS of all genotypes under stress; Y n is the mean GYPS of all genotypes under non-stress.
Descriptive statistical parameters such as mean, minimum, maximum value, standard deviation and coefficient of variation were calculated for five physiological traits and six agronomic traits. Phenotypic data analyses and genetic correlations were estimated between all pair traits using SAS version 9.2 (SAS Institute Inc., 2009, USA). The phenotypic data were also subjected to statistical analysis for descriptive statistics purpose and for character association. Since the data contained multi-collinear variables, a stepwise regression analysis-based clustering was performed. The differences in trait response between the normal and stress conditions for phenotypic factors corresponding to a significant contribution to GYPS under stress were considered to perform cluster analysis using pair group distance with Euclidean distance measures. The dendrogram was constructed using DARwin software version 6.
Marker polymorphism
To measure the informativeness of the SSR markers, the polymorphic information content (PIC) and resolving power (Rp) for each SSR were calculated. PIC values were calculated according to Anderson et al. (Reference Anderson, Churchill, Autrique, Tanksley and Sorrells1993) as
 $$\begin{eqnarray} PIC = 1 - { \sum _{ i = 1}^{ k } }\, p _{ i }^{2}, \end{eqnarray}$$
where k is the total number of alleles detected for a locus of a marker and p i is the frequency of the ith allele in the set of 92 accessions investigated. The average PIC value is equivalent to the genetic diversity estimated as a measure of genetic variation Weir (Reference Weir1996).
The Rp value was calculated using the following formula of Prevost and Wilkinson (Reference Prevost and Wilkinson1999):
 $$\begin{eqnarray} Rp = \sum I _{b}, \end{eqnarray}$$
where I b is the ‘band informativeness’ and can be represented into a 0–1 scale by the following simple formula:
 $$\begin{eqnarray} I _{b} = 1 - (2\times \vert 0.5 - p \vert ), \end{eqnarray}$$
where p is the frequency of accessions that contain the fragment.
Genetic dissimilarity and cluster analysis
Dissimilarity matrix was used for clustering of genotypes using selected SSR markers, based on the unweighted neighbour-joining method using DARwin software (version 6, 2014). The stability of the dendrogram was evaluated by the bootstrap approach using the Winboot program (Yap and Nelson, Reference Yap and Nelson1996). The Mantel test was performed using the software package PASSaGE (Rosenberg and Anderson, Reference Rosenberg and Anderson2011).
Results
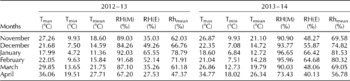
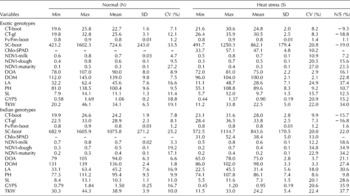
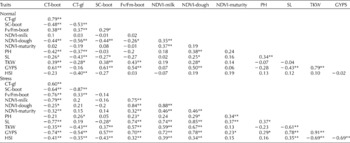
The average daily maximum and minimum temperature and relative humidity of the experimental site during the crop growth season is presented in Table 1. The temperature during March and April is above 18°C, which is detrimental (Wardlaw and Wirgley, Reference Wardlaw and Wrigley1994) to grain filling in the January-sown crop. Grain filling for the November-sown crop begins during the second week of March and prolongs until the fourth week of March. The mean temperature during this period was 21 and 19°C for years 2012–13 and 2014, respectively. However, for the January-sown crop, grain filling begins during the fourth week of March and ends by the second week of April. The mean temperature during this period was 25°C for both the years. The stress intensity (Fischer and Maurer, Reference Fischer and Maurer1978) on the crop was 0.46 and 0.53 for years 2012–13 and 2013–14, respectively, indicating moderate to severe heat stress. Summary statistics of physiological traits pooled for 2 years under normal and stress conditions for exotic lines and Indian lines are given in Table 2. There was considerable variation for CT, SC, Fv/Fm, NDVI and SPAD over the 2 years of study at specific stages under both non-stress and stress conditions among the exotic and Indian lines. The average reduction due to heat for agronomically important traits is given in Table 2. The correlation between the physiological traits and agronomic traits under normal and heat stress conditions is given in Table 3. There was a significant relationship among the physiological traits studied under the heat stress condition. Under the latter condition, leaf chlorophyll content estimated using SPAD was significantly correlated with CT (r= − 0.72; P< 0.001), SC (r= 0.33; P< 0.001), NDVI at milk (r= 0.75; P< 0.01), dough (r= 0.84; P< 0.84) and maturity (r= 0.32; P< 0.001), TKW (r= 0.74; P< 0.001), GYPS (r= 0.63; P< 0.001) and HSI (r= 0.48; P< 0.001).
Average maximum and minimum temperatures and relative humidity during the crop growth season at the experimental site for 2 years

Tmax, temperature maximum; Tmin, temperature minimum; Tmean, temperature mean; RH(M), relative humidity during morning; RH(E), relative humidity during evening; Rhmean, mean relative humidity.
Descriptive statistics for phenotypic traits under normal and heat stress conditions for the 59 exotic and 33 Indian genotypes

CV, coefficient of variation; CT-boot, canopy temperature (°C) at boot; CT-gf, canopy temperature (°C) at grain filling; Fv/Fm-boot, chlorophyll fluorescence at boot; SC-boot, stomatal conductance (mmol/m2/s) at late boot; Chlo-SPAD, chlorophyll content (SPAD unit); NDVI, normalized vegetative differential index; DOA, days to anthesis; DOM, days to maturity; LA, leaf area (cm2); PH, plant height (cm); SL, spike length (cm); GYPS, grain yield per spike (g); TKW, thousand-kernel weight (g).
Genotypic correlation between physiological traits and agronomic traits

For the description of the traits, see Table 2.
*, Significant at the 0.05 level; **, significant at the 0.01 level.
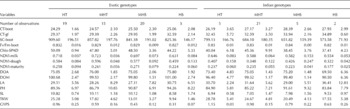
The genotypes were grouped into four categories based on the HSI: heat tolerant (HT, HSI < 0.70), moderately heat tolerant (MHT, HSI>0.70 to < 1.20), moderately heat susceptible (MHS, HSI>1.20 to < 1.70) and heat susceptible (HS, HSI>1.70). The mean HSI for 59 exotic genotypes was 1 ± 0.54, and these were classified into HT, MHT, MHS and HS genotypes consisting 19, 15, 20 and 5 genotypes, respectively. Similarly, the mean HSI of 33 Indian genotypes was 0.99 ± 0.29, and these were classified into 5 HT, 21 MHT, 5 MHS and 2 HS genotypes. Nevertheless, the HSI of exotic and Indian genotypes was not significantly different (Welch's ANOVA F= 0.02; P>0.87). The mean phenotypic data for HT, MHT, MHS and HS exotic and Indian genotypes are presented in Table 4.
Phenotypic traits values of 92 genotypes categorized into heat-tolerant (HT), medium heat-tolerant (MHT), medium heat-susceptible (MHS) and heat-susceptible (HS) groups

For the description of the variables, see Table 2.
SSR marker analysis
A total of 131 SSR markers distributed across A, B and D genomes were evaluated for their efficiency of polymorphism across the 92 wheat genotypes. The level of polymorphism among the 92 wheat genotypes was evaluated by using 82 polymorphic SSR markers covering all 21 chromosomes of the hexaploid wheat genome with one to six SSR markers per chromosome. The data on allelic information for the 82 SSR markers, which includes number of alleles, predominant allele and its frequency, PIC and Rp values, are summarized in Supplementary Table S2 (available online).
The average number of alleles per locus was 3.02 and ranged from two (cfd9) to eight (wmc331). Allele frequencies per locus were not homogeneous for most of the markers, and at each locus, one allele was predominantly observed. Gene diversity for the 82 microsatellite markers varied from 0.041 for the locus cfd9 to 0.732 for the locus wmc339 with an average of 0.438. PIC and Rp values were also calculated for each locus from the allele size data. The PIC values, a reflection of allele diversity and frequency among the wheat genotypes, were not uniformly high for all the SSR loci tested. The PIC values ranged from 0.04 to 0.68, with an average of 0.37 for all markers. The highest PIC value occurred in the D genome (0.688), compared with the B and A genomes (0.646 and 0.678, respectively). The highest PIC values of 0.688 and 0.686 were recorded for wmc339 and wmc546, respectively, while the lowest value of 0.040 was noted for cfd9.
The Rp values ranged from 0.083 to 2.250 and averaged to 1.10. The highest Rp value was observed for the marker gwm186 (2.250) followed by the markers wmc161 (2.208) and gwm247 (2.021), while the lowest Rp value was observed for cfd9 (0.083). A significant relationship was observed between the Rp and PIC values (r= 0.77; P≤ 0.001). However, the correlation coefficient between the PIC value and the number of alleles per locus was high (r= 0.93; P≤ 0.001).
Cluster analysis of SSR and phenotypic data
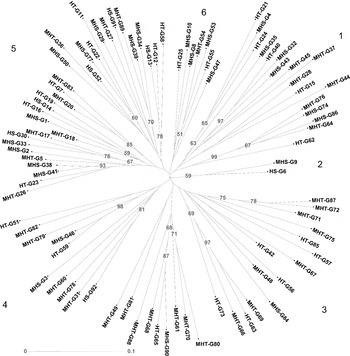
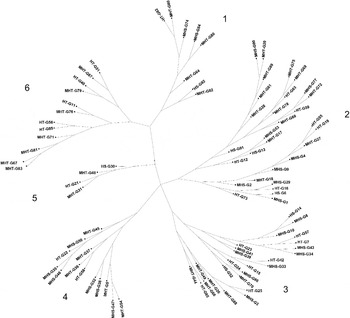
The dendrograms derived from SSR and phenotypic data using distance-based UPGMA (unweighted pair group method with arithmetic mean) cluster analysis are shown in Figs 1 and 2, respectively. The genetic dissimilarity coefficients for all the possible 4188 pairs of wheat genotypes determined by SSR markers ranged from 0.058 to 0.432 and averaged to 0.25. SSR data classified the 92 genotypes into six major clusters. There were also six major clusters formed when data for difference in phenotypic response due to heat stress were used for cluster analysis. The genetic dissimilarity coefficients determined by phenotypic traits ranged from 1.00 to 54.74 and averaged to 27.5. For SSR data, clusters 1, 5 and 6 consisted of exotic lines, while clusters 3 and 4 were dominated by Indian lines. Cluster 2 was constituted with only two genotypes, G9 and G6. Five Indian genotypes formed a subgroup in cluster 1, since they were derived from the common parent C 306, which was developed from CIMMYT lines. Similarly, other three Indian genotypes, G83, G89 and G91, that were genetically similar to exotic lines were included in cluster 5. All these Indian genotypes were medium tolerant to heat stress except G91. Therefore, introgression of stress-tolerant genes into these genotypes would not have much selection advantage. However, these Indian genotypes can themselves serve as a source as parents, and could be used in breeding programmes without much effort for adaptation under heat stress conditions of India. Nei's genetic distance determined based on SSR markers ranged between 0.25 and 0.57 among the exotic genotypes and 0.17 and 0.55 among the Indian genotypes. The average genetic distance was 0.43, 0.43, 0.44 and 0.41 for HT, MHT, MHS and HS exotic genotypes, respectively. Similarly, for HT, MHT, MHS and HS Indian genotypes, the average genetic distance was 0.42, 0.44, 0.40 and 0.38, respectively.
Dendrogram derived from SSR data using distance-based UPGMA cluster analysis. For the description of the variables, see text.

Dendrogram derived from phenotypic data using distance-based UPGMA cluster analysis. For the description of the variables, see text.

Indian and exotic genotypes did not form separate clusters, which reflects that phenotypic expression of the two groups under heat stress did not differ. However, phenotypic data did not classify the exotic and Indian lines into distinct clusters. Furthermore, SSR-based cluster analysis did not clearly differentiate the genotypes according to the gradient of the HSI among the exotic and Indian genotypes. The SSR marker-based dendrogram failed to identify a clear structure related to the HSI when compared with phenotypic data. However, phenotypic data involving physiological traits and agronomic traits could to a great extent classify the genotypes related to the HSI for heat stress. The phenotypic expression varies with an adaptation of local genotypes.
Discussion
Heat stress, especially at the terminal stage, was seen as a major reason for India's struggle to achieve anticipated production gains for several years between 2000 and 2007 (Joshi et al., Reference Joshi, Mishra, Chatrath, Ferrara and Singh2007). In addition to climate change, long duration rice varieties in the rice–wheat cropping areas cause delayed planting, exposing wheat to increased terminal heat stress. Therefore, the need for agronomically superior heat-tolerant wheat varieties has been advocated by many researchers (Singh et al., Reference Singh, Huerta-Espino, Sharma, Joshi and Trethowan2007; Ortiz et al., Reference Ortiz, Sayre, Govaerts, Gupta, Subbarao, Ban, Hodson, Dixon, Ortiz-Monasterion and Reynolds2008). As a result, early duration wheat varieties with traits such as early vigour and leaf rolling under stress were bred for terminal heat stress tolerance, considering the improvement of yield per se performance under heat stress conditions of India. Although the genotypes that were bred for terminal heat stress tolerance with earliness performed better, they did not perform up to their fullest potential due to heat stress during early grain filling stages. Indian genotypes such as HALNA, FLW18 and WH730 bred for heat tolerance would mature in 90 days, and are thus early than exotic genotypes under heat stress. In recent years, high temperatures were recorded during the month of March, which coincides with early grain filling stages such as the milk stage; therefore, developing heat-tolerant genotypes with earliness would not be an effective strategy in future. Thus, genotypes with superior physiological adaptation with broad diversity to tolerate stress are necessary. Indian genotypes that were classified as heat tolerant in the present study were found to be early than exotic genotypes.
The five physiological adaptations by plants to combat heat stress are well documented. There were considerable differences between the exotic lines and Indian lines for the cool canopy and other traits studied under heat stress. Welch's ANOVA test (P< 0.001) indicated a significant difference between the exotic and Indian genotypes for most of the traits, except Fv/Fm, NDVI at maturity and days for anthesis and GYPS (F= 1.89; P= 0.17) under heat stress. Exotic lines maintained cooler canopies, higher SC, NDVI and leaf chlorophyll content when compared with Indian lines. This could be attributed to the gap in local adaptation of genotypes to the heat stress conditions of India. Reynolds et al. (Reference Reynolds, Balota, Delgado, Amani and Fischer1994) examined accessions from CIMMYT's genebank collections under heat stress conditions, and reported that high SC permits leaf cooling through evapotranspiration; this along with higher leaf chlorophyll content and stay-green are associated with heat tolerance. Pinto et al. (Reference Pinto, Reynolds, Mathews, McIntyre, Olivares-Villegas and Chapman2010) mapped QTL associated with cooler canopy and leaf chlorophyll content using mapping populations derived from Seri M82 (G48) and Babax (G20). There is a strong relationship between SC and CT since SC has a direct effect on transpirational cooling (Amani et al., Reference Amani, Fischer and Reynolds1996; Fischer et al., Reference Fischer, Rees, Sayre, Lu, Condon and Saavedra1998). The GYPS was lower for Indian genotypes under the normal condition; however, under the heat stress condition, there was no significant difference between the two genotypes. Heat stress during reproductive stages would reduce grain number and grain weight; therefore, GYPS was reduced by 15 and 36% in exotic and Indian genotypes, respectively.
Eighty-two polymorphic markers covered all 21 chromosomes of three genomes that were selected as per the genome-wise map developed by Somers et al. (Reference Somers, Isaac and Edwards2004). The percentage polymorphism in the A genome was 60%, in B was 68.88% and in D was 58.54%. The total percentage polymorphism was 62.60%. The allele frequencies ranged from 0.34 to 0.98. The average number of alleles in the present investigation was two to eight alleles per locus. The observed average number of alleles is in agreement with that reported by Pagnotta et al. (Reference Pagnotta, Mondini and Atallah2005), who also detected two to eight alleles per locus in a collection of 39 Italian wheat accessions. In a diversity analysis carried out with 48 wheat accessions using 47 SSR markers, the number of alleles per locus ranged from 2 to 9, with an average of 3.87 alleles per locus as reported by Salunkhe et al. (Reference Salunkhe, Tamhankar, Tetali, Zaharieva, Bonnett, Trethowan and Misra2013). The microsatellite markers used showed different levels of gene diversity.
The PIC values that estimate the discriminating ability of any locus by considering the number of alleles per locus and their relative frequencies (Anderson et al., Reference Anderson, Churchill, Autrique, Tanksley and Sorrells1993) varied according to the markers and ranged from 0.04 to 0.68 with an average of 0.37 for all markers, which confirms that wheat microsatellite markers are highly informative. Botstein et al. (Reference Botstein, White, Skolnick and Davis1980) reported that a marker with a PIC value >0.5 is considered as highly informative, between 0.5 and 0.25 is just informative and ≤ 0.25 is slightly informative. These average PIC values are similar to the findings of Salunkhe et al. (Reference Salunkhe, Tamhankar, Tetali, Zaharieva, Bonnett, Trethowan and Misra2013), Teklu et al. (Reference Teklu, Hammer and Roder2007) and Pagnotta et al. (Reference Pagnotta, Mondini and Atallah2005). In the majority of diversity studies, PIC value of a marker has been extensively used to assess the capacity of a given primer to distinguish among various genotypes (Varshney et al., Reference Varshney, Chabane, Hendre, Aggarwal and Graner2007). Mangini et al. (Reference Mangini, Taranto, Giove, Gadaleta and Blanco2010) reported that Rp was found to be more suitable than PIC to describe the discriminatory ability of primers. The results obtained are in agreement with those of Roussel et al. (Reference Roussel, Leisova, Exbrayat, Stehno and Balfourier2005), Al-Khanjari et al. (Reference Al-Khanjari, Hammer, Buerkert and Roeder2007) and Salem et al. (Reference Salem, Varshney, Roeder and Borner2010). In contrast, Prasad et al. (Reference Prasad, Varshney, Roy, Balyan and Gupta2000) did not find any correlation with the PIC value and the number of alleles.
The range of genetic distance based on phenotypic traits was higher than that based on SSR markers, which may reflect the influence of the environment on the performances of the genotypes (Dodig et al., Reference Dodig, Zoric, Knezjevic, King and Sjurlan2010). The Mantel test performed to assess the correlation between genetic distances between the SSR and phenotypic data revealed a significant but weak correlation (r= 0.19; P>0.05). This is in agreement with the studies of Dodig et al. (Reference Dodig, Zoric, Knezjevic, King and Sjurlan2010) showing that DNA markers and phenotypic traits do not necessarily give closely matching results, as clustering based on phenotypic traits may result in separating genotypes according to a single major gene for heat tolerance. However, exotic genotypes analysed in this study had cooler canopies, SC, chlorophyll content and favourable NDVI. Since these traits are under the influence of the environment, information on genetic variability at the molecular level would serve as a source of quality information to breeders. The information obtained from this study will help wheat breeders to plan strategic breeding programmes using genetically diverse parents falling in distinct clusters. The SSR and phenotypic data will also help in identifying potential locally adapted lines that can be used as a parent. Trait-specific diverse exotic genotypes can be selected to plan strategic breeding programmes to introgress heat tolerance-related physiological traits into locally adapted genotypes. Promising genotypes identified with cooler canopies under heat stress were G7, G3, G25 and G4. Genotypes identified for Fv/Fm and NDVI were G15, G45, G20, G23, G19, G40 and G31 among the exotic genotypes. The results obtained provide new information about the relationships between the bread wheat genotypes analysed. Information on the amount of genetic variation in germplasm is fundamental to improving future breeding programmes by providing a basis for the selection of superior parental combinations and the prediction of progeny performance (Haile et al., Reference Haile, Hammer, Badebo, Nachit and Röder2013). Availability of superior and diverse alleles/genes is the starting point of genetic enhancement of crop plants including wheat, and helps in the identification of new cultivars (Abouzied et al., Reference Abouzied, Eldemery and Abdellatif2013). Several authors have reported that microsatellites or SSRs are more variable and effective than most of other molecular markers that are useful as tools for studying the genetic diversity of germplasm (Haile et al., Reference Haile, Hammer, Badebo, Nachit and Röder2013). In wheat, microsatellites have been successfully used in diversity studies (Landjeva et al., Reference Landjeva, Korzun and Ganeva2006; Akfirat and Uncuoglu, Reference Akfirat and Uncuoglu2013).
The Indian genotype HD 2967 (G84) is presently the major variety in major wheat-growing areas in India, and yields up to 6 t/ha. However, in our study, it was found that heat stress adversely affected the yield of the genotype. The genetic distance between HD 2967 and SOKOLL (G25) was high. Therefore, this line can be introgressed with HD 2967 to transfer superior physiological traits like stomatal conductance and cooler canopy. Similarly, physiologically superior exotic genotypes with high genetic distance can be used to introgress with some of the popular genotypes such as GW 322, GW 366, HD 2877. Reynolds et al. (Reference Reynolds, Manes, Izanloo and Langridge2009) emphasized on the assumption for the physiological trait strategy, and pointed out that physiological trait-based crossing programme will realize cumulative gene action in selected progeny. Such considerable range of variations provided a good opportunity for the improvement of physiological traits that are associated with heat stress tolerance. Preliminary evaluation of physiological traits under a specific environment will help to establish genetic diversity among the genotypes. Once diversity has been established in a targeted environment, numbers can be reduced (e.g. 20–50) to include the best germplasm, encompassing the full range of genetic diversity, for more detailed observations in subsequent cycles. Genetic improvement for stress tolerance in locally adapted germplasm through introgression of complementary physiological traits will prepare wheat researchers to face the challenges posed by climate change.
Supplementary material
To view supplementary material for this article, please visit http://dx.doi.org/10.1017/S1479262115000532
Acknowledgements
The authors are grateful to GCP, CIMMYT, Mexico, for providing financial assistance and sharing the exotic germplasm. The authors are also grateful to the anonymous reviewers whose critical comments helped to improve the readability and clarity of this manuscript.