Introduction
As early as the 1950s, propylene glycol (PG), by drenching or feeding, has been shown to effectively treat ketosis in dairy cows due to its glucogenic property (Johnson, Reference Johnson1954). PG applied by feeding instead of routine oral drenching may be better accepted by dairy producers as a supplement to alleviate negative energy balance and subsequently prevent subclinical ketosis that often occurs during the first month of lactation. Periparturient supplementation of PG by incorporating it into the concentrate, has been shown to decrease blood concentrations of non-esterified fatty acid (NEFA) and β-hydroxybutyrate (BHBA) (Fisher et al., Reference Fisher, Erfle and Sauer1971; Hoedemaker et al., Reference Hoedemaker, Prange, Zerbe, Frank, Daxenberger and Meyer2004), and increase blood concentrations of glucose and insulin (Sauer et al., Reference Sauer, Erfle and Fisher1973; Patton et al., Reference Patton, Sorenson and Hippen2004). Currently, the method of treating clinical or acute ketosis in dairy cows is to administer an oral drench of liquid PG (Herdt and Emery, Reference Herdt and Emery1992). However, oral drenching can be stressful and possibly harmful to the animal and the person providing the drench. Opportunity exists for PG as a dry product to be applied by feeding in place of drenching. This study was conducted to determine if PG, as a dry product, by feeding, could improve the energy status of cows in early lactation and therefore aid in the prevention of subclinical ketosis. Energy status is defined as energy availability that can be assessed by profiling concentrations of key blood metabolites and insulin and ketones in milk and urine. The objective of the current experiment was to study the efficacy of dry PG, provided through different methods of delivery, on energy status as indicated by blood metabolic profiles and lactational performance of Holstein dairy cows during the first 3 weeks of lactation.
Material and methods
Experimental design, treatments and care of cows
A total of 18 multiparous (for cows entered their second lactation or greater) and 19 primiparous (for first-calf heifers entered their first lactation) Holstein dairy cows were used in a completely randomized design, with restrictions to compare the efficacies of feeding PG as a dry product via two delivery methods on milk production and composition and blood parameters. PG treatments were administered from parturition through 21 days postpartum. Dietary treatments were: (i) control, no PG; (ii) top dress, 162.5 g PG/cow per day (corresponding to 250 g/cow per day of the dry PG product), supplemented as a top dress and; (iii) mixing, 162.5 g PG/cow per day, supplemented as a part of the total mixed ration (TMR) by incorporating it into the TMR. The amount (162.5 g/cow per day) of PG chosen was similar to the amount (4 oz/day) of liquid PG that was typically drenched to fresh cows as a preventive for subclinical ketosis. PG used was a non-acidogenic dry product (NEL = 2.6 Mcal/kg; Gly-Tran 65; NutriLinx LLC, Montpelier, VT, USA) that contained 65% PG and 35% silicon dioxide as the dry carrier. For the treatment with PG supplementation as a top dress, an equal portion (250 g) of dried bakery by-product (cookie meal) was mixed with the dry PG product to ensure complete consumption by the cows. The control cows and cows receiving PG by incorporating it into the TMR also received the same amount of dried bakery by-product as a top dress. For the treatment with PG supplementation by mixing, dry PG was mixed thoroughly with the TMR in a mixer cart at a group feeding rate of 162.5 g PG/cow per day to represent the feeding condition in the field.
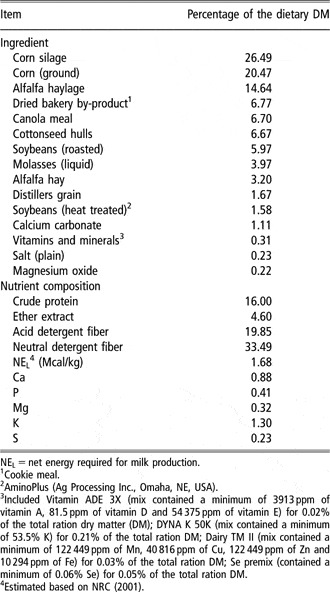
Cows were moved from an open dry lot to a naturally ventilated tie stall barn 1 week before their expected calving date to adapt to this facility. Once dry cows were moved to this facility, they had access to an open dry lot for 3 to 4 h/day, until calving. Dry cows were moved with their feed to box stalls just before calving and returned to the tie stall facility the following morning. The mean actual calving date was 2 days (±5.7 s.d.) earlier than the expected date. From parturition to 21 days postpartum, cows received a basal lactating cow TMR (Table 1) once daily after the morning milking. Cows were fed ad libitum to a 10% refusal rate. The basal lactating cow TMR was formulated based on the National Research Council (2001) guidelines for milking Holstein dairy cows at 660 kg of body weight (BW) and producing 41 kg of milk/day with 3.7% milk fat. Cows were milked twice daily at approximately 0630 and 1830 h. Cows were allowed to exercise for 2 h in an open dry lot before each milking. Cows were handled and cared for under protocols approved by the Pennsylvania State University Institutional Animal Care and Use Committee.
Ingredient and nutrient composition of the basal lactating cow total mixed ration

NEL = net energy required for milk production.
1Cookie meal.
2AminoPlus (Ag Processing Inc., Omaha, NE, USA).
3Included Vitamin ADE 3X (mix contained a minimum of 3913 ppm of vitamin A, 81.5 ppm of vitamin D and 54 375 ppm of vitamin E) for 0.02% of the total ration dry matter (DM); DYNA K 50K (mix contained a minimum of 53.5% K) for 0.21% of the total ration DM; Dairy TM II (mix contained a minimum of 122 449 ppm of Mn, 40 816 ppm of Cu, 122 449 ppm of Zn and 10 294 ppm of Fe) for 0.03% of the total ration DM; Se premix (contained a minimum of 0.06% Se) for 0.05% of the total ration DM.
4Estimated based on NRC (2001).
Measurement and sample collection
Calf birth BW was recorded and calving difficulty was scored based on a 5-point scale (1 = no problem, 2 = slight problem, 3 = needed assistance, 4 = considerable force and 5 = extreme difficulty; National Association of Animal Breeders; Columbia, MO, USA). Calf birth BW and calving difficulty score were used as additional allocation criteria to detect any differences in calving events that might predispose cows to health-related disorders that were not related to treatments studied. The health of each cow was monitored and recorded on a daily basis. Metabolic and health-related disorders were diagnosed and treated by the veterinarian, as needed, according to Pennsylvania State University Veterinary Standard Operating Procedures.
Body condition was scored weekly by three individuals using a 1 to 5 scale (1 = thin to 5 = overweight; Wildman et al., Reference Wildman, Jones, Wagner, Boman, Troutt and Lesch1982). Individual feed intake was recorded daily from parturition through 21 days in milk (DIM). Milk yield and BW were recorded daily at each milking. Milk from individual cows was sampled from two consecutive milkings weekly at days 6 (±2.4 s.d.), 13 (±2.5 s.d.) and 20 (±1.8 s.d.) of lactation. Samples of milk were preserved using 2-bromo-2-nitropropane-1,3-diol and analyzed for components. Morning and evening samples were analyzed separately to allow for adjustments resulting from differing yields between morning and evening milking. One sample of the basal lactating cow TMR was collected weekly and stored at −20°C for further dry matter (DM) and chemical analysis.
Blood samples were collected via venipuncture of the coccygeal vein into evacuated tubes (Becton Dickinson, Rutherford, NJ, USA) approximately 2 h after the morning feeding at days 4 (±0.59 s.d.), 7 (±1.50 s.d.), 14 (±1.29 s.d.) and 21 (±1.28 s.d.) of lactation. Blood tubes with potassium oxalate and 4% sodium fluoride were used for collecting plasma for analysis of glucose concentration. Blood tubes with sodium heparin were used for collecting plasma for analyses of BHBA, NEFA and urea nitrogen (BUN) concentrations. Blood tubes (serum separation tube) with a clot activator were used for collecting serum for analyses of insulin, aspartate aminotransferase (AST) and cholesterol concentrations. Blood tubes were transported on ice to the laboratory within 1 h after sampling. Plasma was separated from whole blood by centrifuging blood tubes at 3000 × g for 15 min at 4°C. Blood tubes for serum collection were allowed to sit for approximately 0.5 h and centrifuged at 1000 × g for 15 min at room temperature to separate serum. Plasma and serum samples were recovered and stored frozen at −20°C until further analyses. Concentrations of milk ketones (Keto-Test; Sanwa Kagaku Kenkyusho Co. Ltd, Nagoya, Japan) and urine ketones (Ketostix; Bayer Corp., Elkhart, IN, USA) were measured weekly at days 6, 13 and 20 (±2.0 pooled s.d.) of lactation.
Laboratory analyses
Samples of the stored TMR were thawed at room temperature and dried for 48 h at 55°C in a forced air oven and ground in a Wiley mill (A. H. Thomas Co., Philadelphia, PA, USA) through a 1-mm screen. Samples of TMR were composited by month and analyzed for DM, crude protein (CP), ether extract, acid detergent fiber (ADF), neutral detergent fiber (NDF) and minerals by wet chemistry (Dairy One Forage Testing Laboratory, Ithaca, NY, USA). DM was determined by drying at 135°C for 2 h (method 930.15; Association of Official Analytical Chemists, 2005). Nitrogen was determined by combustion (Leco Instruments Inc., St. Joseph, MI, USA) (method 990.03; AOAC, 2005) and multiplied by 6.25 to obtain CP. Ether extract (fat) was determined using a Tecator Soxtec System (method 2003.05; AOAC, 2005). ADF and NDF were determined using the ANKOM A200 Filter Bag Technique (ANKOM Technology, Macedon, NY, USA), according to Van Soest et al. (Reference Van Soest, Robertson and Lewis1991), with heat-stable amylase and sodium sulfite used in the NDF procedure. Minerals were determined using a Thermo Jarrell Ash IRIS Advantage HX Inductively Coupled Plasma Radial Spectrometer (Thermo Instrument Systems Inc., Waltham, MA, USA). Nutrient composition of the TMR is reported in Table 1.
Milk samples were analyzed for content of fat, true protein, lactose, milk urea nitrogen (MUN) and somatic cell counts (SCC) by Pennsylvania Dairy Herd Improvement Association (University Park, PA, USA). Fat, protein, lactose and MUN were determined using infrared spectroscopic method (method 927.16; AOAC, 2005) (MilkoScan 4000; Foss Electric, Hillerød, Denmark). SCC were determined using optical somatic cell counting method (method 978.26; AOAC, 2005) (Fossomatic 400; Foss Electric). Plasma samples were analyzed for concentrations of glucose based on the methods of Trinder (Reference Trinder1969), BHBA based on the methods of Williamson et al. (Reference Williamson, Mellanby and Krebs1962), BUN based on the methods of Marsh et al. (Reference Marsh, Fingerhut and Miller1965) and Crocker (Reference Crocker1967) (Glucose Test, procedure no. 1075; LiquiColor Test, procedure no. 2440; and Urea Nitrogen Kit, procedure no. 0580 for glucose, BHBA and BUN, respectively; Stanbio Laboratory Inc., Boerne, TX, USA) and NEFA with modification by Johnson and Peters (Reference Johnson and Peters1993) (NEFA C Assay Kit; Wako Chemicals USA, Inc., Richmond, VA, USA). Serum samples were analyzed for concentrations of insulin using a radioimmunoassay (Coat-A-Count Insulin Kit no. TKINX; Diagnostic Products Corp., Los Angeles, CA, USA), and AST and cholesterol using a Hitachi 911 biochemistry analyzer (Boehringer Mannheim, Mannheim, Germany).
Calculations
Incidence of subclinical ketosis was calculated as the proportion of cows that had plasma BHBA concentration ⩾1400 μmol/l (Duffield et al., Reference Duffield, Sandals, Leslie, Lissemore, McBride, Lumsden, Dick and Bagg1998; Carrier et al., Reference Carrier, Stewart, Godden, Fetrow and Rapnicki2004) at the time of blood sampling. The percentage of cows that experienced single episode of subclinical ketosis was calculated as the proportion of cows that had plasma BHBA concentration ⩾1400 μmol/l at one sampling time point. The percentage of cows that experienced multiple episodes of subclinical ketosis was calculated as the proportion of cows that had plasma BHBA concentration ⩾1400 μmol/l at multiple sampling time points.
Estimated energy balance was calculated for each cow. Net energy intake (NEI; Mcal/day) was calculated by multiplying the dry matter intake (DMI) by the calculated energy density of the diet. The extra energy provided by PG was included in NEI. Net energy required for body maintenance (NEM; Mcal/day) was calculated as BW0.75 × 0.08 (NRC, 2001). Net energy required for milk production (NEL; Mcal/day) was calculated as milk yield (kg) × [(0.0929 × fat %) + (0.0563 × protein %) + (0.0395 × lactose %)] (NRC, 2001). Estimated energy balance was calculated as NEI/(NEM + NEL) × 100 and expressed as percentage of the requirement.
The quantity of milk was adjusted to an equal energy basis using the formula: four percent fat-corrected milk (4% FCM) = (0.4 × milk yield) + [15 × (% fat/100) × milk yield]. Efficiency of the 4% FCM milk was calculated as the ratio of kg of 4% FCM to kg of DMI. Change in BW was calculated as the difference between the mean BW from 1 to 3 DIM and the mean BW from 19 to 21 DIM. Change in body condition score (BCS) was calculated as the difference between the mean BCS at dry-off (60 days before the expected calving date) and the mean BCS at the 3rd week of lactation.
Statistical analysis
The experiment was conducted as a completely randomized design with randomization restricted to balance for expected calving date, lactation number, previous lactation 305-day mature-equivalent milk production and initial BCS at dry-off (60 days before parturition). The number of cows originally assigned to the control and treatment groups were 45 (15 per group), and all went through the experiment. However, eight cows (five multiparous and three primiparous) were removed from the statistical analysis due to factors that were not related to the treatments studied. The incidences of twinning and health-related disorders were compared between treatments using PROC FREQ (Fisher’s exact test; SAS Institute, 1999). Milk yield for the first 3 days of lactation were excluded to avoid sampling of colostrum and, therefore, their corresponding feed efficiencies were not calculated. Daily measurements for DMI, milk yield and BW were condensed to weekly means before statistical analysis. Data were analyzed as repeated measures using PROC MIXED (SAS Institute, 1999). The initial statistical model included age (multiparous or primiparous), treatment (control, top dress or mixing), time of sampling (DIM or week) and their interactions. If the two-way age × treatment interaction and the three-way age × treatment × time interaction were not significant (P > 0.05), the age effect and its related interactions were removed from the initial model and only the treatment and time effects, and their interaction were included in the final model. Degrees of freedom were estimated using the Kenward–Roger option in the MODEL statement (Kenward and Roger, Reference Kenward and Roger1997). Cow nested within treatment was used in the RANDOM statement. Time of sampling (DIM or week) was used in the REPEATED statement. Time series covariance structure was modeled using the options of autoregressive order one, compound symmetry, and unstructured to fit equally spaced repeated measures and spatial power to fit unequally spaced repeated measures (Littell et al., Reference Littell, Milliken, Stroup and Wolfinger1996; Bryant et al., Reference Bryant, Rivera, Galyean, Duff, Hallford and Montgomery1999). The best time-series covariance structure was selected based on the lowest Akaike and Bayesian information criteria (Littell et al., Reference Littell, Henry and Ammerman1998). The PDIFF option was used for multiple-comparison tests. For response variables that were not measured over time (pre-experimental measurements and incidence of subclinical ketosis), PROC GLM (SAS Institute, 1999) was used and the statistical model included effects of treatment, time and their interaction. Data are presented as means ± s.d. or least squares means ± s.e. Statistical significance was declared at P ⩽ 0.05 and a tendency to significance was declared at 0.05 < P ⩽ 0.10.
Results
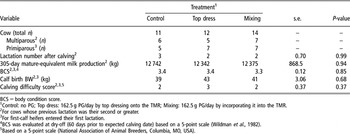
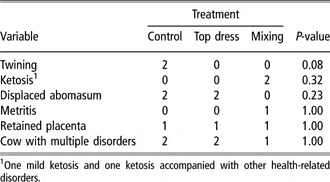
Allocation, calf birth BW and calving difficulty score were similar among treatments (Table 2). The control cows tended (P = 0.08) to have a greater twinning rate (one multiparous and one primiparous cow out of 11 cows) compared with other groups of cows (Table 3). This greater twinning rate found in the control cows was not related to PG supplementation and did not seem to result in a higher incidence of health-related disorders due to twinning, as indicated by a similar incidence of health-related disorders among treatments.
Pre-experimental measurements for Holstein dairy cows not supplemented or supplemented with dry propylene glycol (PG) as a top dress, or by incorporating it into the total mixed ration (TMR) from parturition through 21 days postpartum

BCS = body condition score.
1Control: no PG; Top dress: 162.5 g PG/day by top dressing onto the TMR; Mixing: 162.5 g PG/day by incorporating it into the TMR.
2For cows whose previous lactation was their second or greater.
3For first-calf heifers entered their first lactation.
4BCS was evaluated at dry-off (60 days prior to expected calving date) based on a 5-point scale (Wildman et al., Reference Wildman, Jones, Wagner, Boman, Troutt and Lesch1982).
5Based on a 5-point scale (National Association of Animal Breeders, Columbia, MO, USA).
Incidences of twinning and health-related disorders for Holstein dairy cows not supplemented or supplemented with dry propylene glycol (PG) as a top dress, or by incorporating it into the total mixed ration from parturition through 21 days postpartum

1One mild ketosis and one ketosis accompanied with other health-related disorders.
Production
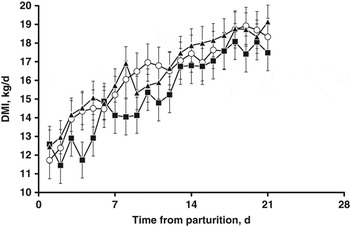
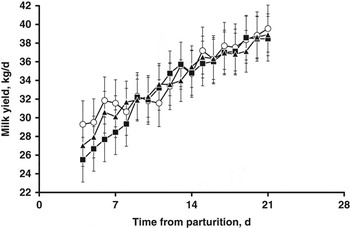
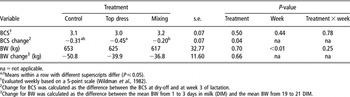
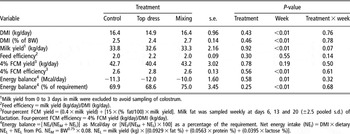
Body condition score, BW and changes for BW did not differ among treatments (Table 4). Cows receiving dry PG as a top dress lost more BCS from dry-off (60 days before the expected calving date) to the 3rd week of lactation compared with cows receiving dry PG as a part of the TMR (0.45 v. 0.2 unit, P = 0.04). However, the average loss of BCS or BW for cows used in the present study was within the normal range of body reserve mobilization during the first 3 weeks of lactation, as suggested by Hutjens (Reference Hutjens1996). DMI, milk yield, feed efficiency, 4% FCM yield and efficiency, and calculated energy balance were not affected by PG supplementation (Table 5). Similar feed intakes among treatments indicated that the dry PG product used in the current study was palatable or at least had no adverse effect on intake (Figure 1). Similar feed intakes among treatments also suggested that the effects of PG, either as a top dress or as a part of the TMR, were not confounded by the variability in DMI (Grummer et al., Reference Grummer, Winkler, Bertics and Studer1994; Christensen et al., Reference Christensen, Grummer, Rasmussen and Bertics1997). A tendency (P = 0.07) toward a significant treatment × week interaction was observed for milk yield. For cows supplemented with PG, either by top dressing PG onto the TMR or by incorporating PG into the TMR, milk yield increased at a faster rate than for the control cows (Figure 2). This difference found in the rate of increase in milk yield was due to PG-supplemented cows having numerically lower milk yield during the 1st week of lactation compared with the control cows. However, the rate of milk production over time became similar for PG-supplemented cows compared with the control cows after 9 days into lactation. It is possible that PG tended to reduce milk yield during the first 9 days of supplementation, however, overall total milk production during the entire supplementation period was not affected by PG. Therefore, an explanation for this treatment by week interaction on milk yield could not be concluded.
Dry matter intake for Holstein dairy cows not supplemented (○) or supplemented with dry propylene glycol as a top dress (▪) or by incorporating it into the total mixed ration (▴) from parturition through 21 days postpartum. Treatment: P = 0.43; week: P < 0.01; treatment × week: P = 0.76; pooled s.e. = 0.97.

Milk yield for Holstein dairy cows not supplemented (○) or supplemented with dry propylene glycol as a top dress (▪) or by incorporating it into the total mixed ration (▴) from parturition through 21 days postpartum. Treatment: P = 0.92; week: P < 0.01; treatment × week: P = 0.07; pooled s.e. = 2.52.

Body condition score (BCS) and BW and changes for BCS and BW for Holstein dairy cows not supplemented or supplemented with dry propylene glycol (PG) as a top dress, or by incorporating it into the total mixed ration from parturition through 21 days postpartum

na = not applicable.
a,bMeans within a row with different superscripts differ (P ⩽ 0.05).
1Evaluated weekly based on a 5-point scale (Wildman et al., Reference Wildman, Jones, Wagner, Boman, Troutt and Lesch1982).
2Change for BCS was calculated as the difference between the BCS at dry-off and at week 3 of lactation.
3Change for BW was calculated as the difference between the mean BW from 1 to 3 days in milk (DIM) and the mean BW from 19 to 21 DIM.
Dry matter intake (DMI), milk yield, feed efficiency, 4% fat-corrected milk (FCM) yield and efficiency, and estimated energy balance for Holstein dairy cows not supplemented or supplemented with dry propylene glycol (PG) as a top dress, or by incorporating it into the total mixed ration from parturition through 21 days postpartum

1Milk yield from 0 to 3 days in milk were excluded to avoid sampling of colostrum.
2Feed efficiency = milk yield (kg/day)/DMI (kg/day).
3Four-percent FCM yield = (0.4 × milk yield) + [15 × (% fat/100) × milk yield]. Milk fat was sampled weekly at days 6, 13 and 20 (±2.5 pooled s.d.) of lactation. Four-percent FCM efficiency = 4% FCM yield (kg/day)/DMI (kg/day).
4Energy balance =[ NEI/(NEM + NEL)] as Mcal/day or [NEI/(NEM + NEL) × 100] as a percentage of the requirement. Net energy intake (NEI) = DMI × dietary NEL + NEL from PG. NEM = BW0.75 × 0.08. NEL = milk yield (kg) × [(0.0929 × fat %) + (0.0563 × protein %) + (0.0395 × lactose %)].
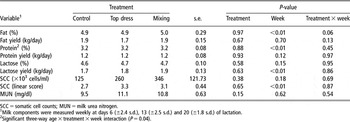
Supplementation of PG had no effects on percentage or yield of any milk components (Table 6). A tendency (P = 0.06) toward a significant two-way treatment × week interaction was observed for milk fat percentage. The percentage of milk fat at week 1 of lactation was significantly greater (P ⩽ 0.05) for cows supplemented with PG as a top dress, compared with cows supplemented with PG by incorporating it into the TMR (6.3% v. 5.2%, respectively). A significant (P = 0.04) three-way age × treatment × week interaction was observed for milk protein percentage. This three-way interaction found for milk protein percentage was due to the multiparous cows fed diets supplemented with PG as a top dress having a greater (P ⩽ 0.05) percentage of milk protein at week 1 of lactation compared with all other cows (4.1% v. 3.5%, respectively).
Percentage and yield of milk components for Holstein dairy cows not supplemented or supplemented with dry propylene glycol (PG) as a top dress or by incorporating it into the total mixed ration from parturition through 21 days postpartum

SCC = somatic cell counts; MUN = milk urea nitrogen.
1Milk components were measured weekly at days 6 (±2.4 s.d.), 13 (±2.5 s.d.) and 20 (±1.8 s.d.) of lactation.
2Significant three-way age × treatment × week interaction (P = 0.04).
Blood parameters
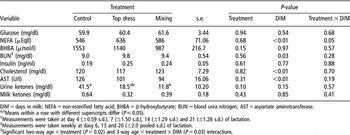
Supplementation of PG did not affect plasma and serum metabolites, serum insulin and milk ketones (Table 7). Concentrations of urine ketones tended (P = 0.10) to be reduced by PG supplementation from 41.5 to 15.2 mg/dl. This reduction in urine ketones by PG supplementation may be explained by the numerically lower (P = 0.15) plasma BHBA concentrations observed for cows supplemented with PG (Table 7). Concentrations of BUN were significantly affected by a two-way age × treatment and a three-way age × treatment × DIM interactions (P = 0.02 and 0.03, respectively). These significant interactions for BUN were due to the multiparous cows fed diets supplemented with PG as a top dress having significantly greater BUN at 4 and 7 DIM (14.2 and 12.7 mg/dl, respectively; P ⩽ 0.5).
Concentration of blood metabolitesFootnote 1 and urine and milk ketonesFootnote 2 for Holstein dairy cows not supplemented or supplemented with dry propylene glycol (PG) as a top dress or by incorporating it into the total mixed ration from parturition through 21 days postpartum

DIM = days in milk; NEFA = non-esterified fatty acid; BHBA = β-hydroxybutyrate; BUN = blood urea nitrogen; AST = aspartate aminotransferase.
a,b Means within a row with different superscripts differ (P ⩽ 0.05).
1 Measurements were taken at day 4 (±0.59 s.d.), 7 (±1.50 s.d.), 14 (±1.29 s.d.) and 21 (±1.28 s.d.) of lactation.
2 Measurements were taken weekly at dasy 6, 13 and 20 (±2.0 pooled s.d.) of lactation.
3 Significant two-way age × treatment (P = 0.02) and 3-way age × treatment × DIM (P = 0.03) interactions.
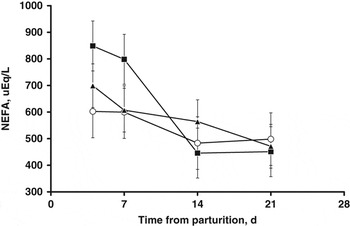
A significant (P = 0.05) two-way treatment × DIM interaction was observed for plasma NEFA concentration. Cows receiving PG supplementation as a top dress started their lactation off with a relatively greater plasma NEFA concentration at 4 DIM, and this greater plasma NEFA concentration persisted to 7 DIM and was significantly reduced at 14 DIM (Figure 3). Whereas, cows receiving no PG or PG supplementation as a part of the TMR started their lactations off with a relatively lower plasma NEFA concentration from 4 to 7 DIM. Even though the control cows and cows receiving PG as a part of the TMR had relatively lower plasma NEFA levels compared with cows receiving PG as a top dress, the overall plasma NEFA levels for all cows at 4 and 7 DIM were above the cut-off value of 500 μEq/l suggesting that all cows were mobilizing body fat (LeBlanc et al., Reference LeBlanc, Leslie and Duffield2005).
Plasma non-esterified fatty acids for Holstein dairy cows not supplemented (○) or supplemented with dry propylene glycol as a top dress (▪) or by incorporating it into the total mixed ration (▴) from parturition through 21 days postpartum. Treatment: P = 0.68; days in milk (DIM): P < 0.01; treatment × DIM: P = 0.05; pooled s.e. = 99.0.

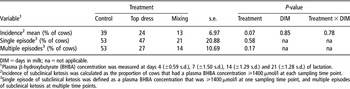
The level of plasma BHBA at ⩾1400 μmol/l was used as the cut-off value for diagnosis of subclinical ketosis in this experiment (Duffield et al., Reference Duffield, Sandals, Leslie, Lissemore, McBride, Lumsden, Dick and Bagg1998; Carrier et al., Reference Carrier, Stewart, Godden, Fetrow and Rapnicki2004). Supplementation of PG tended (P = 0.07) to decrease the overall mean incidence of subclinical ketosis from 39% to 24% to 13% for cows not supplemented with PG, cows supplemented with PG by top dressing it onto the TMR, and cows supplemented with PG by incorporating it into the TMR, respectively (Table 8). The percentage of cows experiencing single or multiple episodes of subclinical ketosis during the course of the experiment was similar among treatments.
Incidence of subclinical ketosis and the percentage of cows experiencing single or multiple episodes of subclinical ketosis for Holstein dairy cows not supplemented or supplemented with dry propylene glycol (PG) as a top dress or by incorporating it into the total mixed ration from parturition through 21 days postpartum

DIM = days in milk; na = not applicable.
1Plasma β-hydroxybutyrate (BHBA) concentration was measured at days 4 (±0.59 s.d.), 7 (±1.50 s.d.), 14 (±1.29 s.d.) and 21 (±1.28 s.d.) of lactation.
2Incidence of subclinical ketosis was calculated as the proportion of cows that had a plasma BHBA concentration ⩾1400 μmol/l at each sampling time point.
3Single episode of subclinical ketosis was defined as a plasma BHBA concentration that was ⩾1400 μmol/l at one sampling time point, and multiple episodes of subclinical ketosis at multiple time points.
Discussion
The lack of serum insulin and plasma glucose responses to PG supplementation observed in the current study could be explained by the tight regulation of insulin release and glucose homeostasis by insulin (Brockman and Laarveld, Reference Brockman and Laarveld1986). Time of blood sampling could also affect insulin and glucose levels after PG supplementation. Plasma glucose usually peaks within the first 1.5 h after a bolus dose of PG, such as drenching or top dressing, and returns to its baseline at 3 h (Studer et al., Reference Studer, Grummer, Bertics and Reynolds1993; Grummer et al., Reference Grummer, Winkler, Bertics and Studer1994; Christensen et al., Reference Christensen, Grummer, Rasmussen and Bertics1997). Serum insulin, however, usually reaches its first peak within 30 min after PG supplementation before the glucose peak (Studer et al., Reference Studer, Grummer, Bertics and Reynolds1993; Grummer et al., Reference Grummer, Winkler, Bertics and Studer1994) as a result of an increase in propionate absorption from the rumen (Manns and Boda, Reference Manns and Boda1967; Manns et al., Reference Manns, Boda and Willes1967). Serum insulin usually returns to its baseline level at around 2 h after PG supplementation (Studer et al., Reference Studer, Grummer, Bertics and Reynolds1993; Grummer et al., Reference Grummer, Winkler, Bertics and Studer1994). In the current study, blood was sampled only once, 2 h after PG supplementation at each sampling time point; therefore, it was likely that the peak insulin and glucose responses were missed. In earlier studies (Waldo and Schultz, Reference Waldo and Schultz1960; Studer et al., Reference Studer, Grummer, Bertics and Reynolds1993; Grummer et al., Reference Grummer, Winkler, Bertics and Studer1994; Christensen et al., Reference Christensen, Grummer, Rasmussen and Bertics1997), when blood were serially sampled for at least 1.5 h after PG administration, blood glucose and insulin concentrations were increased by PG. In contrast, PG did not affect blood glucose and insulin in other earlier studies (Sauer et al., Reference Sauer, Erfle and Fisher1973; Pickett et al., Reference Pickett, Piepenbrink and Overton2003) and the current study in which blood was sampled only once daily. Therefore, frequent sampling immediately after PG administration is necessary to monitor the effects of PG on blood insulin and glucose concentrations.
The reasons as to why plasma BHBA levels were numerically reduced by PG supplementation via both delivery methods in the current study could be attributed to: (i) an increase in serum insulin concentration as a response to an increase in blood propionate concentration from microbial degradation of PG in the rumen (Kristensen and Raun, Reference Kristensen and Raun2007) and/or (ii) an increase in tissue affinity for BHBA induced by PG directly or via endogenous metabolites (Kristensen et al., Reference Kristensen, Danfaer, Rojen, Raun, Weisbjerg and Hvelplund2002). Insulin is a potent antilipolytic factor which reduces lipolysis in adipose tissue, thereby, reducing the release of NEFA from adipocytes to the liver (West and Passey, Reference West and Passey1967). Kronfeld (Reference Kronfeld1965) demonstrated that by intravenously injecting insulin, plasma NEFA levels were decreased in milking dairy cows. Hepatic uptake of plasma NEFA is proportional to the concentration of NEFA in plasma (Heimberg et al., Reference Heimberg, Wilcox, Dunn, Woodside, Breen and Soler-Argilaga1974); therefore, a reduction in hepatic uptake of NEFA results in a reduction in hepatic ketogenesis (Brockman and Laarveld, Reference Brockman and Laarveld1986). The effects of PG supplementation on reducing plasma NEFA and BHBA concentrations were reported in various studies via drenching (Studer et al., Reference Studer, Grummer, Bertics and Reynolds1993; Juchem et al., Reference Juchem, Santos, Imaizumi, Pires and Barnabe2004) or feeding (Fisher et al., Reference Fisher, Erfle and Sauer1971; Sauer et al., Reference Sauer, Erfle and Fisher1973; Hoedemaker et al., Reference Hoedemaker, Prange, Zerbe, Frank, Daxenberger and Meyer2004) PG to cows in the transition period or early lactation. In the current study, concentration of plasma NEFA was not affected by treatments. The reduction in plasma BHBA concentration observed was lower than in previous studies mentioned likely due to the lower amount (162.5 g/head per day) of PG supplemented. Sauer et al. (Reference Sauer, Erfle and Fisher1973) also reported smaller reductions in plasma NEFA and BHBA levels when supplementing PG to cows at 154 v. 308 g/day.
The major site for PG metabolism seems to be in the rumen by rumen microorganism rather than in the liver of cows (Kristensen et al., Reference Kristensen, Danfaer, Rojen, Raun, Weisbjerg and Hvelplund2002). PG is metabolized in the rumen rapidly as it has been shown to disappear from the rumen within 4 h of its infusion (Clapperton and Czerkawski, Reference Clapperton and Czerkawski1972; Kristensen and Raun, Reference Kristensen and Raun2007), whereas its intermediary metabolism in the lactating cow is relatively slow (Kristensen et al., Reference Kristensen, Danfaer, Rojen, Raun, Weisbjerg and Hvelplund2002; Kristensen and Raun, Reference Kristensen and Raun2007). Kristensen and Raun (Reference Kristensen and Raun2007) estimated that between 33% and 45% of PG infused into the rumen was metabolized to propanol and propionate within the rumen and 19% of the infused PG escaped rumen degradation and was taken up and oxidized to l-lactate in the liver. Propanol, from hepatic uptake, is metabolized to propionate and this propionate is partly released to the blood (Kristensen and Raun, Reference Kristensen and Raun2007). The modes of action for PG and its metabolites to affect metabolism of the cows as proposed by Kristensen and Raun (Reference Kristensen and Raun2007) are by: (i) increasing supplies of l-lactate and propionate for hepatic gluconeogenesis and (ii) decreasing glucose utilization by peripheral tissues (mainly skeletal muscle and adipocytes) induced by increased concentrations of blood PG and propanol and/or a decreased ratio of ketogenic to glucogenic metabolites in the blood.
Drenching PG using either an esophageal tube or a drenching gun, as opposed to feeding, could likely lead to a greater portion of PG by-passing the rumen due to the esophageal reflex. However, Christensen et al. (Reference Christensen, Grummer, Rasmussen and Bertics1997) showed that the ability of PG, via oral drenching, to increase serum insulin and decrease plasma NEFA concentrations was comparable to the delivery method of feeding PG in concentrate. This similar glucogenic capacity of PG between delivery methods of oral drenching and bolus feeding (e.g. feeding in concentrate separately from forage or top dressing), could probably be explained by the diffusion of PG from the blood stream to the rumen (Raun et al., Reference Raun, Kristensen and Harmon2004) after the PG that bypasses the rumen is absorbed from the lumen of the small intestines.
Bolus feeding of PG such as drenching, top dressing or feeding in concentrate seems to be more effective than feeding PG as a part of the TMR via incorporating PG into the TMR, due to the ability of a bolus PG to maintain high plasma levels for a long period of time as opposed to a slow-release PG (Kristensen and Raun, Reference Kristensen and Raun2007). However, from results of Christensen et al. (Reference Christensen, Grummer, Rasmussen and Bertics1997) and the current study that compared feeding methods of PG, responses of blood insulin or metabolites were only measured for a duration of time (usually the first few hours after PG feeding) or once per day; and in that sampling period or time point, the total amount of PG consumed was relatively less for feeding PG by incorporating it into the TMR compared with bolus feedings. Therefore, feeding PG as a part of the TMR may have been less effective due to the smaller amount of PG ingested. A comparison between feeding PG at once (bolus PG) and feeding PG in several smaller portions (slow-release PG) for a certain time period is required to study whether a high plasma concentration is required for PG to effectively affect the metabolism of cow or if it is the total amount of PG ingested that has an impact on metabolism. In field conditions, group feeding may sometimes be the only way to deliver PG as a glucogenic supplement or preventive for subclinical ketosis. Reducing the refusal rate or allocating PG to the first feeding by multiple feedings can facilitate a complete consumption of the daily dosage of PG.
The multiparous cows supplemented with PG as a top dress in the current study had greater milk fat and protein percentages during the 1st week of lactation, however, these increases in milk fat and protein percentages were likely a reflection of mobilization of body reserves rather than a true PG effect, because plasma BUN and NEFA concentrations were also increased at the same time.
The incidence (39%) of subclinical ketosis observed in the control cows in the current study seemed to be high compared with 7.6% reported by Carrier et al. (Reference Carrier, Stewart, Godden, Fetrow and Rapnicki2004) using the same blood BHBA cut-off value at ⩾1.400 μmol/l. However, a similar high incidence of subclinical ketosis was reported by Duffield et al. (Reference Duffield, Sandals, Leslie, Lissemore, McBride, Lumsden, Dick and Bagg1998) in which a lower blood BHBA cut-off value at ⩾1200 μmol/l was used.
In summary, supplementation of 162.5 g PG/day as a dry product by top dressing onto the TMR or by mixing it into the TMR numerically reduced concentrations of urine ketones from moderate (40 mg/dl) to low (15 mg/dl). The incidence for subclinical ketosis was subsequently decreased from 39% to 24% to 13% for cows supplemented with no PG, with PG as a top dress, and with PG as a part of the TMR, respectively, during the first 3 weeks of lactation based on the cut-off value of plasma BHBA at ⩾1400 μmol/l for diagnosis of subclinical ketosis suggested in the literature. Both the multiparous and primiparous cows were responsive to PG, suggesting that the first-calf heifers may also benefit from a readily available glucogenic compound after parturition. It is concluded that supplementing PG as a dry product via incorporating into the TMR is as effective as when used as a top dress, based on the efficacies of both delivery methods, to numerically reduce urine ketones concentrations and therefore, the incidence for subclinical ketosis during early lactation. However, it should be noted that the number of cows used in the current study was minimal, and more cows are needed to confirm the efficacy of supplementing PG as a dry product on reducing the prevalence of subclinical ketosis in dairy cows during the 1st month of lactation.
Acknowledgements
Funding was supported, in part, by Probiotech International Inc. (Saint-Hyacinthe, QC, Canada). Greatest gratitude is expressed to all personnel at the Pennsylvania State University Dairy Cattle Research and Education Center (University Park, PA, USA) for their constant care for the cows. Technical assistances provided by T. W. Cassidy, K. S. Heyler and S. L. Ward, and statistical suggestions provided by Dr C. Dechow are greatly appreciated.