Implications
Microbial phytase supplementation has proven to be an effective method of improving phosphorus (P) digestibility in plant feedstuffs. Screen size or particle size reduction enhances microbial phytase efficacy on phytate degradation presumably because it increases the accessibility of microbial phytase to the substrate. The combined effect of screen size and microbial phytase increased phytate degradation rate and reduced phytate degradation time in maize and maize–soybean incubated in water. These results imply that an optimal combination of small particle size and soaking time in liquid feeding systems may maximize the efficacy of microbial phytase in releasing P from phytate.
Introduction
Microbial phytase increases the apparent total tract digestibility of phosphorus (P) in pigs, but only to a maximum of about 44% to 59% in maize–soybean meal (SBM)-based diets fed low inorganic P addition (Brana et al., Reference Brana, Ellis, Castaneda, Sands and Baker2006; Emiola et al., Reference Columbus, Niven, Zhu and de Lange2009; Kerr et al., Reference Kasim and Edwards2010). Thus, there is an increased focus on maximization of the efficacy of phytase to improve P digestibility further by ‘pre-digestion’ methods (soaking, fermentation) (Pedersen and Stein, Reference Pedersen and Stein2010; Blaabjerg et al., Reference Blaabjerg, Carlsson, Hansen-Møller and Poulsen2010a) and feed processing (grinding, pelleting, heat treatment) (Oryschak et al., Reference Oryschak, Simmins and Zijlstra2002; Pedersen and Stein, Reference Pedersen and Stein2010; Blaabjerg et al., Reference Blaabjerg, Jorgensen, Tauson and Poulsen2010b).
Liquid feeding with the presence of endogenous phytase or microbial phytase addition has been shown to improve P digestibility in pigs because of the degradation of phytate before feeding (Lyberg et al., Reference Liu, Bollinger, Ledoux, Ellersieck and Veum2006; Blaabjerg and Poulsen, Reference Blaabjerg and Poulsen2010; Blaabjerg et al., Reference Blaabjerg, Strathe and Poulsen2010b). However, the effect of liquid feeding on the degradation of phytate depends on the type of feed, feed processing, phytase activity and soaking/fermentation time (Carlson and Poulsen, Reference Brana, Ellis, Castaneda, Sands and Baker2003; Blaabjerg et al., Reference Blaabjerg, Jorgensen, Tauson and Poulsen2010a). This may explain the conflicting results on the effect of liquid feeding on P digestibility in maize and SBM-based diets (Liu et al., Reference Koch1997; Columbus et al., Reference Carlson and Poulsen2010; Pedersen and Stein, Reference Pedersen and Stein2010).
Grinding may improve the availability of nutrients possibly because of the particle size reduction, increasing the particle surface area and the accessibility for digestive enzymes (Mansfield et al., Reference Lyberg, Lundh, Pedersen and Lindberg1999; Amerah et al., Reference Amerah, Gilbert, Simmins and Ravindran2011). Only few studies have investigated the effect of feed particle size in combination with microbial phytase supplementation. Oryschak et al. (Reference Oryschak, Simmins and Zijlstra2002) concluded that the effects of microbial phytase and particle size were additive; the combination of particle size reduction and microbial phytase supplementation improved P digestibility and retention, and reduced P excretion in grower pigs. Amerah and Ravindran (Reference Amerah and Ravindran2009) also reported that microbial phytase supplementation increased ileal P digestibility in broilers when decreasing particle size of maize-based diet. On the other hand, Kasim and Edwards (Reference Haug and Lantzsch2000) stated that increased particle size and microbial phytase supplementation increased the P retention in broilers fed a maize-based diet.
Hammer velocity and screen size are two main parameters that affect particle size when a hammer mill is used to grind feedstuffs (Koch, Reference Kerr, Weber, Miller and Southern2002). Feed particle size can be measured by the Laser Diffraction method (Laser method), which is designed for use in laboratories – or the Bygholm method – which is designed for use on farms. According to Benz et al. (Reference Benz, Tokach, Groesbeck, Dritz, Nelssen and DeRouchey2005), the Bygholm method is an alternative method for farmers by providing an inexpensive and practical equipment. On the basis of the study by Nathier-Dufour et al. (Reference Nathier-Dufour, Bougeard, Devaux, Bertrand and Le Deschault de Monredon1993), the Laser method is rapid, easy and less time-consuming compared with the standard sieving method, which uses a set of standard woven wire test sieves. However, limited studies have been conducted to investigate the accuracy and practicality of these methods.
The hypothesis of the current study is that the effect of screen size in combination with microbial phytase addition improves phytate degradation. Therefore, the objective is to evaluate the effect of screen size and microbial phytase addition on phytate degradation in maize and SBM by an in vitro method simulating liquid feeding. In addition, the current study examined the effect of screen size on particle size by using two methods (the Laser and Bygholm methods).
Material and methods
Experimental design
The experiment was a 3×3×2 factorial design: three feeds (maize (100% maize), SBM (100% SBM) and maize–SBM (75% maize and 25% SBM)); three levels of screen size (1, 2 and 3 mm); and two levels of microbial phytase supplementation (0 and 1000 FTU/kg as-fed; Natuphos 5000, BASF, Germany). The feeds were ground by a laboratory hammer mill (Aarslev Machinery, Aarslev, Denmark).
Experimental procedure
Feed samples (200 g) were mixed with water (preheated to 38°C) in 1 l closed containers with continuous stirring (300 r.p.m.). The containers were placed in an incubator (New Brunswick Scientific Model G25 Controlled Environment Incubator Shaker; GST Technical Sales, Edmonton, Alberta, Canada) at 38°C (for further details see Carlson and Poulsen, Reference Brana, Ellis, Castaneda, Sands and Baker2003; Blaabjerg et al. Reference Blaabjerg, Carlsson, Hansen-Møller and Poulsen2010a). The ratio of feed : water was 1 : 3 (w/w) for maize and maize–SBM, and 1 : 4.5 (w/w) for SBM, because of the different water-absorption capacity. No attempt was made to control pH. Samples (50 ml) were collected at 0, 2, 4, 6, 8, 10 or 24 h of incubation and immediately frozen. Samples at 0 h were considered as non-incubated feed (no mixing with water). The pH was measured in connection with the sample collection at all time points, whereas samples at 0, 2, 4, 8 and 24 h were selected and further analysed. All incubations were performed in triplicates.
Physical analysis
Particle size distribution (PSD) and average particle size (APS) of the feed were determined in duplicate by the Laser method using a Beckman Coulter LS230 Laser Diffraction Particle Size Analyser (Beckman Coulter Inc., Miami, Florida, USA). Ground samples of feed (2 g) were mixed with water (ratio 2 : 1) and passed through the laser beam. The PSD (%) and the APS (µm) were recorded and calculated by LS230 Fluid Modules’ Software version 2.0I in the control computer connected to the equipment. Moreover, the PSD (%) of the feed was measured in triplicates by the Bygholm method using the Bygholm Feed Sieve (Engineering Centre Bygholm, Horsens, Denmark). The Bygholm Feed Sieve is a plastic box consisting of four compartments divided by three different screen sizes (3000, 2000 and 1000 µm). The first compartment was filled with the ground sample, and the sieve was shaken manually for at least 4.5 min until no more material passed through the smaller screen. The PSD was the percentage of ground samples deposited in each compartment based on the measured height of each compartment. Subsequently, the APS of the samples was calculated from the measured PSD using the following equation given by Benz et al. (Reference Benz, Tokach, Groesbeck, Dritz, Nelssen and DeRouchey2005):
 $${\vskip 9pt (1)}\eqalign{{\rm APS}\,\left( {{\rm \rmu m}} \right)\,=&\,{\minus}{\rm 25}.{\rm 1}\,{\plus}\,{\rm 22}.{\rm 363}w\,{\plus}\,{\rm 16}.{\rm 777}x\cr &\,{\plus}\,{\rm 3}.{\rm 894}y\,{\plus}\,{\rm 6}.{\rm 968}z$$
where w, x, y and z are PSD (%) of the sample above 3000, 2000 and 1000 µm screen and the bottom of the sieve (<1000 µm), respectively. The numbers presented in equation (1) were the regression coefficients of the regression curve to predict the actual APS, which was calculated from 20 ground maize samples with known particle size ranging from 568 to 1741 µm.
Chemical analysis
The pH was measured at 0, 2, 4, 6, 8, 10 or 24 h of incubation. The dry matter (DM) content of the feeds was measured by drying at 103°C for 20 h. The DM of incubated samples was determined by freeze-drying. Phytase activity was determined by the method of Engelen et al. (Reference Emiola, Akinremi, Slominski and Nyachoti1994), assuming that 1 FTU is the amount of enzyme that liberates 1 µM inorganic orthophosphate per minute from 0.0051 mol/l sodium phosphate at pH 5.5 and 37°C (detection limit: 50 FTU/kg DM). Total P was analysed using the colorimetric vanadomolybdate method of Stuffins (Reference Stuffins1967). Phytate P was measured according to Haug and Lantzsch (Reference Goodband, Tokach and Nelssen1983). All analyses were performed in duplicate.
Data analysis
All statistical analyses were carried out using SAS version 9.3 (SAS Institute Inc., 2010). Results are reported as means and residual standard error of ANOVA.
To evaluate the effects of screen size, microbial phytase supplementation and incubation time on phytate degradation, the MIXED procedure was carried out separately for each feed using the following model:
 $$Y_{{ijke}} =\mu {\plus}a_{i} {\plus}b_{j} {\plus}c_{k} {\plus}ab_{{ij}} {\plus}ac_{{ik}} {\plus}bc_{{jk}} {\plus}abc_{{ijk}} {\plus}{\varepsilon}_{{ijke}} \quad \quad \quad \quad {\varepsilon}_{{ijke}} \,\sim\,N(0,\sigma ^{2} e)$$
where Yijke is the dependent variable (phytate P); µ the overall mean; a i the effect of screen size (i=1, 2, 3 mm); b j the effect of microbial phytase (j=0, 1000 FTU/kg); c k the effect of incubation time (k=0, 2, 4, 8, 24 h); ab ij the interaction between screen size and microbial phytase; ac ik the interaction between screen size and incubation time; bc jk the interaction of microbial phytase and incubation time; abc ijk the interaction between screen size, microbial phytase and incubation time; and the repeated effect was incubation time and the autogressive order 1 covariance structure (AR(1)) was fitted.
The MODEL procedure in SAS was used to express the phytate degradation process during incubation time as the following: Y=Y
0×exp(−K
d
×t), where Y is the amount of undegraded phytate (phytate P, g/kg DM) in the sample after t hours of incubation, Y
0 the initial amount of phytate in the sample (phytate P, g/kg DM), K
d
the phytate degradation rate constant (/h) and t the incubation time (h). Owing to the very limited phytate degradation in experimental groups without microbial phytase addition, the equation was only fitted for each replicate, each experimental group and each feed with microbial phytase addition. The half-life (t
 $\scale70%{\vskip3pt{{\scale60%{\vskip-7pt1}{\hskip-3pt\vskip-5.6pt\rot160/}{\scale60%{\hskip-4pt\vskip0pt2}$
, h) is the time required to degrade 50% of the initial phytate P amount of the sample and was calculated as: t
 $\scale70%{\vskip3pt{{\scale60%{\vskip-7pt1}{\hskip-3pt\vskip-5.6pt\rot160/}{\scale60%{\hskip-4pt\vskip0pt2}$
=ln2/K
d
. The relative degradation rate of phytate was defined as the percentage of degraded phytate per hour (R
d
, %/h). R
d
is proportional to the undegraded phytate (phytate P g/kg DM) amount in the sample after each hour of incubation and was calculated as: R
d
=100–[exp(−Kd)×100]. For the microbial phytase-supplemented groups, K
d
, R
d
and t
 $\scale70%{\vskip3pt{{\scale60%{\vskip-7pt1}{\hskip-3pt\vskip-5.6pt\rot160/}{\scale60%{\hskip-4pt\vskip0pt2}$
were determined for each replicate. The effects of the experimental factors were analysed using the GLM procedure in SAS by the following model:
 $$Y_{{ij}} =\mu {\plus}a_{{ i}} {\plus}b_{{ j}} {\plus}ab_{{{ ij}}} {\plus}{\varepsilon}_{{ij}} \quad \quad \quad \quad \quad {\varepsilon}_{{{\rm ij}}} \,\sim\,N{\rm (0,}\sigma ^{2} {\rm e)}$$
where Y
ij
is the dependent variable (APS, K
d
, R
d
, t
 $\scale70%{\vskip3pt{{\scale60%{\vskip-7pt1}{\hskip-3pt\vskip-5.6pt\rot160/}{\scale60%{\hskip-4pt\vskip0pt2}$
), µ the overall mean, a
i
is the effect of screen size (i=1, 2, 3 mm), b
j
the effect of feed (j=maize; SBM; maize–SBM), and ab
ij
the interaction between screen size and feed. If an interaction was observed, a one-way ANOVA analysis was performed for each feed or each screen size. To evaluate the effects of feed and screen size on APS, only results from the Laser method were used. The independent t test procedure was used to compare the APS results of each sample between the two methods (Laser v. Bygholm). The differences were considered significant when P<0.05.
Results
Chemical analysis of the feeds
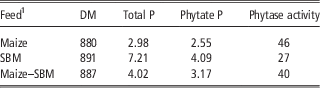
SBM had the highest phytate P content (4.09 g/kg DM) in comparison with maize (38% less) and maize–SBM (22% less) (Table 1). Plant phytase activity of maize and SBM was below the detection level.
DM (g/kg), total P, phytate P (g/kg DM) and phytase activity (FTU/kg DM) of feeds

DM=dry matter; P=phosphorus; SBM=soybean meal.
1 Maize: 100% maize; SBM: 100% soybean meal; maize–SBM: 75% maize and 25% soybean meal.
PSD and average feed particle size
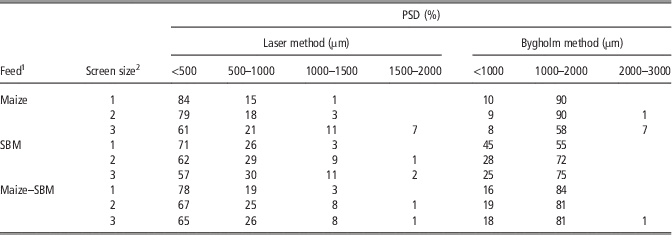
The Laser method showed that the major part of all samples consisted of particles smaller than 1000 µm (83% to 99%), whereas 1% to 18% was in the range of 1000 to 2000 µm (Table 2). However, the Bygholm method gave contradictory PSD results, with 55% to 90% of the particles ranging from 1000 to 2000 µm and 8% to 45% being smaller than 1000 µm (Table 2).
PSD of feeds ground by different screen sizes (1, 2 and 3 mm) and measured by the Laser method and Bygholm method (%)
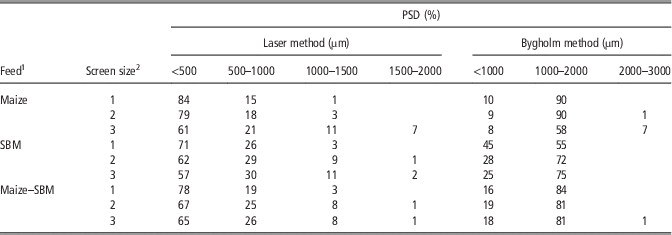
PSD=particle size distribution; SBM=soybean meal.
Results are mean value of a duplicate (Laser method) and mean value of a triplicate (Bygholm method).
1 Maize: 100% maize; SBM: 100% soybean meal; maize–SBM: 75% maize and 25% soybean meal.
2 1, 2, 3: samples were ground by screen sizes 1, 2 and 3 mm, respectively.
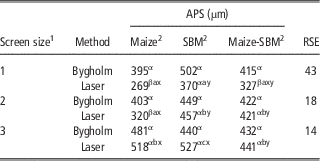
The APS results obtained by the Bygholm and Laser method were different in maize (P=0.01) and maize–SBM (P=0.02) ground by the 1 mm screen and maize ground by the 2 mm screen (P<0.001) (Table 3). An interaction between screen size and feed on APS results from the Laser method was detected (P<0.001). This was a result of the APS of the 1-mm-ground samples that was lower than the corresponding 3-mm-ground maize (P<0.001), SBM (P<0.001) and maize–SBM (P=0.002; Table 3). However, using the 2 mm screen gave similar APS results as the 1 mm screen in maize (P=0.167), but higher results in SBM (P=0.005) and maize–SBM (P=0.003).
Effect of method (Laser v. Bygholm), screen size (1, 2 and 3 mm) and feeds on APS (µm) of feeds measured by the Laser method and Bygholm method
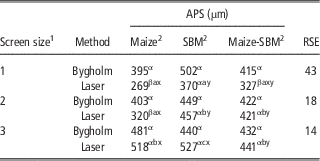
APS=average particle size; RSE=residual standard error; SBM=soybean meal.
Results are the mean value of a duplicate (Laser method) and of a triplicate (Bygholm method).
1 1, 2, 3: samples were ground by screen sizes 1, 2 and 3 mm, respectively.
2 Maize: 100% maize; SBM: 100% soybean meal; maize–SBM: 75% maize and 25% soybean meal.
α,βValues within a column with different superscripts differ significantly at P<0.05 between the Laser v. Bygholm method within each screen size.
x,yValues within a row with different superscripts differ significantly at P<0.05 for feed within each screen size and method.
a,bValues within a column with different superscripts differ significantly at P<0.05 for screen size within each feed and method.
P<0.001 for the interaction effect between feed and screen size on APS results from the Laser method.
Phytate degradation
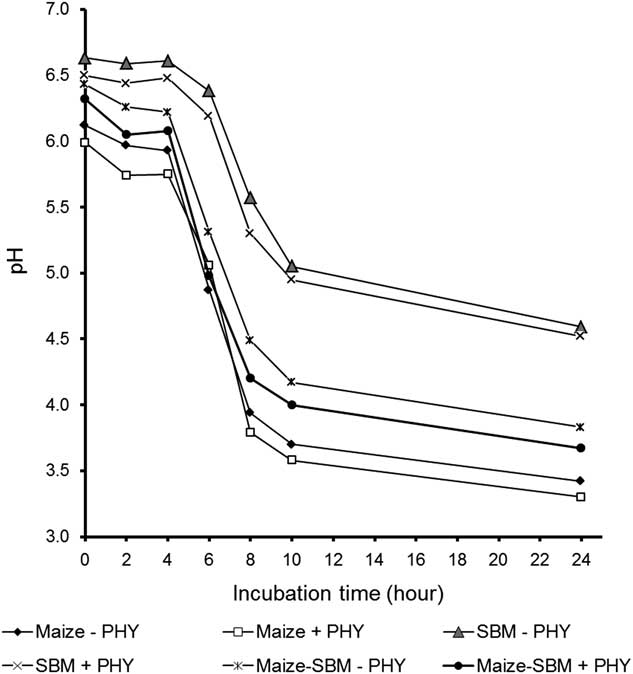
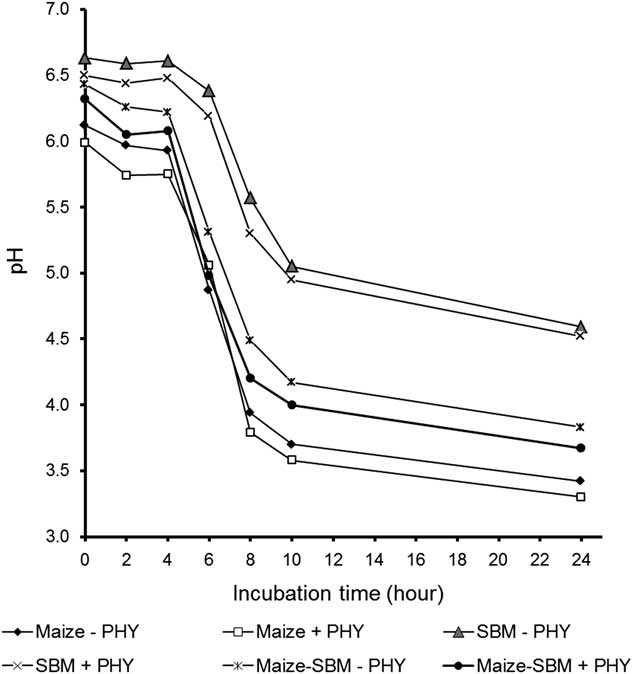
Figure 1 shows the pH development that was stable during the first 4 h of incubation, dropped from 4 to 10 h, and thereafter almost reached a steady state. The phytase activity remained constant at about 1180 FTU/kg DM during the 24 h of incubation in the microbial phytase-supplemented feeds (data not shown).
Changes in pH of maize (100% maize), SBM (100% SBM) and maize–SBM (75% maize and 25% SBM) during 24 h of incubation at 38°C without (−PHY, 0 FTU/kg as-fed) or with microbial phytase supplementation (+PHY, 1000 FTU/kg as-fed). The value is the mean value of pH of each feed regardless of screen size differences (n=9) at 0, 2, 4, 6, 8, 10 and 24 h of incubation. SBM=soybean meal; −PHY=without microbial phytase addition; +PHY=with microbial phytase addition.
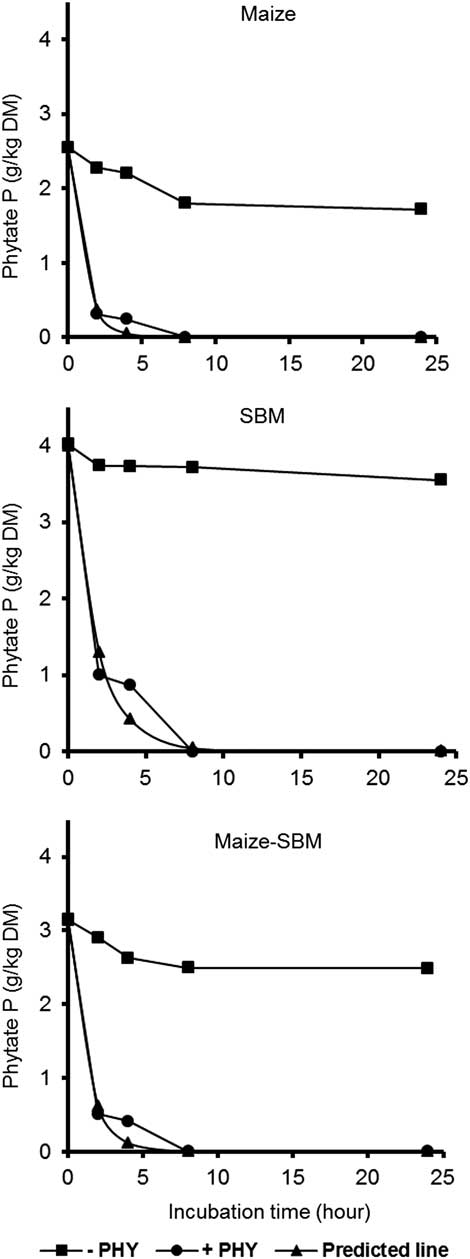
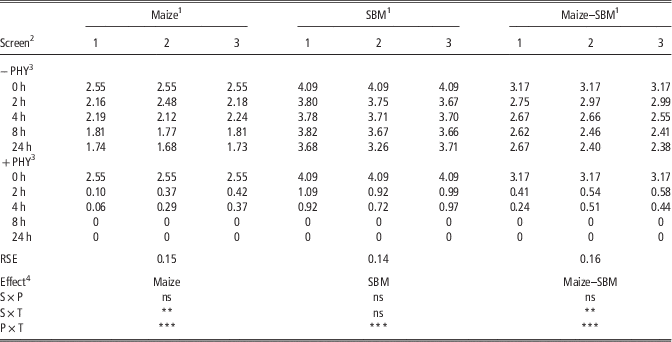
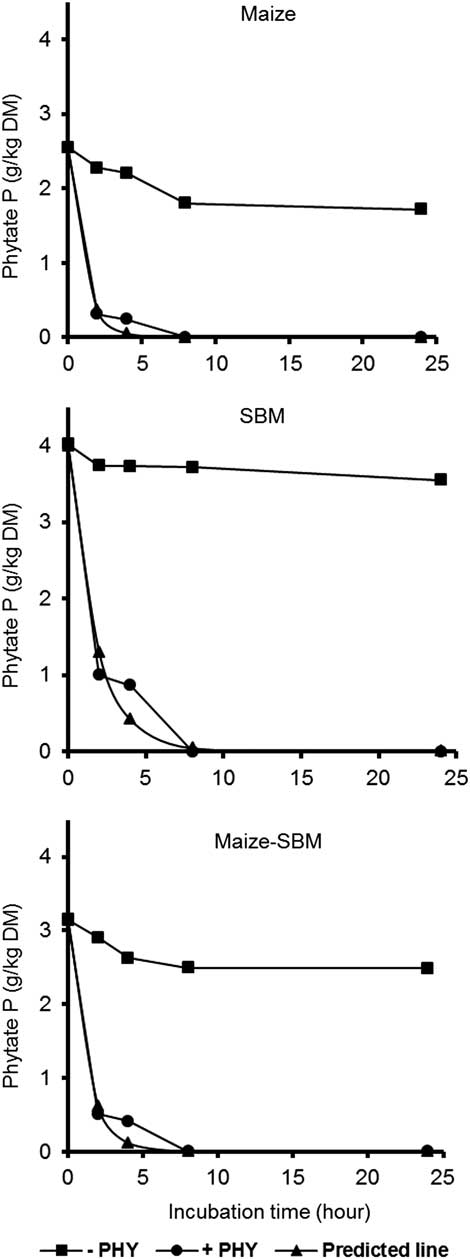
An interaction between microbial phytase and incubation time on phytate degradation was observed in all feeds (P<0.001) (Table 4). This was because the degradation of phytate at 24 h was limited to 33% in maize, 12% in SBM and 21% in maize–SBM without microbial phytase addition, whereas phytate was degraded by 88% in maize, 75% in SBM and 84% in maize–SBM after 2 h with microbial phytase (Figure 2). Nevertheless, there was no interaction between screen size and microbial phytase on phytate degradation in any of the feeds. The screen size and incubation time interaction occurred in maize (P=0.004) and maize–SBM (P=0.002) (Table 4). As a result, decreasing screen size increased the degradation of phytate at 2 and 4 h of incubation in maize and maize–SBM with microbial phytase addition (P<0.05) but did not show any effect at the other time points.
Effect of microbial phytase supplementation on phytate degradation (phytate P g/kg DM) and the predicted line of phytate degradation of maize (100% maize, Y=2.55×exp(−0.97×t), R 2=0.983), SBM (100% SBM, Y=3.98×exp(−0.56×t), R 2=0.967) and maize–SBM (75% maize and 25% SBM, Y=3.14×exp(−0.82×t), R 2=0.983) with microbial phytase supplementation during 24 h of incubation. The value is the mean of undegraded phytate (phytate P, g/kg DM) of each feed regardless of screen size (n=9); t is the incubation time; R 2 the coefficient of determination of exponential equation. −PHY=without microbial phytase addition (0 FTU/kg as-fed), +PHY=with microbial phytase addition (1000 FTU/kg as-fed). P=phosphorus; DM=dry matter; SBM=soybean meal.
The degradation of phytate P (g/kg DM) in maize, SBM and maize–SBM with and without microbial phytase supplementation after 0, 2, 4, 8 and 24 h of incubation at 38°C (n=3; mean)
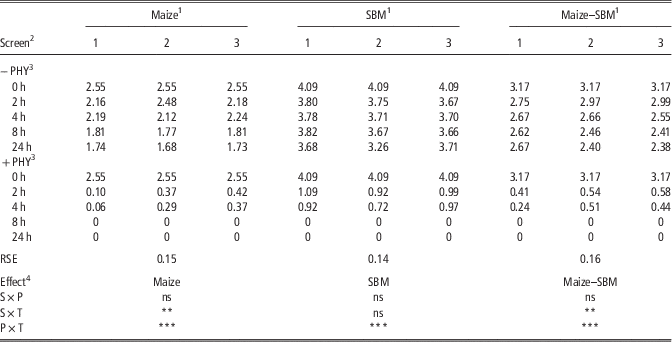
P=phosphorus; DM=dry matter; SBM=soybean meal; RSE=residual standard error.
1 Maize: 100% maize; SBM: 100% soybean meal; maize–SBM: 75% maize and 25% soybean meal.
2 Samples were ground by screen sizes 1, 2 and 3 mm, respectively.
3 The microbial phytase supplementation level is 0 or 1000 FTU/kg as-fed, respectively.
4 S is the screen size effect, P is the microbial phytase addition effect, T is the incubation time effect, S×P is the interaction between screen size and microbial phytase, S×T is the interaction between screen size and incubation time, P×T is the interaction between phytase and incubation time.
ns=P≥0.05, **P<0.01, ***P<0.001.
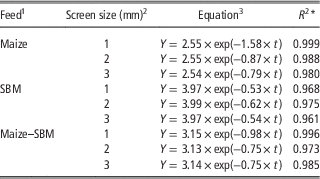
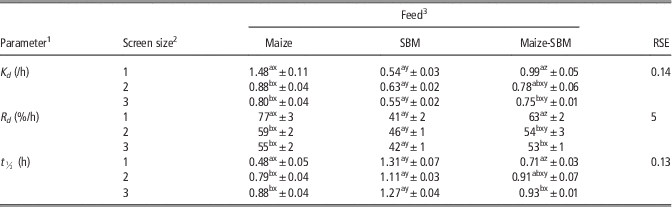
The exponential relationship between phytate degradation and incubation time was observed in all feeds (regardless of screen size; Figure 2) and experimental groups with microbial phytase supplementation (Table 5). The exponential equation gave better fit for each screen size, especially 1 mm screen, than for pooled values (regardless of screen size) in maize and maize–SBM (Table 5). The interaction between feed and screen size influenced K
d
, R
d
and t
 $\scale70%{\vskip3pt{{\scale60%{\vskip-7pt1}{\hskip-3pt\vskip-5.6pt\rot160/}{\scale60%{\hskip-4pt\vskip0pt2}$
(P<0.001), and maize had higher K
d
and R
d
and shorter t
 $\scale70%{\vskip3pt{{\scale60%{\vskip-7pt1}{\hskip-3pt\vskip-5.6pt\rot160/}{\scale60%{\hskip-4pt\vskip0pt2}$
than SBM (P<0.05). Moreover, decreasing screen size from 3 to 1 mm increased K
d
and R
d
and decreased t
 $\scale70%{\vskip3pt{{\scale60%{\vskip-7pt1}{\hskip-3pt\vskip-5.6pt\rot160/}{\scale60%{\hskip-4pt\vskip0pt2}$
in maize and maize–SBM (P<0.05), whereas K
d
, R
d
and t
 $\scale70%{\vskip3pt{{\scale60%{\vskip-7pt1}{\hskip-3pt\vskip-5.6pt\rot160/}{\scale60%{\hskip-4pt\vskip0pt2}$
in SBM were not affected by screen size (Table 6).
The fitted exponential equation describing phytate degradation of maize, SBM and maize–SBM ground by different screen sizes with microbial phytase supplementation (1000 FTU/kg as-fed) during 24 h of incubation at 38°C (n=3)
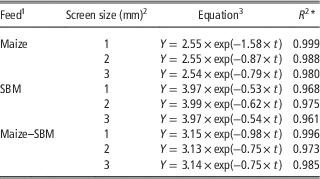
SBM=soybean meal; P=phosphorus; DM=dry matter.
1 Maize: 100% maize; SBM: 100% soybean meal; maize–SBM: 75% maize and 25% soybean meal.
2 1, 2, 3: samples were ground by screen sizes 1, 2 and 3 mm, respectively.
3 Y is the amount of non-degraded phytate (phytate P g/kg DM) after t hour of incubation; t is the incubation time (h).
*R 2 is the coefficient of determination of exponential equation.
Effect of screen size and feed on phytate degradation rate constant (K
d
), relative phytate degradation rate (R
d
) and half-life (t
 $\scale70%{\vskip3pt{{\scale60%{\vskip-7pt1}{\hskip-3pt\vskip-5.6pt\rot160/}{\scale60%{\hskip-4pt\vskip0pt2}$
) of maize, SBM and maize–SBM with microbial phytase supplementation (n=3; mean)

SBM=soybean meal; RSE=residual standard error; P=phosphorus.
1
t
 $\scale70%{\vskip3pt{{\scale60%{\vskip-7pt1}{\hskip-3pt\vskip-5.6pt\rot160/}{\scale60%{\hskip-4pt\vskip0pt2}$
: the time required to degrade 50% of the initial phytate P amount (h).
2 1, 2, 3: samples were ground by screen sizes 1, 2 and 3 mm, respectively.
3 Maize: 100% maize; SBM: 100% soybean meal; maize–SBM: 75% maize and 25% soybean meal.
x,y,zValues within a row with different superscripts differ significantly between feeds for each parameter.
a,bValues within a column with different superscripts differ significantly between screen size for each parameter.
P<0.001 for the interaction effect between screen size and feed at all parameters (K
d
, R
d
and t
 $\scale70%{\vskip3pt{{\scale60%{\vskip-7pt1}{\hskip-3pt\vskip-5.6pt\rot160/}{\scale60%{\hskip-4pt\vskip0pt2}$
).
Discussion
PSD and APS
The Laser Diffraction Analyser is a rapid and accurate equipment to be used in laboratories. The contradiction in PSD results obtained by the Laser and Bygholm method questioned the accuracy of the Bygholm method. This inaccuracy may be because of the Bygholm method that was not completely standardized (shaking speed, time and force). Even so, the APS given by the Bygholm method, which was calculated by equation (1) (Benz et al., Reference Benz, Tokach, Groesbeck, Dritz, Nelssen and DeRouchey2005), was similar to the Laser method in most of the samples except for 1 mm screen maize and maize–SBM and 2 mm screen maize. Indeed, the use of both the methods has not been studied much compared with the standard sieving method. According to Nathier-Dufour et al. (Reference Nathier-Dufour, Bougeard, Devaux, Bertrand and Le Deschault de Monredon1993), the Laser method is more precise when measuring feed samples with fine particles, small range of particle size and homogenous shape compared with the standard sieving method. In addition, compared with both the Bygholm method and the standard sieving method, the Laser method required less amounts of sample, and offered results on both PSD and APS more rapidly. In contrast, the Bygholm method can only provide PSD results with very broad range (1000 µm difference between each range). Therefore, it is impossible to describe in more detail the sample particles that are smaller than 1000 µm. Moreover, the Bygholm method cannot provide the APS of samples directly. The equation that was used to calculate the APS of samples in the current study was based on maize samples, and therefore the equation may not be applicable to other feedstuffs. Therefore, more research seems to be needed to develop the accuracy of the Bygholm method when used to determine the PSD and APS under practical conditions such as farm uses.
The present study confirmed the effect of screen size on feed particle size reduction as the APS of the samples ground by the 1 mm screen was smaller in all feeds compared with the 3 mm screen. Moreover, the degree of APS reduction was more remarkable in maize (48%) than in SBM (30%) and maize–SBM (26%) in the current study. According to Murphy et al. (Reference Mavromichalis, Hancock, Senne, Gugle, Kennedy, Hines and Wyatt2009), replacing a 3 mm screen with a 2 mm screen reduced the APS by 14% in wheat, 8% in sorghum and 5% in barley. On the basis of the results given by Walker (Reference Walker1999) and Goodband et al. (Reference Engelen, Vanderheeft, Randsdorp and Smit2002), feed characteristics such as kernel size and shape are the main factors affecting the particle size at grinding. According to Walker (Reference Walker1999), the whole kernel of maize must be broken into smaller fragments before passing through the openings of screen, whereas milo and wheat can pass through easily. In the current study, the SBM material analysed passed easily through the open areas of the screen because it was already coarsely ground.
Phytate P degradation
No interaction between screen size and microbial phytase was detected in all feeds in the current study, which was consistent with previous studies of Amerah and Ravindran (Reference Amerah and Ravindran2009), Kasim and Edwards (Reference Haug and Lantzsch2000) and Oryschak et al. (Reference Oryschak, Simmins and Zijlstra2002). The degradation of phytate in non-microbial phytase-supplemented feeds was very limited because of the very low-plant phytase activities in both maize (46 FTU/kg DM) and SBM (40 FTU/kg DM). Therefore, although grinding may disrupt and improve the access to the phytate molecule trapped inside the seeds, the phytate degradation could not be improved further without microbial phytase activity. Consequently, screen size had no effect on phytate degradation in the feeds incubated without microbial phytase. However, the interaction between microbial phytase and incubation time positively affected the phytate degradation in all feeds that was shown as decreased amounts of residual phytate P at 2, 4, 8 or 24 h when microbial phytase was added compared with non-microbial phytase supplementation. Similar results were reported by Blaabjerg et al. (Reference Blaabjerg, Carlsson, Hansen-Møller and Poulsen2010a).
Remarkably, the observed interaction between screen size and feed influenced the microbial phytase efficacy on phytate degradation, which was expressed as K
d
, R
d
and t
 $\scale70%{\vskip3pt{{\scale60%{\vskip-7pt1}{\hskip-3pt\vskip-5.6pt\rot160/}{\scale60%{\hskip-4pt\vskip0pt2}$
in the current study. This means that a change in screen size will affect K
d
, R
d
and t
 $\scale70%{\vskip3pt{{\scale60%{\vskip-7pt1}{\hskip-3pt\vskip-5.6pt\rot160/}{\scale60%{\hskip-4pt\vskip0pt2}$
differently depending on the type of feed. For example, in maize, using a 1 mm screen led to a higher K
d
, a higher relative phytate degradation rate of microbial phytase, and a shorter time required to degrade 50% of phytate compared with the 3 mm screen. The same trend was seen in maize–SBM, which was composed of 75% maize, but not in SBM. An explanation may be that the effect of screen size on reductions in particle size was more pronounced in maize than in SBM, facilitating an increased accessibility for microbial phytase to phytate in maize compared with SBM. Furthermore, the high level of added microbial phytase may allow a greater degradation of phytate in SBM regardless of particle size. Results of the current study support the statement of Silva et al. (Reference Silva, Couturier, Berrin, Buléon and Rouau2012), Sangseethong et al. (Reference Sangseethong, Meunier-Goddik, Tantasucharit, Liaw and Penner1998) and Mansfield et al. (Reference Lyberg, Lundh, Pedersen and Lindberg1999) that particle size reduction enhanced the contact between enzyme and substrate (speeding up the initial rates) and exposed the inaccessible zones in coarse particles (increasing the final hydrolysis yields). The surface area of maize increased by four times when the APS decreased from 2010 to 525 µm (Summers, Reference Summers2001). Vidal et al. (Reference Vidal, Dien, Ting and Singh2011) also report that physical particle size reduction led to structural modification at macromolecular level such as lignocellulose physical structure and boosted cellulose hydrolysis rate by up to 50%. Moreover, feed efficiency, apparent DM digestibility and apparent N digestibility were improved when wheat APS decreased from 1300 to 600 µm in a nursery pig diet with supplemented xylanase (Mavromichalis et al., Reference Mansfield, Mooney and Saddler2000).
However, it should be emphasized that K d of the exponential function was proportional to the initial phytate P content in feeds, and R d relates to the undegraded phytate content (phytate P, g/kg DM) in the sample after each hour of incubation. The initial phytate P content of SBM (4.09 g/kg DM) was higher than in maize (2.55 g/kg DM), and therefore even though maize had higher K d and R d , the amount of phytate degraded per hour was lower in maize than in SBM. This is similar to previous results of Adeola et al. (Reference Adeola, Sands, Simmins and Schulze2004) who report that with microbial phytase supplementation, the highest amount of inorganic P release was achieved in SBM followed by the combination of maize-SBM and the lowest in maize.
According to Blaabjerg et al. (Reference Blaabjerg, Strathe and Poulsen2012), the Generalized Michaelis Menten function was superior in describing the in vitro phytate degradation profile of soaked wheat or barley. The cited authors report a much longer time to degrade 50% of phytate in heat-treated wheat (12.4 h) and barley (11.9 h) than in the current study. This is most likely because Blaabjerg et al. (Reference Blaabjerg, Strathe and Poulsen2012) used an incubation temperature of 20°C, which was lower than the temperature in current study (38°C). Carlson and Poulsen (Reference Carlson and Poulsen2003) showed that increasing the incubation temperature from 20°C to 38°C enhanced the phytate degradation rate. Moreover, another explanation may be because of the differences in the storage sites of phytate and/or the possibility for microbial phytase access to phytate in different seeds (Adeola et al., Reference Adeola, Sands, Simmins and Schulze2004; Blaabjerg et al., Reference Blaabjerg, Carlsson, Hansen-Møller and Poulsen2010a).
Conclusion
In conclusion, the use of a 1 mm screen size reduced the APS of maize by 48%, SBM by 30% and maize–SBM by 26% compared with the 3 mm screen size. The PSD results differed between the Laser method and the Bygholm method, whereas the APS results for most of the samples were similar. No interaction between screen size and microbial phytase was detected. An interaction was, however, observed between microbial phytase and incubation time on phytate degradation. With microbial phytase, the degradation of phytate in all feeds during incubation for 24 h at 38°C followed the decay exponential model. An interaction between screen size and feed was detected on the efficiency of microbial phytase, which was expressed as K
d
, R
d
and t
 $\scale70%{\vskip3pt{{\scale60%{\vskip-7pt1}{\hskip-3pt\vskip-5.6pt\rot160/}{\scale60%{\hskip-4pt\vskip0pt2}$
, because of the more pronounced effect of screen size reduction in maize and maize–SBM than in SBM. In maize, decreasing screen size from 3 to 1 mm doubled K
d
, increased R
d
by 22%/h and halved the time needed to reduce the phytate content by 50%. The same trend was observed in maize–SBM, but not in SBM. In general, grinding of maize was more efficient in improving microbial phytase efficacy on phytate degradation in comparison with SBM during incubation.
Acknowledgements
The study was granted by the research programmes offered by The Danish Food Industry Agency and financed by The Ministry of Food, Agriculture and Fisheries. Special thanks goes to Associate Professor Dr Walter Gerrits, Animal Nutrition Group, Department of Animal Sciences of Wageningen University, the Netherlands, for his supervision and statistical guidance throughout the study.