Implications
Methane enteric production by ruminant livestock is one of the major sources of greenhouse gas emissions. Methane produced from formate is one of the important methanogensis pathways in the rumen. This study quantitatively characterizes methanogenesis from formate under a ruminal environment by using a stable isotopic tracer method and describes feed fermentation profiles and ruminal methanogenic populations with increasing formate addition. The identification of methanogenesis from formate provides mechanistic insight in the formation of CH4.
Introduction
Rumen flora and fauna possess a unique ability to degrade complex fiber feeds to essential nutrients for the host animal (Owens and Basalan, Reference Owens and Basalan2016). In general, microbes can ferment carbohydrates to make volatile fatty acids (VFA) including acetate, propionate, iso-butyrate, butyrate, valerate and formate. Acetate and propionate are the main acids in ruminal fluid. In contrast, formate is easily neglected in ruminal fluid for its low concentration. However, in cases when CH4 production is inhibited, formate can be larger than 10% of the VFA produced, which is also an important energy source for the host animal (Martinez-Fernandez et al., Reference Martinez-Fernandez, Denman, Cheung and McSweeney2016 and Reference Martinez-Fernandez, Denman, Yang, Cheung, Mitsumori and McSweeney2017).
Attempts to understand formate metabolism in the rumen can be traced back to the 1950s (Lewis, Reference Lewis1951; Annison, Reference Annison1954). Methane production from formate metabolism is one of the important methanogensis pathways in ruminants (Janssen and Kirs, Reference Janssen and Kirs2008). Formate can be easily utilized by methanogens to produce CH4 directly, or degraded to CO2 and H2 and then converted into CH4 by methanogens (Ellis et al., Reference Ellis, Williams and Lloyd1990; Janssen and Kirs, Reference Janssen and Kirs2008; Olijhoek et al., Reference Olijhoek, Hellwing, Brask, Weisbjerg, Højberg, Larsen, Dijkstra, Erlandsen and Lund2016). However, the quantitative information regarding formate metabolism in the rumen has been rarely studied. Using stable isotopic formate with 13C can be useful to investigate the carbon flow from formate to CH4 and CO2 (Sparling and Daniels, Reference Sparling and Daniels1986). Thus, the main objective of this study was to quantitatively examine the conversion rate (CR) of formate to CH4 and CO2 by rumen microorganisms using stable isotopic tracer method in a batch culture system. These data could provide quantitative information of formate dissimilation in the rumen. Furthermore, the effects of adding formate on in vitro gas production, fermentation parameters and microbial populations were also evaluated.
Material and methods
Substrate, ruminal microbial inocula and batch cultures
Local lucerne hay (Changsha; China) was used in the in vitro incubation. The lucerne hay, cut at early-bud stages of maturity, was oven-dried at 65°C for 48 h and milled through a 0.38 mm screen before incubation. The lucerne hay contained 165 g CP, 66 ether extract, 433 NDF and 290 ADF (per kilogram on a DM basis). The lucerne hay was analyzed for DM using the procedures of the Association of Official Analytical Chemists (1995, method 930.15), CP (6.25×nitrogen, method 990.03) and ether extract (method 920.39). The NDF and ADF were determined using a Fibretherm Fibre Analyzer (Gerhardt, Bonn, Germany) with an addition of sodium sulfite and heat stable α-amylase (Van Soest et al., Reference Van Soest, Robertson and Lewis1991), and expressed as inclusive of residual ash.
Four ruminally fistulated Liuyang black male goats (19.8±3.0 kg) fed a mixed ration (containing 650 g maize stover and 350 g concentrates per kilogram; DM basis) were used for rumen inocula collection. The concentrate contained 750 g corn, 140 g soybean meal, 1.5 g wheat bran, 13 g urea, 1.25 g calcium carbonate, 31.25 g monocalcium phosphate, 13 g salt and 50 g mineral–vitamin premix (per kilogram on a DM basis), and the mixed ration supplied 6.21 MJ metabolizable energy (ME), 525 g NDF, 315 g ADF and 100 g CP per kilogram (DM basis). The goats consumed ~0.6 kg feed per day (DM basis; providing 3.73 MJ and 60 g CP) to meet the maintenance of ME and CP requirements of goats according to the feeding standards for Chinese goats (Zhang and Zhang, Reference Zhang and Zhang1998). The goats were housed individually in crates (1.2×0.91 m) located within an animal facility with average temperature of 24±1°C and natural lighting. Ruminal contents from each goat were obtained from various locations within the rumen immediately before the morning feeding (0800 h). The ruminal contents were then filtered through a four-layer cheesecloth and mixed in a pre-warmed insulated airtight container. Then ruminal fluids were carried to the laboratory immediately for further in vitro incubations.
Approximately 0.4 g of lucerne hay (DM basis) was weighed into a 150-ml glass bottle (Wanhong Glass Instrument Factory, Haimen, Jiangshu, China). The ruminal fluid was mixed (1 : 9) with buffer solutions consisting of 292 mg K2HPO4, 240 mg KH2PO4, 480 mg (NH4)2SO4, 480 mg NaCl, 100 mg MgSO4·7H2O, 64 mg CaCl2·2H2O, 4 mg Na2CO3 and 600 mg cysteine hydrochloride per liter (Zmora et al., Reference Zmora, Cieslak, Jedrejek, Stochmal, Pers-Kamczyc, Oleszek, Nowak, Szczechowiak, Lechniak and Szumacher-Strabel2012), and placed in an anaerobic environment filled with N2. Buffered ruminal fluid (40 ml) was then added to each bottle under N2 flushing. When dispensing buffered ruminal fluid, a different volume of H13COOH (Sigma-Aldrich Shanghai Trading Co Ltd., Shanghai, China) was also added into a bottle to achieve a dose of 0, 1.5, 2.2 or 2.9 mg/g of DM substrate (i.e. 0, 0.33, 0.48 or 0.63 mM H13COOH). The formate doses added were within the range as recommended for feed additives (He et al., Reference He, Ding, Xu, Beauchemin and Yang2013). Each bottle was then capped with a rubber stopper and placed in an incubator at 39°C for 6, 12, 24 or 48 h. Bottles containing buffered ruminal fluid alone without substrate and formate treatment were also incubated to correct for gas production and fermentation residues. Each treatment included three bottles for each incubation time point. The incubation was also run three times on different days, so that each treatment was conducted in triplicate.
Samples collection
After incubation for 6, 12, 24 and 48 h, headspace gas pressures were measured by a pressure transducer (CYG130-12; KunshanShuangqiao Sensor Measurement Controlling Co., Ltd., Kunshan, Jiangsu, China). Triplicates of gas samples (5 ml each) collected in graduated syringes were transferred to 10 ml pre-evacuated vials to measure gas composition, 13C isotopic abundance in total CO2 and 13C isotopic abundance in total CH4. Two subsamples (5 ml) of filtered fluid from each bottle were preserved with 1 ml of 25% (wt/vol) HPO3 and 1 ml of 1% (vol/vol) H2SO4 for VFA and ammonia nitrogen (NH3-N) measurement, respectively. The samples were stored at −20°C until analyzed. Another 5 ml of fermented fluid sample were frozen in liquid N2 and stored at –80°C for measuring populations of microbial markers. The microbial markers included protozoa, total methanogens, Methanosphaera stadtmanae, Methanobrevibacter ruminantium M1, Methanobrevibacter smithii and Methanosarcina barkeri.
Gas calculation and analyses
The pressure readings, corrected for inoculum controls (i.e. without substrate and formate treatment), were transformed to gas production (ml) as described by Wang et al. (Reference Wang, Sun, Janssen, Tang and Tan2014). Gas composition of the collected gas samples were determined using a gas chromatograph (Agilent 7890A; Agilent Technologies, Palo Alto, CA, USA) with a packed column in nickel tubing (2.4 m×0.2 mm i.d., 80 to 100 mesh; Agilent Technologies) as described by He et al. (Reference He, Yang, Yang, Beauchemin, Tang, Huang, Zhou, Han, Wang and Kang2015). Gas was flushed through a sampling loop of the gas chromatograph, which was fitted with a Flame IonisationDetector (column temperature=60°C, injector and detector temperature=280°C). The carrier gas (N2) flow rate was 21 ml/min. Volumes of CH4 and CO2 were calculated according to the equation proposed by Wang et al. (Reference Wang, Janssen, Sun, Muetzel, Tavendale, Tan and Pacheco2013).
The values of 13C isotopic abundance (expressed as mol13C/[mol13C+mol 12C]) in total CO2 were determined by a continuous flow technique with a FinniganTM MAT-253 stable isotope ratio mass spectrometry (IRMS; Thermo Scientific, Ringoes, NJ, USA). The gas was directly transferred to a gas chromatography with a Pora plot column (25 m×0.32 mm i.d) at 25°C under 2×10⁵ Pa to separate CO2. The separated CO2 was then injected into an IRMS for 13C isotopic abundance determination.
The values of 13C isotopic abundance in total CH4 were also determined by a FinniganTM MAT-253 IRMS instrument but with an automated interface for pre-gas chromatography concentration (PreCon; ThermoFinnigan, Ringoes, NJ, USA). The pre-gas chromatography concentration including a chemical trap filled with Mg (ClO4)2 and NaOH was primarily used to remove the CO2 from the total gas. Then the concentrated gas (i.e. CH4) was converted into CO2 in a combustion furnace at 1000°C and transferred to a gas chromatography for CO2 separation. Lastly, the 13C isotopic abundance in the separated CO2 was determined by an IRMS.
The 13CH4 and 13CO2 production were calculated through their respective 13C isotopic abundance and total production (13CH4 production, ml=13C isotopic abundance in CH4×total CH4 volume, ml; 13CO2 production, ml=13C isotopic abundance in CO2×total CO2 volume, ml). Conversion rates of 13CH4 and 13CO2 from H13COOH were calculated though equations [13CH4 CR, %=(13CH4 production/22.4)/initial 13C, mmol×100; 13CO2 CR, %=(13CO2 production/22.4)/initial 13C, mmol×100)]. Before the calculation of 13C gas CR, the productions of 13CH4 and 13CO2 were corrected by subtracting the 13CH4 and 13CO2 production from the treatment without H13COOH addition, respectively.
Volatile fatty acids and ammonia nitrogen analyses
Samples were thawed and centrifuged at 15 000 g for 10 min, and the supernatant was analyzed for NH3-N and VFA, respectively. Concentrations of NH3-N were determined using the phenol-hypochlorite method of Weatherburn (Reference Weatherburn1967) with a spectrophotometer (UV-2300; Shimadzu, Japan). Concentrations of individual VFA were determined as described by He et al. (Reference He, Yang, Yang, Beauchemin, Tang, Huang, Zhou, Han, Wang and Kang2015) using a gas chromatograph (Agilent 7890A; Agilent Technologies) with capillary column (30 m in length with a 0.25 mm i.d.; Agilent Technologies). The gas chromatograph was performed under the following conditions: attenuation was set at a nitrogen diffluent ratio of 1 : 50, hydrogen flow 30 ml/min, airflow 365 ml/min, injector temperature 250°C and detector temperature 280°C. The oven temperature was 60°C held for 2 min, which was then increased by 20°C/min to 220°C. The N2 was used as carrier gas at a flow rate of 0.8 ml/min.
Microbial targets analysis
Total DNA of fermented fluid was extracted following the protocol of repeat bead beating plus column method (Yu and Morrison, Reference Yu and Morrison2004) and six primers were used to amplify the targeted microbial groups (Table 1). After dissolving precipitated DNA with nuclease-free water, quality and quantity of DNA samples were measured using a ND 1000 spectrophotometer (NanoDrop Technologies, Wilmington, DE, USA). Real-time PCR assays were carried out with an ABI 7900 Real Time PCR Detection System (Applied BioSytems, Foster City, CA, USA) with a volume of 10 μl containing the following reagents: 5.0 μl of Power SYBR Green PCR Master Mix (ABI), 0.3 μl (each) of PCR primers (10 μM), 1.0 μl of template DNA, and 3.4 μl of nuclease-free water. Real-time amplification commenced with a hot start of 95°C for 10 min, followed by 40 cycles at 95°C for 15 s and 60°C for 60 s. For melting curve detection, the temperature was increased from 60°C to 95°C at a rate of 0.05°C/s. The DNA amplification was performed in triplicate, and negative controls (nuclease-free water) were loaded to exclude possible contamination and dimer formation. The copy numbers of targeted microbial marker per milliliter fermented fluid were calculated through the equation:
 $$N_{s} {\equals}Q_{c} {\times}C{\times}V_{d} /\left( {S{\times}V_{s} } \right)$$
where N s is the copy number in sample; Q c the quantitative copy number from standard curve; C the DNA concentration (ng/µl); V d the dilution volume of extracted DNA (µl); S the used DNA amount (ng); V s the fermented fluid volume used for DNA extraction (ml).
Primers for real-time polymerase chain reaction assay

M. stadtmanae=Methanosphaera stadtmanae; M. ruminantium M1=Methanobrevibacter ruminantium M1; M. smithii=Methanobrevibacter smithii; M. barkeri=Methanosarcina barkeri.
Statistical analysis
Before analysis, analytical replicates with three different bottles at the same incubation time were averaged. Data of microbial population were transformed using the logarithmic transformation (log10) to achieve normal distribution. All statistical analyses were conducted using the MIXED procedures of SAS (9.2). The statistical model initially included treatment, incubation time and their interaction as fixed effects, with incubation time considered as a repeated effect. The interaction was not significant for all variables analyzed and thus excluded from the statistical model. Therefore, only the dose effect with pooled means were reported in the tables. Orthogonal polynomial contrasts were performed to investigate linear and quadratic effects of increasing formate addition. Least squares means were reported, and statistical significance was declared at P⩽0.05.
Results
Production of 13CH4 and 13CO2 from H13COOH
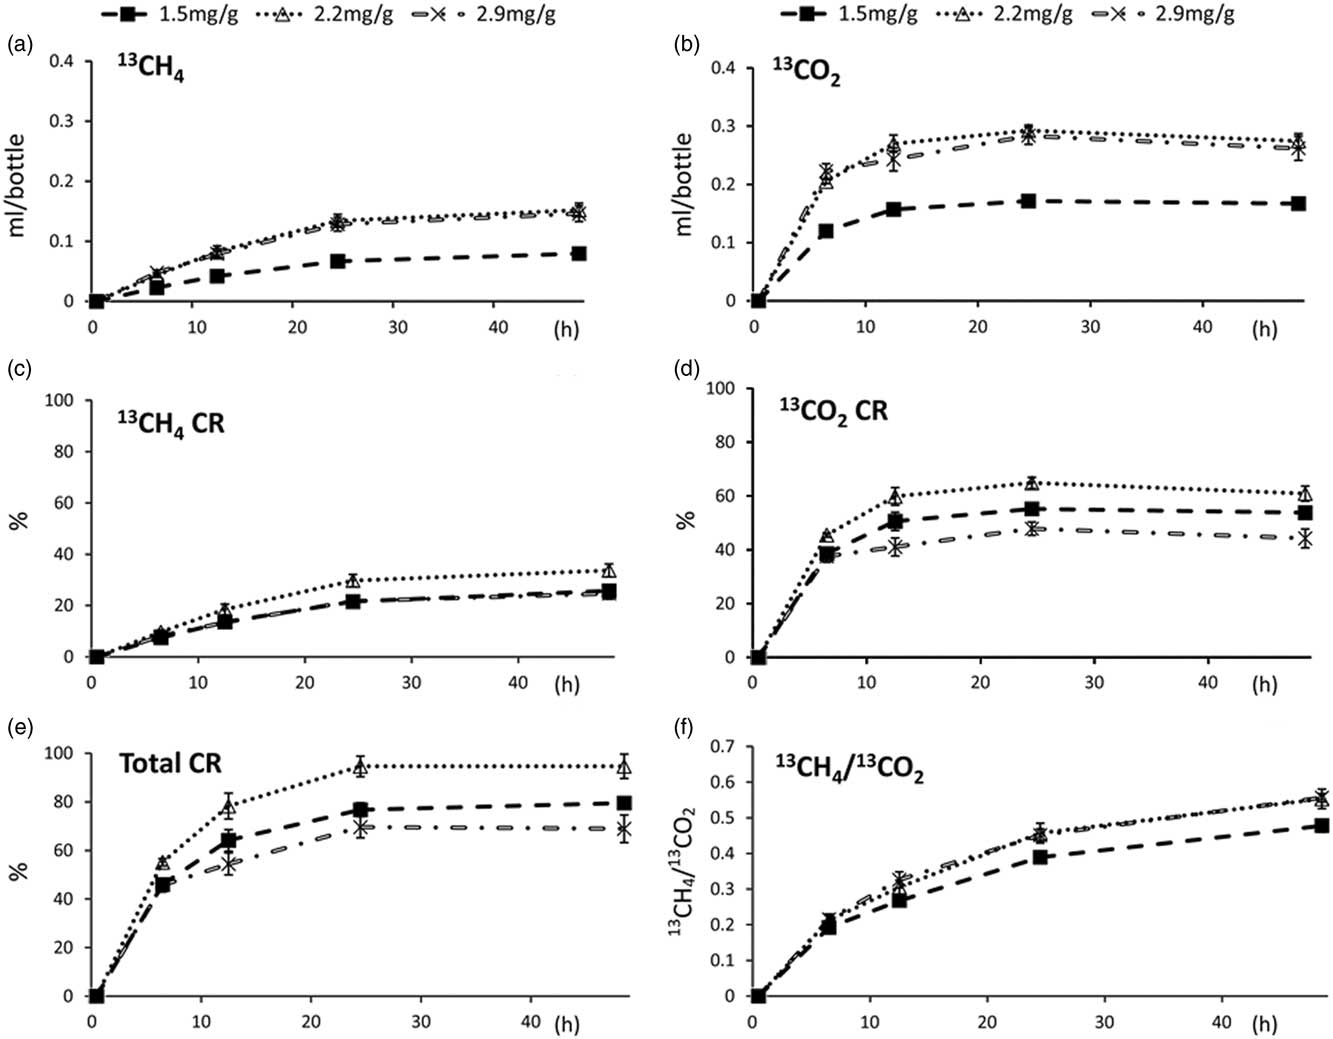
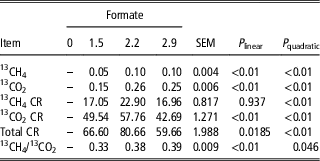
There was no interaction (P>0.05) between H13COOH dose and incubation time for the 13CH4 or the 13CO2 profiles, therefore only the dose effect with pooled means were presented. Increasing the doses of H13COOH quadratically increased absolute 13CH4 production (ml) and 13CH4 CR (%) (P<0.01), absolute 13CO2 production and 13CO2 CR (%) (P<0.01) and also total CR of 13C (including 13CH4 and 13CO2) and 13CH4/13CO2 ratio (P<0.046) (Figure 1 and Table 2).
Profiles of 13CH4 (a), 13CO2 (b), 13CH4 CR (c), 13CO2 CR (d), total 13C CR (e) and 13CH4/13CO2 (f) when adding 13C labeled formate (at 0, 1.5, 2.2 or 2.9 mg/g DM substrate). 13CH4 CR=13CH4 conversion rate (CR) from 13C labeled formate; 13CO2 CR=13CO2 conversion rate from 13C labeled formate; total 13C CR=total 13C conversion rate from 13C labeled formate. P dose<0.01, P time<0.01 for all the variables presented. Rumen inocula were collected from Liuyang black male goats.

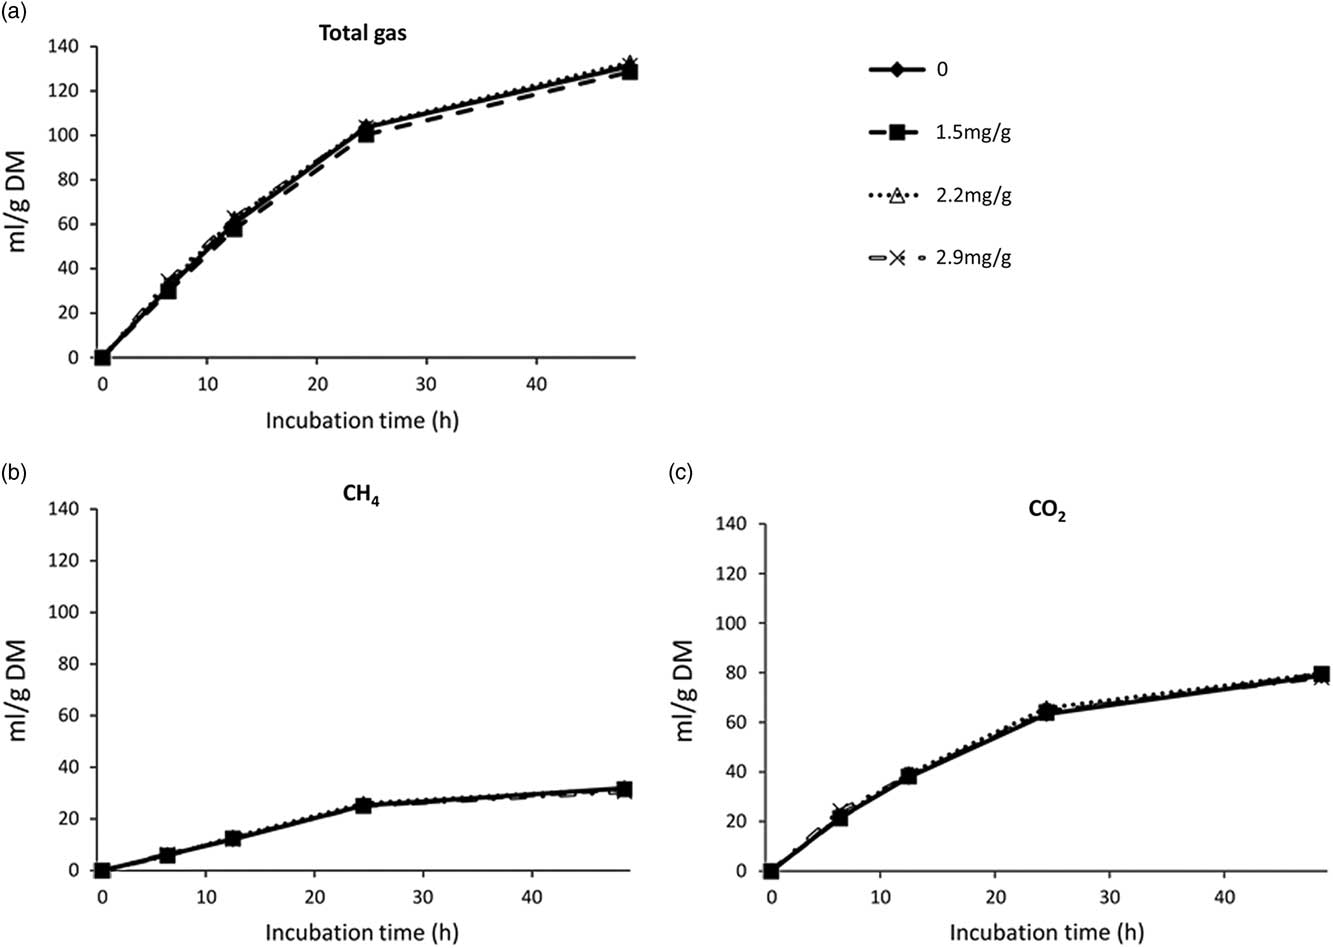
Profiles of total gas (a), CH4 (b) and CO2 (c) production affected by adding formate (at 0, 1.5, 2.2 or 2.9 mg/g DM substrate). P dose>0.05, P time<0.01 for all the variables presented. Rumen inocula were collected from Liuyang black male goats.

In vitro 13C labeled CH4 and CO2 production (ml/bottle) affected by adding 13C labeled formate (mg/g DM substrate)

13CH4 CR=13CH4 conversion rate (CR) from 13C labeled formate; 13CO2 CR=13CO2 conversion rate from 13C labeled formate; total 13C CR=total 13C conversion rate from 13C labeled formate.
Values were the pooled means from 6, 12, 24 and 48 h of incubation.
Rumen inocula were collected from Liuyang black male goats.
Effects of adding formate on gas production, fermentation parameters and targeted microbial populations
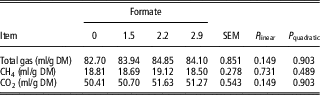
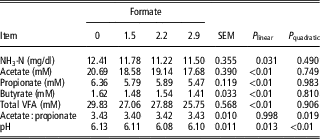
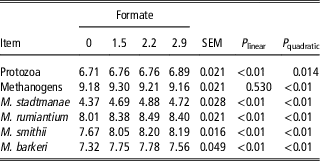
The kinetics and production of total gas, CH4 and CO2 are not changed (P>0.05) by formate (Figure 2 and Table 3). Formate addition linearly decreased (P<0.031) concentrations of NH3-N, total and individual VFA (acetate, propionate and butyrate; Table 4). However, the ratio of acetate to propionate was quadratically decreased (P=0.019) when formate was added. In response to formate addition, quadratic increases (P<0.014) were also observed for the copy numbers of protozoa, total methanogens, M. stadtmanae, M. ruminantium M1, M. smithii and M. barkeri (Table 5).
In vitro CH4 and CO2 production affected by adding formate (mg/g DM substrate)

Values were the pooled means from 6, 12, 24 and 48 h of incubation.
Rumen inocula were collected from Liuyang black male goats.
In vitro NH3-N and volatile fatty acid (VFA) concentration affected by adding formate (mg/g DM substrate)

NH3-N=ammonia nitrogen; VFA=volatile fatty acid.
Values were the pooled means from 6, 12, 24 and 48 h of incubation.
Rumen inocula were collected from Liuyang black male goats.
In vitro microbial population (expressed as log10/ml) affected by adding formate (mg/g DM substrate)

M. stadtmanae=Methanosphaera stadtmanae; M. ruminantium=Methanobrevibacter ruminantium M1; M. smithii=Methanobrevibacter smithii; M. barkeri=Methanosarcina barkeri.
Values were the pooled means from 6, 12, 24 and 48 h of incubation.
Rumen inocula were collected from Liuyang black male goats.
Discussion
Production of 13CH4 and 13CO2 from H13COOH
Isotopic tracer technique was employed to quantitatively evaluate the ruminal CH4 and CO2 production from formate. On average, approximately half (48.9%) of the stable isotopic carbon was converted from carbon-formate into carbon-CH4 and carbon-CO2 by rumen microorganisms within the first 6 h of incubation, and the CR increased up to 80% after 24 h of incubation. Those results were in agreement with the previous study, which has reported that formate was metabolized rapidly in the rumen (Carroll and Hungate, Reference Carroll and Hungate1955). The maximum total CR was ~95% at 24 h of incubation, when the formate was supplemented at 2.2 mg/g DM substrate (Figure 1). Previous studies have also reported that only a very small amount of formate can be detected in rumen contents (Gray et al., Reference Gray, Pilgrim, Rodda and Weller1952; Bento et al., Reference Bento, Azevedo, Gomes, Batista, Rufino, Detmann and Mantovani2016; Olijhoek et al., Reference Olijhoek, Hellwing, Brask, Weisbjerg, Højberg, Larsen, Dijkstra, Erlandsen and Lund2016). However, in some cases under methanogensis inhibition, formate may not be metabolized and accumulate up to about 10% of total VFA production (Martinez-Fernandez et al., Reference Martinez-Fernandez, Denman, Cheung and McSweeney2016 and Reference Martinez-Fernandez, Denman, Yang, Cheung, Mitsumori and McSweeney2017).
The two steps of formate dissimilation in the rumen have been reported by Carroll and Hungate (Reference Carroll and Hungate1955). Formate is converted to H2 and CO2 through the reaction of ‘HCOOH→CO2+H2’ at the first stage, and then CO2 is reduced to CH4 through the reaction of ‘4H2+CO2→CH4+2H2O’ at the second stage. Theoretically, bacterial dissimilation of 1 mole of formate results in the formation of 0.25 mole CH4 and 0.75 mole CO2 (1/3 of CH4/CO2 ratio) through the reaction of ‘4HCOOH→CH4+3CO2+2H2O’ if formate is completely metabolized. In the present study, the 13CH4/13CO2 ratios at 6 and 12 h of incubation were below the theoretical value of 1/3, whereas 13CH4/13CO2 ratios were above 1/3 at 24 and 48 h. It was not clear why formate was metabolized to greater CO2 production and greater CH4 production before 12 and after 24 h, respectively. Some CO2 produced from formate might be further utilized by methanogens with H2 generated from incubated substrates to produce CH4 when incubation time was extended from 12 to 24 h. In an in vivo study, Vercoe and Blaxter (Reference Vercoe and Blaxter1965) found a greater CO2 production than expected when formate was infused into the rumen of sheep. However, they have also observed a simultaneous increase in O2 consumption, which was not the case in our study because N2 flushing was introduced to exclude O2 in the bottle before in vitro incubation.
The speed of formate supplementation can influence dissimilation of formate to CO2 and CH4 because a rapid of formate infusion has been reported to inhibit ruminal growth of microorganism in sheep (Vercoe and Blaxter, Reference Vercoe and Blaxter1965). Methanogens population has been demonstrated to be an important factor for methanogenesis (Poulsen et al., Reference Poulsen, Schwab, Jensen, Engberg, Spang, Canibe, Højberg, Milinovich, Fragner and Schleper2013). In the present study, the 13C labeled gas production and methanogen populations shared similar changes in response to formate supplementation, indicating that methanogens population influenced formate dissimilation to CH4 under in vitro ruminal incubation. Furthermore, methanogens living on and within rumen ciliate protozoa are responsible for up to 37% of the rumen CH4 emissions (Hegarty, Reference Hegarty1999), and CH4 production is inhibited in the absence of protozoa (Hegarty et al., Reference Hegarty, Bird, Vanselow and Woodgate2008). Therefore, our results support that both protozoa and methanogens are vital factors to affect formate dissimilation into CH4 in the rumen, although in some cases the relationship between methanogens numbers and methane production was not straightforward (Wallace et al., Reference Wallace, Rooke, McKain, Duthie, Hyslop, Ross, Waterhouse, Watson and Roehe2015; Tapio et al., Reference Tapio, Snelling, Strozzi and Wallace2017).
Effects of adding formate on gas production, fermentation parameters and targeted microbial populations
Although 13C labeled CH4 and CO2 were increased by adding formate, the total CH4 and CO2 production were not changed where the contributions of CH4 and CO2 from added formate only ranged from 0.57% to 2.26% and from 0.49% to 2.56%, respectively. This unchanged production of CH4 and CO2 was not in agreement with the study of Kara et al. (Reference Kara, Aktuğ, Çağri, Güçlü and Baytok2015), who have observed an increased CH4 production after supplementing 0.1, 0.2, 0.3, 0.4 and 0.5 ml/l formate (equal to 6.3, 12.6, 18.9, 25.2 or 31.6 mg/g DM substrate). The different CH4 production in response to formate addition between these two studies may have resulted from different dosage applied. In our study, the highest dose of formate added into buffered ruminal fluid was a concentration of 2.9 mg/g DM substrate, which was 1.2 to 9.9 fold less than that used in the study of Kara et al. (Reference Kara, Aktuğ, Çağri, Güçlü and Baytok2015).
The decreased VFA and NH3-N concentrations with formate addition were in agreement with the results reported by Kara et al. (Reference Kara, Özkaya, Erbaş and Baytok2018), in which formate has been added at 1, 2, 4 or 8 ml/kg (equal to 1.22, 2.44, 4.88 or 9.76 mg/g DM substrate). Such decreases in VFA and NH3-N concentrations might be related to the low ruminal pH following formate supplementation as the pH lower than 6.2 decreases fiber and starch digestion rate with buffered ruminal fluid (Grant and Mertens, Reference Grant and Mertens1992). In addition, as normally formic acid cannot accumulate to this extent in the ruminal fluid (Bento et al., Reference Bento, Azevedo, Gomes, Batista, Rufino, Detmann and Mantovani2016), the reduction in VFA production might also be due to the addition of formate in relatively high doses. Moreover, reduction of VFA and NH3-N concentrations in response to adding formate can be caused by antimicrobial effect of the formate on ruminal bacteria (Kara et al., Reference Kara, Özkaya, Erbaş and Baytok2018). Yet, in the present study, the antimicrobial effect of formic acid on ruminal bacteria seemed to be insignificant, as population numbers of protozoa and some species of methanogens were not decreased. Our results suggest that other factors, such as substrate type and buffer solution, might contribute to the effect of formate supplementation on VFA and NH3-N concentrations.
Conclusions
Increasing 13C labeled formate addition quadratically increased both 13C labeled CH4 and CO2 production and total 13C (13CH4 and 13CO2) CR. Formate addition also altered fermentation parameters, protozoa and some species of methanogens, such as M. stadtmanae, M. ruminantium M1, M. smithii and M. barkeri. To our knowledge, this is the first investigation to quantitatively demonstrate that most of the formate supplied can be rapidly dissimilated into CH4 and CO2 by rumen microorganisms.
Acknowledgments
This work was jointly supported by the National key research and development program of China (Grant No. 2016YFD0500504), National Natural Science Foundation of China (Grant No. 31561143009, 31402105, 31320103917 and 31472133), Pioneer Hundred Talents Program of the Chinese Academy of Science, State Key Laboratory of Animal Nutrition (2004DA125184F1705), Youth Innovation Promotion Association CAS (2016327) and CAS President’s International Fellowship for Visiting Scientists (2017VBA0026). Helpful comments and suggestions from Dr Veerle Fievez and two anonymous reviewers are also gratefully acknowledged.
Declaration of interest
The authors declare that they have no conflict of interest.
Ethics statement
Experimental procedures involved in animal use were approved by the Animal Care Committee, Institute of Subtropical Agriculture, The Chinese Academy of Sciences, Changsha, China.
Software and data repository resources
There was no data deposited in any official repository.