INTRODUCTION
Considerable interest has developed in recent years in improving and sustaining the productivity of dryland regions in developing countries (Steiner et al. Reference Steiner, Day, Papendick, Meyer and Bertrand1988; Rao & Ryan Reference Rao and Ryan2004; Ryan et al. Reference Ryan, Vlek and Paroda2004). Because of the inherent fragility of dryland ecosystems, their capacity for agricultural production without resource degradation is a major concern. Sustainability of cropping systems implies a system that continues to meet food and fibre production needs in an economical manner, at the same time preserving the natural resources, soil and water, and biodiversity consistent with society's environmental and food security needs (Weil Reference Weil1990). The sustainability of cropping systems is most effectively evaluated by long-term experiments that simulate conditions encountered in farmers' fields (Rasmussen & Collins Reference Rasmussen and Collins1991; Johnston Reference Johnston1997; Reeves Reference Reeves1997; Rasmussen et al. Reference Rasmussen, Goulding, Brown, Grace, Janzen and Körschens1998). While the oldest and most celebrated long-term agronomic trials are at Rothamsted in the UK (Jenkinson Reference Jenkinson1991), many trials in the USA and Canada (Mitchell et al. Reference Mitchell, Westerman, Brown and Peck1991) as well as Australia (Heenan & Chan Reference Heenan and Chan1992) are also of considerable age.
Despite the antiquity of agriculture in the Middle East, few trials in the region are really long term (Steiner & Herdt Reference Steiner and Herdt1993; Ryan & Abdel Monem Reference Ryan, Abdel Monem and Lal1998). In fact, with the exception of one trial in Egypt dating from 1916, none meets the criteria of Rasmussen et al. (Reference Rasmussen, Goulding, Brown, Grace, Janzen and Körschens1998) of at least 20 years to qualify as a ‘long-term’ trial. Nevertheless, despite the paucity of such trials, crop rotations were evidently debated and practised in the Mediterranean region as far back as Roman times (Karlen et al. Reference Karlen, Varvel, Bullock and Cruse1994). Fallow has been a common practice to conserve moisture and cereals have long been alternated with food and feed legumes; therefore these rotations were common features in the trials that were conducted (Papastylianou Reference Papastylianou1993; Harris Reference Harris1995; Jones & Singh Reference Jones and Singh2000). Despite the antiquity of the practice of crop rotation, its merits are still in vogue (Anderson Reference Anderson2005).
In recognition of the need to assess the impact of cultural innovations to the Middle Eastern traditional system of dryland, cereal-based agriculture (Cooper et al. Reference Cooper, Gregory, Tully and Harris1987), several trials, anticipated as long term, were initiated, mainly in Syria at the International Center for Agricultural Research in the Dry Areas (ICARDA) (Ryan & Abdel Monem Reference Ryan, Abdel Monem and Lal1998) and Cyprus (Papastylianou Reference Papastylianou1993). The trials at ICARDA near Aleppo in northern Syria were designed to address the cropping system constraints imposed by drought (Smith & Harris Reference Smith and Harris1981) and to seek alternatives to the existing fallow or continuous cereal rotations, mainly focusing on wheat (Harris Reference Harris1995) and barley (Hordeum vulgare L.) (Jones & Singh Reference Jones and Singh1995, Reference Jones and Singh2000). Other aspects of these trials emphasized soil properties, notably organic carbon (Ryan Reference Ryan, Lal, Kimble, Follett and Stewart1998; Ryan et al. Reference Ryan, Masri, Pala and Bounejmate2002), aggregation (Masri & Ryan Reference Masri and Ryan2006) tillage systems (Pala et al. Reference Pala, Harris, Ryan, Makboul and Dozom2000; Jones Reference Jones2000), water-use efficiency (Harris Reference Harris1994) and crop quality (Ryan et al. Reference Ryan, Pala, Masri, Singh and Harris2008).
The main rotation trial, ‘Cropping Systems Productivity’, described earlier by Harris (Reference Harris1995), involved a range of possible crop rotation options as well as N fertilization regimes and stubble-grazing intensity. While the trial involved measurements of soil nutrients and nutrient uptake, the prime concern has been with the parameters of economic interest, grain and straw yield. Thus, the present paper reports on the influence of alternative cropping options, N fertilizer application rates and stubble-grazing management on yield components of durum wheat.
MATERIALS AND METHODS
The extensive rotation trial described was one of several long-term trials set up at ICARDA in the early years after its establishment in 1977 (Ryan & Abdel Monem Reference Ryan, Abdel Monem and Lal1998) at its headquarters at Tel Hadya, Aleppo, Syria. The influence of rotations on grain yield data from the first seven years of the trial was briefly described by Harris (Reference Harris1995). This trial sought to assess sustainability of alternatives to wheat–fallow or continuous wheat systems.
Trial description
Soil
The soil over the 23 ha area of the trial was generally 1–2 m deep, with some parts shallower, and mostly of clay texture. The classification was a fine clay, thermic, Calcixorollic Xerochrept. The soil profile was calcareous throughout, ranging from 200 to 250 g calcium carbonate/kg in the upper 1 m and increasing below that, with calcium carbonate nodules clearly visible at the base of the profile. Soil pH was relatively constant at 7·9–8·1, while organic matter was between 10 and 14 g/kg in the top 200 mm, decreasing with depth, varying with the rotation and within-season (Ryan et al. Reference Ryan, Masri and Singh2009a). Similarly, total N ranged from 708 to 1058 mg/kg depending on the rotation, with mineral N being relatively low and varying with the season, e.g. 4·8–32·7 mg/kg (Ryan et al. Reference Ryan, Masri, Pala and Singh2009b). Values for Olsen P were maintained above the critical sufficient value of 10 mg/kg with routine P fertilization. Levels of available potassium and micronutrients were well above critical levels (Ryan et al. Reference Ryan, Masri, Garabet, Diekmann and Habib1997) and thus were not added. Cation exchange capacity ranged from 45 to 55 cmolc/kg. Bulk density values ranged from 1·1 to 1·2 g/cm3 in the surface to 1·30 g/cm3 at 700–800 mm depth. Field capacity was around 400 g water/kg soil and available moisture was 150–170 g water/kg soil. Detailed descriptions of representative profiles at the station are provided in Ryan et al. (Reference Ryan, Masri, Garabet, Diekmann and Habib1997).
Rotations
This long-term experiment was conducted in 1983–98 (14 years' data) and involved seven cropping sequences to reflect the range of cereal-based rotations commonly practised. Thus, durum wheat (Triticum turgidum var durum) was grown in winter in rotation with a summer crop (when residual moisture was adequate) of lentil (Lens culinaris), chickpea (Cicer arietinum), pasture vetch (Vicia sativa), pasture medic (Medicago spp), watermelon (Citrullus vulgaris), summer (continuous) wheat or clean-cultivated fallow. Both rotation phases, one phase being wheat and the second an alternative crop, including fallow, were in place each year. Accordingly, there are two series of the wheat yields from the wheat phase (in common) from the same plot only in alternate years. Thus, this 2-year rotation of wheat/fallow and wheat/wheat was compared with alternative 2-year rotations of wheat/lentil, wheat/chickpea, wheat/vetch, wheat/medic and wheat/melon.
With rotations as the main plots, secondary treatments involved N applied to the cereal phase at 0, 30, 60 and 90 kg N/ha, and grazing of the stubble by sheep at three intensity levels by varying flock size (zero grazing or stubble retention, medium and heavy grazing, where all the residues were removed). Established in 1983 at the beginning of the autumn cropping season, with ancillary treatments imposed in 1985/86, the trial continued until termination in 1997/98.
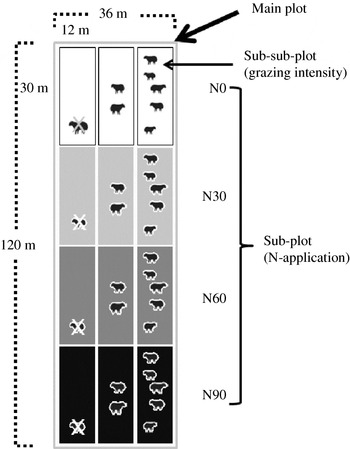
The initial design was a randomized complete block. Crop rotations and the plots of each phase were together in each of the three replications. Yields in 1984 were not included in the analysis, as the purpose was to establish the rotation that year. In 1985, N fertilization was introduced as a sub-plot in each rotation plot. In 1987, variable grazing was introduced across the N sub-plots within each crop rotation. From 1987, the experimental design was a strip-split plot with three replications, with rotations randomly allocated to the main plot (36×120 m). Within each main plot of the rotation, the four N levels were randomly allocated to sub-plots (36×30 m) and crossed with grazing sub-sub-plots (12×30 m), which were randomly allocated (Fig. 1). Thus, the four N-levels and three grazing levels appeared as a crossed two-way table within each rotation plot; hence the experimental layout is a strip-split plot design.
Sketch of layout of plots in the study.

Trial management
The trial management involved primary tillage with a tined cultivator (about 200 mm wide) and spike-toothed harrow (100–120 mm depth) for seedbed preparation in the wheat phase, followed later by seed drilling at 175 mm row spacing. No-till direct drilling was applied for the alternative crop phase (lentil, vetch, chickpea and wheat) at 300 mm row spacing. Wheat and legumes were normally planted in the second half of November and early mid-December, respectively, following the initial rains in the autumn. Watermelon was sown in mid-April on the land fallowed since wheat was harvested, when the wetting front in the soil profile reached a minimum of 750–900 mm depth, i.e. when there was sufficient residual moisture to grow the summer crop.
Medic seed was broadcast in 1983 and 1984 and later it self-generated annually. Seeding rates were 120 kg/ha for wheat, chickpea and vetch; 100 kg/ha for lentil and 1·5 kg/ha for watermelon. Improved crop cultivars were selected based on local adaptation as they become available (Durum wheat: Cham 1 and later Cham 3; lentil: Syrian Local Small, later replaced by improved Idlib), chickpea: ILC 482, released as Ghab 1 in Syria for the early sowing. Weeds and diseases were controlled by herbicides and seed treatment. Fertilizer (triplesuperphosphate) was broadcast at 26 kg P/ha in Year 1 and 39 kg P/ha in Year 2 in the wheat phase and subsequently drilled at 22 kg P/ha in order to ensure that it was not a limiting factor as indicated by Olsen P test values.
The grazing involved putting sheep on the plots during the day (07·00–17·00) and having them housed at night. The medic pasture was grazed throughout the spring/early summer season for as long as it supported 10 ewes (and lambs); vetch was also grazed to fatten weaner lambs at about 25–30 heads/ha in the spring. The wheat stubble grazing regime was arranged by fencing off the sub-plots and introducing a large flock (400–600) sheep for 1–2 days to graze it either partially (leaving about half of the stubble standing, i.e. moderate grazing) or bare (heavy grazing). The no-grazing plots had no animals on them.
Measurements
A number of climatic parameters were recorded at an adjacent weather station, including daily rainfall and its distribution, maximum and minimum temperatures, Class A pan evaporation, relative humidity, solar radiation and wind speed. Soil measurements included available water in some rotations (fallow, chickpea and medic) using the neutron probe (150–1800 mm depth in 300 mm intervals) and gravimetrically for surface layers (0–150 mm) and measurements of bulk density. Prior to autumn planting in October/November, sampling was done on bare ground from the previous season's cereal phase. Five samples (0–200 mm) were randomly taken from each sub-sub-plot, bulked, and analysed for mineral N by standard procedures (Bremner & Keeney Reference Bremner and Keeney1965).
Grain yield from wheat and chickpea plots was recorded from harvesting 0·2 of each plot with a small-plot harvester (Hege), with the harvest index (HI) calculated based on measurements of straw and grain from 20×1 m row sections in sub-plots. The remaining 0·8 of each plot was harvested with a standard combine-harvester. Lentils were hand-harvested, as is the local practice, and threshed for seed and straw yields; similarly, 0·2 of the plots was used for measurements. Vetch and medic outputs were estimated as grazing days per year and as animal offtake. Watermelon fruits were harvested from each plot and weighed. In addition to cereal grain and straw yields, the plant parts were analysed for N and the N uptake calculated.
Weather conditions
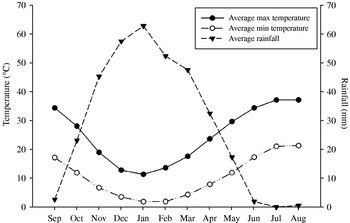
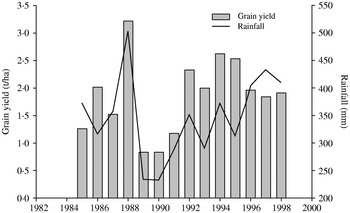
As is typical of Mediterranean climatic conditions (Cooper et al. Reference Cooper, Gregory, Tully and Harris1987; Kassam Reference Kassam1981), the two main weather components, rainfall and temperature, varied considerably throughout the 14-year cropping period, especially rainfall. The long-term seasonal average rainfall is 340 mm. Total seasonal rainfall in the first 2 years after the ancillary treatments were applied (1985/86 and 1986/87) was above this: the 1987/88 season's rainfall was the highest, recorded at 503 mm, while the next three seasons had below average rainfall, particularly 1988/89, which had 235 mm, and 1989/90, which had only 221 mm. Subsequent years, particularly 1992/93, 1994/95 and 1995/96, had above-average rainfall, with others being close to average. Erratic seasonal distribution was common, as described by Harris (Reference Harris1995), particularly in 1988/89 when no effective rainfall occurred after December. Similarly, though seasonal rainfall in 1993/94 was above average, its distribution was abnormal. The actual mean annual rainfall is depicted in relation to crop yield in Fig. 2.
Mean seasonal variation in rainfall and maximum and minimum temperatures during the trial.

Together with rainfall, air temperature dictates crop-growing conditions and modifies the influence of rainfall through evapotranspiration. On average, ambient temperature shows an inverse relationship with rainfall, with the lowest temperatures coinciding with the period of maximum rainfall in January–February (Fig. 2) and frequently high temperatures occur at grain-filling where rainfall is tapering off. The 14-year cropping period showed extremely cold spells in some years, e.g. 52 days of sub-zero temperatures in January–February 1988/89; 57 days of frost in December–February 1991/92; and 41 days of frost between 17 January and 12 April 1997. The seasonal differences in temperatures are reflected in thermal time curves for the first 7 years of the trial (see Harris Reference Harris1995).
Statistical analysis
The statistical analysis procedures for long-term rotation trials as described by Yates (Reference Yates1954) and applied by Jones & Singh (Reference Jones and Singh1995, Reference Jones and Singh2000) have been followed. The total variation in grain/straw yield was partitioned into a number of strata generated by the experimental design representing plot totals and plot×year totals. In the present rotation experiment, although wheat yield is available each year, it comes from the same plot only in alternate years. Furthermore, any build-up of cumulative effect over years on a plot will be over the cycles of rotation, as the rotation repeats.
The year factor was partitioned into series and cycles, where the two series stand for the two groups of years, where a given two-course rotation in the first year was in wheat phase (Series 1) and the alternate phase (Series 2). The two series are comprised of odd years and even years. The cycles are repetitions of the rotation, e.g. the first two years of a given two-course rotation constitute Cycle 1, the following two years are Cycle 2, and so on. The interaction of a treatment factor (e.g. rotation) with cycle represents a cumulative build-up of the effects of the treatment with time. Similarly, interactions of two or more treatment factors, e.g. rotation, N and residues, with cycle give a cumulative build-up of interactions with time.
For the strip-split plot experimental design used, after accounting for the variation due to years and replications within series, there are eight strata (sources) of experimental error used for assessing statistical significance of various main effects and interactions among the three agronomic treatment factors (rotation, N and residues) and the two component factors of year (series and cycles). The interaction part of the analysis was carried out for the 1988–98 data, where all three factors (rotation, N and grazing) were present. Separate analyses were carried out on the 1985 data for crop rotation, and on the 1986 and 1987 data for evaluating crop rotation and N.
The error variances under these strata are for testing: (1) rotations, (2) N and its interaction with rotation, (3) residue and its interaction with rotation, (4) N×residue interaction and its interaction with rotation. Another four error-variances are for interactions between the cycle (component of year) and the effects in the above (1–4) error variance groups. Further, N being a quantitative factor, its main effect and interactions were partitioned into single degrees of freedom polynomial contrasts to appear in a long analysis of variance (ANOVA) table. The partitioning of the total sum of squares was carried out to produce the ANOVA by using the Genstat statistical software (Payne Reference Payne2000). The ANOVAs, being extensive in printout form, are not included here.
Estimation of time-trends
Various interactions between agronomic factors (rotation, N and grazing) and the time components (cycles and series) were assessed for statistical significance from the ANOVA table. Significant interactions involving cycles indicated differential build-up of the effects with repetition of the rotation. In order to estimate the time-trend for a given factor-combination, the approach of Jones & Singh (Reference Jones and Singh2000) applied on barley–legumes rotations was used. Since the variability in the climatic variables, such as rainfall and its distribution, affect the yield variability, two sets of climatic variables were considered. Their effects were removed by joint modelling for the time-trend.
In the dry areas in Syria, October to May rainfall accounts for most of the rainfall contribution. Very little rainfall is observed from June to September, most of which is probably evaporated due to high temperatures. In order to incorporate rainfall distribution during the cropping season in the model, the first rainfall period was split into two: (1) October–February, for an ‘early growth stage’ and (2) March–May, for the ‘stem elongation and further stages’. Thus, the estimates of time-trends were obtained by modelling annual yield in terms of time, and linear and quadratic components of rainfall observed (a) during October–May, a single rainfall variable (model M1) and (b) during October–February and March–May, two rainfall variables (model M2). These variables represent the distribution of rainfall over the effective growth period.
The series of yields on each plot were modelled with an adjustment made for the series differences, according to the following notations:
Model M1:

Model M2:

where the abbreviations RnOctMay, RnOctFeb and RnMarMay stand for rainfall respectively for October–May, October–February and March–May; a is the constant, s, b 1, b 2 and b 3 are the coefficients of various fitted variables, and c is the time-trend measuring the increase/decrease of yield within a 2-year cycle of the rotation. Further, as a control model to assess if rainfall could have been ignored altogether in a short time-series, a third model was also fitted:
Model M3:

The errors in the models were assumed to be independent and normally distributed with zero mean and constant variance. The possibility of autocorrelated errors was actually assessed separately and, on finding extremely low estimates, the assumption of independent error from the same plot over years was made.
The suitability or degree of predictability of the model was measured as the proportion of variance accounted for  . Furthermore, for the models M1 and M2, in cases where the contribution of quadratic terms was very low and reduced the power of prediction, only the linear component of the rainfall in the model was retained. A few cases, where fitting any of the explanatory variables gave a negative value of
 , were excluded from the estimated time-trend. Variable grazing did not show any appreciable interaction with the other factors. Therefore, the above models M1–M3 were fitted on time series of mean yields over variable grazing for each combination of rotation, N and replication. The model with highest was chosen for time-trend estimation. For each such combination, the time-trend estimates were obtained. The contribution of factors in the variation of the plot-wise, time-trend estimates was assessed using weighted restricted maximum likelihood (REML), with weights being the inverse of the square of the estimated standard errors to account for any heterogeneity of the variances of the time-trend estimates. The means of time-trends and their estimated precision were tabulated for the significant main effects and interactions of the agronomic factors.
RESULTS
Statistical analyses of the effects of the various factors and independent variables in the trial showed that both the rotation and N factors had a highly significant (P⩽0·001) effect on total cereal dry matter (DM) yield and its components, grain and straw. The effect of residues or grazing management was also significant (P⩽0·05). The N×rotation interaction was highly significant (P<0·001), as was that between N and residues, especially for grain yield, but neither the residue×rotation interaction nor the interaction between the three factors were significant.
Since the N variation was partitioned into polynomial contrasts, the linear contrast of N had significant interactions with rotation and residue and the deviations from linearity were not significant. This indicates that rotation and residue differ only for the slopes (heterogeneity) of the linear response to N. The mean response to N was quadratic as the deviation from the quadratic was not significant for both grain and straw yield.
In terms of interaction with cycle (showing interaction with year), the interactions (rotation×cycle, N×cycle, residue×cycle, rotation×N×cycle, rotation×residue×cycle and N×residue×cycle) were highly significant (P<0·001) for grain and straw yields, while rotation×N×residue×cycle was significant (P<0·01) only for grain yield. This indicates that cumulative build-up varied with the factors as the rotation was repeated.
Despite variation in rainfall distribution in any given season, as well as variation in ambient temperatures, total rainfall had a dominant influence on grain yield of cereals throughout the cropping period (Fig. 3); the pattern for biomass was similar to that of grain yield. Thus, the highest yield coincided with the highest rainfall (in 1987/88) and the lowest yield coincided with the dry years of 1989/90 and 1990/91. The deviations in the last 3 years of the trial are attributed to favourable rainfall distribution. Correlations between rainfall and yield variables were 0·67 for grain, 0·63 for straw and 0·66 for biomass, thus rainfall explained 0·40–0·45 of the variation in the yield variables. While yield components, straw and grain, were generally related to total rainfall, the patterns varied as reflected by variable HI values. Though such values generally ranged between 0·35 and 0·40 the indices were less than 0·30 in the very dry years (1989–91) and even in some ‘wet’ years, e.g. 0·33 in 1996–97 (433 mm). However, the mean effect of the different rotations was relatively consistent, except for the medic rotation. Thus, mean HI was 0·35–0·37, while that of the medic rotation was 0·32, reflecting an influence of medic on soil moisture relations of the cereal crop. The overall effect of added N fertilizer was to consistently decrease the HI, i.e. from 0·37 with no N to 0·34 with 90 kg N/ha.
Relationship between average yearly rainfall and wheat grain yield.

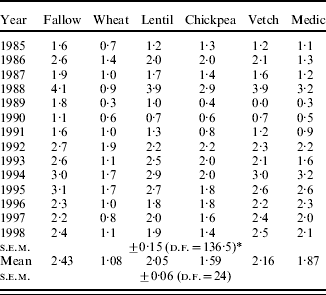
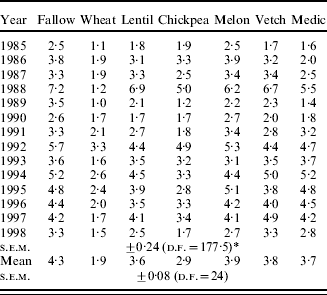
Rotations had a significant effect on biomass yield and its components. Table 1 shows the mean effects of the trial. The consistently highest cereal yield occurred when the crop was grown after fallow or a non-cropped year, with an overall mean of 2·43 t/ha; this clearly reflected the influence of residual moisture from the fallow. Though the rotation involving the summer crop, watermelon, was slightly less than the fallow, it was, in effect, similar to fallow since melon was only grown in five years in which there was sufficient moisture in the soil profile to sustain the crop; when not planted in the summer, this rotation was a fallow one. Therefore, the melon data are excluded from further consideration. The influence of the remaining rotations on cereal grain yield was in the order of vetch>lentil>medic>chickpea>continuous wheat. Continuous wheat produced yields of 0·45 of that of fallow and between 0·30 and 0·50 less grain than the other rotations.
Annual influence of the rotations on wheat grain yield (t/ha)

* s.e.m. for comparing rotations: 0·45 for 1985, 0·25 for 1986 and 0·22 for 1987.
Wheat straw is a major feed source for sheep in the Middle East farming system, and in many cases is as valuable as grain (Table 2). As expected, the straw yields followed those of grain yield. Thus, the highest straw yield came from the wheat/fallow rotation (4·28 t/ha) and the lowest from continuous wheat (1·90 t/ha). Although the fallow rotation produced yield only once in two years, it was still about 15% higher than the combined yield from two years of continuous wheat yield.
Annual influence of the rotations on wheat straw yield (t/ha)

* s.e.m. for comparing rotations: 0·77 for 1985, 0·31 for 1986 and 0·38 for 1987.
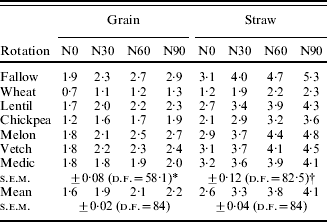
As cereal cropping in the Middle East region without N fertilizers is now rare, the key issue in any long-term rotation trial is the extent to which N fertilization influences yields of grain and straw. Notwithstanding differential responses within rotations, the overall effect of N fertilization was to increase grain and straw yields (Table 3). Compared to the control, additions of 30, 60 and 90 kg N/ha increased the yields of grain by 21, 32 and 43%, respectively, while the respective increases for straw were 27, 45 and 58%.
Mean influence of nitrogen fertilization on grain and straw yields (t/ha)

* s.e.m. for comparing at same levels of nitrogen: 0·057.
† s.e.m. for comparing at same levels of nitrogen: 0·11.
While consistent increases in grain and straw yields occurred with increasing N application rates in any rotation, the actual and relative yield increases produced with each increment of added N varied with the rotation. These relative responses from the rotations are related to the absolute yield levels of the unfertilized controls that are dictated by soil N and factors such as soil moisture, which would limit yield increases from applied N. Thus, the highest relative response was with continuous wheat, since the control had neither N input nor any indirect addition of N through N fixation. The high responses for the fallow rotation were probably due to residual soil moisture; similarly, the limited response under the medic rotation was due the higher level of N in the control from N fixation.
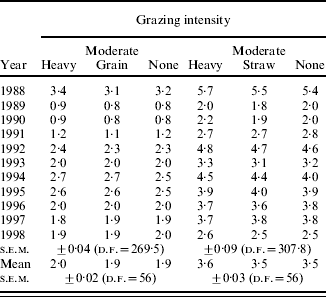
Residues showed differential effects with time on grain and straw (Table 4). Despite no significant interaction between residue management and rotation with respect to grain or straw yield, some rotations, e.g. fallow, continuous wheat and chickpea, produced highest cereal yields with the zero grazing treatment. It is probable that given the nature of this treatment and the limited amount of residues returned to the soil, a longer time period would be necessary to manifest consistent effects on the cereal crop.
Overall effects of grazing intensity on grain and straw yields (t/ha)

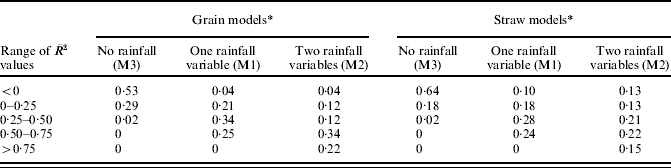
The distribution of (degree of predictability) is tabulated in Table 5 for the best models using October–May rainfall, i.e. a single explanatory variable (M1), October–February and March–May rainfalls, i.e. two variables which also represent the distribution of rainfall over the growing period (M2), and no rainfall at all (M3) in the estimation of time-trend. Ignoring rainfall leads to poor models in terms of predictability, with negative values in 0·63 of 84 cases or plots of rotation-nitrogen over the three replications for grain yield and 0·76 for straw. Single rainfall (October–May) shows considerable improvement in accounting for annual variability in the yield, where 0·30 of the 84 cases have more than 0·50 of the variance accounted for, while the models that also incorporate the distribution of rainfall show enhanced predictability. is >0·50 in 0·67 of cases and >0·75 in 0·26 of cases for grain yield. It was >0·50 in 0·44 of cases for straw yield.
Distribution of proportional variance accounted for in yields over time (84 plots from Rotation–Nitrogen–Replication combinations)

* Models:

where RnOctMay, RnOctFeb and RnMarMay stand for rainfall respectively for October–May, October–February and March–May, under a cropping season, c is the time-trend.
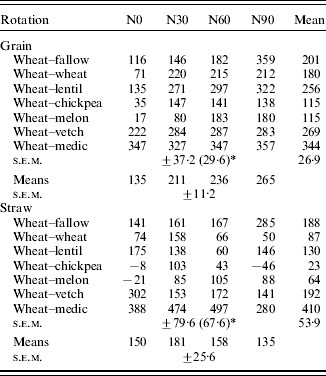
This shows the strong role of distribution of the rainfall in accounting for the yield variability over the years. Further evaluation on the effect of rotation and nitrogen on time-trend (increase/decrease per cycle) was carried out only for the model using the distribution of rainfall (M2). The significance of the main effects and interactions are reflected by probability of a greater F-value than the observed one under the respective null main effects and interaction of rotation and nitrogen (data not included). There were significant (P<0·01) differences in time-trends due to rotations and N levels. For the time-trend in straw yield, rotations main effect was significant.
For grain yield, the bi-annual yield increase (Table 6) was highest (359 kg/ha) for wheat–fallow and close to that for wheat–medic, both at N90. When averaged over N levels, wheat–medic gave the highest increase (344 kg/ha) followed by wheat–vetch, while wheat–chickpea and wheat–melon showed the lowest trend (115 kg/ha). On the ranking of rotation for the straw yield trend, the rotations wheat–medic ranked highest (410 kg/ha) followed by wheat–vetch. Based on the average trend values, the order of crop rotations with decreasing trend estimates for grain yield was: medic>vetch>lentil>fallow>continuous wheat>chickpea=melon, and for straw yield: medic>vetch>fallow>lentil>continuous wheat>melon>chickpea.
Means of estimated biannual time-trend (kg/ha/2 yr) from the best models under model M2 (for explanation of the models see Table 5)

* For comparing under the same rotation.
DISCUSSION
While much information has accrued on the role of crop rotations (Karlen et al. Reference Karlen, Varvel, Bullock and Cruse1994), actual assessment must take place within a cropping production system in the context of ecoregional differences (Wagger & Denton Reference Wagger and Denton1992). The broader context of rotation assessment must include developments in tillage practices, fertilization and management of cereal residues (Lopez-Bellido et al. Reference Lopez-Bellido, Lopez-Bellido, Castillo and Lopez-Bellido2000; Halvorson et al. Reference Halvorson, Peterson and Reule2002). While Harris (Reference Harris1995) only alluded to grain yields in the early years of the trials in relation to the rotation effect, the present study embraced the full 14-year data set and considered all the factors to varying degrees, as well as the important issue of crop N responses. While the tillage system was essentially a shallow-type conservation one, it is relevant to the growing worldwide trend away from traditional ploughing to minimum tillage, but no generalizations can be made with respect to its superiority over conventional tillage within the context of alternative rotations. However, the study does permit valid conclusions to be made with respect to the possible range of rotations in Middle East cropping systems. Evidently, the impact of residue management takes longer to express itself on cereal yields in such rotation trials.
The overall effects of rotations on cereal yields after seven crop rotation cycles (14 years) were similar to those observed by Harris (Reference Harris1995) after 7 years. Thus, rotation effects express themselves with respect to cereal yields in a relatively short period of time for simple two-course rotations. That fallow had a favourable effect on cereal yield and the continuous cropping was the poorest is hardly surprising, given observations elsewhere in the Mediterranean area (Papastylianou Reference Papastylianou1993; Pala et al. Reference Pala, Matar and Mazid1996; Garabet et al. Reference Garabet, Wood and Ryan1998; Lopez-Bellido et al. Reference Lopez-Bellido, Lopez-Bellido, Castillo and Lopez-Bellido2000). Thus, it is clear that while continuous yearly cropping with cereals is an unsustainable practice, the time-honoured benefits of fallowing for yield stability due to moisture conservation are evident. However, under fallow a crop is harvested only once in every 2 years and the land lies idle in the alternative fallow year. Consequently, land use pressure has contributed largely to the disappearance of fallow in all but the driest areas in the cropping systems of West Asia (Cooper et al. Reference Cooper, Gregory, Tully and Harris1987).
The major contribution of the trial was in showing the merits of food and forage legumes as alternatives to either fallow or continuous cereal cropping. Of the forage legumes, vetch emerged as the most attractive alternative to fallow or continuous wheat since it produces a valuable animal feed, either grazed or cut for hay, in the alternative year, in addition to acceptable cereal yields. Trials in Lebanon (Yau et al. Reference Yau, Bounejmate, Ryan and Nasser2003) and Syria (Jones & Singh Reference Jones and Singh2000), and earlier in Cyprus (Papastylianou Reference Papastylianou1993) showed that vetch was a suitable replacement for barley monoculture, while on-farm trials in Syria (Christiansen et al. Reference Christiansen, Bounjemate, Bahhady, Thomson, Mawlawi and Singh2000) indicated favourable adoption rates by farmers. While medic may have desirable effects on soil structure (Masri & Ryan Reference Masri and Ryan2006), it is unlikely to be adopted by farmers for technical reasons such as difficulties with harvesting seed and grazing management for seed setting. In addition, medic has a ‘drying out effect’ for the subsequent cereal crop (Harris Reference Harris1995). The trial also showed that food legumes such as chickpea and lentil gave 50–100% more yield than continuous wheat and, at the same time, produced a crop of economic importance in the Middle East region in the alternate year. Notwithstanding the overall influence of crop rotations on subsequent cereal yields, annual variation in rainfall can greatly modify the influence of rotations (Diaz-Ambrona & Minguez Reference Diaz-Ambrona and Minguez2001). The inclusion of a summer crop in the rotation with cereal was not a success, as it was only possible to have melon grown in 5 of the 14 years due to insufficient residual moisture. In retrospect, because of its similarity with fallow and the low probability of adequate residual profile moisture in any one year, it should have been eliminated.
Of major significance in the study was the role of N fertilization, with consistent increases in response to applied N up to 90 kg N/ha as reflected by average values over all rotations for the entire period of the study (Table 3). These data broadly correspond with observations under Spanish Mediterranean conditions by Lopez-Bellido et al. (Reference Lopez-Bellido, Lopez-Bellido, Castillo and Lopez-Bellido2000) that yield responses occurred up to 100 kg N/ha in ‘wet years’, while there was no response in dry years. Reflecting the importance of rainfall, there were responses to 90 kg N/ha in the highest rainfall year (486 mm, 1987/88), and no response in the driest year (221 mm, 1989/90). Similarly, other field trials in Syria (Garabet et al. Reference Garabet, Wood and Ryan1998) demonstrated a similar order of response to N in relation to soil moisture. The observations on time-trends on wheat yields in the present study also reflect the strong influence of rainfall. Similarly, N was a significant determinant of yield trends.
The present study further showed that the relative response to N varies with the rotation, being highest for fallow and continuous wheat and least for the N-fixing legumes that added N to the succeeding wheat crop, thereby reducing the response to added N, and thus the N-use efficiency. The relative increases to applied N are in general accord with data from a Mediterranean environment in Spain (Lopez-Bellido et al. Reference Lopez-Bellido, Lopez-Bellido, Castillo and Lopez-Bellido2000). While soil N was the most obvious factor dictating the crop response, the impact of the previous crop also had a modifying effect on the response of the cereal crop to applied N fertilizer.
In contrast to rotations and N fertilization of the cereal phase of the rotations, the imposition of variable stubble grazing and zero grazing (stubble retention) had minimal effects. While one might expect zero grazing to have a positive effect on crop yields due to residue incorporation (supplying available plant N after mineralization of the straw), this may have been counterbalanced by the N in the faeces and urine of the large number of animals involved in the moderate and heavy grazing. It is possible that clear trends from grazing may emerge over a longer time of study.
In summary, the present 14-year study clearly showed that food and forage legume-based rotations are a viable alternative to traditional fallow and continuous cereal cropping. Such rotations provide not only land-use diversification, but also reduce N fertilizer needs through N fixation, and are likely to improve soil structure and water use efficiency. The impact of the alternative rotations was seen in increased yields of grain and straw, the latter being of importance in agricultural systems that are integrated with livestock production.
We acknowledge the contributions of the various scientists and support staff who were involved in the planning and management of the trial since its inception. The critical review by Dr Colin Piggin is much appreciated.